
|
시장보고서
상품코드
1938990
3D 매핑 및 3D 모델링 : 시장 점유율 분석, 업계 동향과 통계, 성장 예측(2026-2031년)3D Mapping And 3D Modelling - Market Share Analysis, Industry Trends & Statistics, Growth Forecasts (2026 - 2031) |
||||||
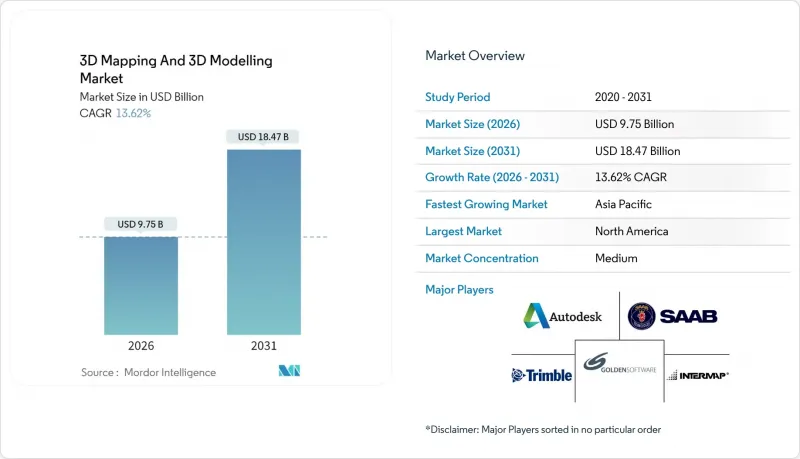
3D 매핑 및 3D 모델링 시장은 2025년에 85억 8,000만 달러로 평가되었으며, 2026년 97억 5,000만 달러에서 2031년까지 184억 7,000만 달러에 달할 것으로 예측됩니다.
예측 기간(2026-2031년) 동안 CAGR은 13.62%로 예상됩니다.

이러한 성장 궤적은 스마트폰용 LiDAR, 설계 소프트웨어에 대한 생성형 AI 통합, 인프라 디지털 트윈에 대한 정부의 의무화, 소매 및 미디어 분야의 XR 지원 컨텐츠에 대한 수요 증가에 기인합니다. 중소기업의 총소유비용을 절감하는 클라우드 네이티브 렌더링 기술과 자율주행차를 위한 고해상도 지도의 보급이 3D 매핑 및 3D 모델링 시장을 더욱 확대할 것입니다. 각 벤더들이 주요 센서와 GPU 확보를 위한 수직계열화를 추진하는 한편, 규모 확대를 위해 파트너 생태계에 플랫폼을 개방하는 움직임이 나타나면서 경쟁은 더욱 치열해질 것으로 예상됩니다.
세계 3D 매핑 및 3D 모델링 시장 동향과 인사이트
스마트폰에 탑재된 LiDAR로 실시간 3D 캡처를 대중화하다
주류 스마트폰에 내장된 LiDAR 센서는 전문적인 공간 데이터 수집에 따른 기존의 비용과 기술적 장벽을 없앴다. 애플의 VCSEL 기반 비행시간 어레이는 현재 수백만 대의 아이폰과 아이패드에 탑재되어 과거에는 산업용 스캐너가 필요했던 밀리미터 단위의 고정밀 점군을 생성하고 있습니다. 중소기업은 이러한 휴대용 센서를 활용하여 측량용 하드웨어에 대한 자본 지출 없이 저렴한 가격의 현장 스캔, 실내 문서화, 몰입형 AR 제품 디스플레이를 제공하고 있습니다. 개발자들은 애플의 ARKit을 활용하여 실시간 오클루전 처리를 실현했습니다. 이를 통해 실내 디자인 미리보기와 시설 내 워크스루가 가능해져 3D 매핑 및 3D 모델링 시장을 더욱 풍요롭게 하고 있습니다. 지속적인 소형화로 LiDAR 모듈의 두께가 얇아지고 있으며, FCC 및 CE 인증을 통해 지역 간 배포에 대한 규정 준수를 보장합니다.
생성형 AI 디자인 스위트에 3D 지형공간 레이어 통합
현재 설계 소프트웨어는 3D 지리적 공간 컨텍스트를 활용하여 개념 생성을 자동화하고 있습니다. Esri는 ArcGIS Pro에 AI 특징 추출 기능을 추가하여 원시 데이터인 점군을 의미론적 구성요소로 변환함으로써 수동 분류 작업을 70% 줄였습니다. SketchUp의 생성 엔진은 일조 조건, 바람의 흐름, 구역 규정을 고려한 수천 개의 평면도를 몇 초 만에 반복적으로 생성합니다. 이러한 AI 지원 워크플로는 친환경적인 레이아웃을 요구하는 도시 계획가나 신속한 승인을 추구하는 건축가에게 적합합니다. 개방형 IFC 및 ISO 19650 데이터 표준을 통해 AI 생성 개념은 재작업 없이 BIM 파이프라인으로 전환할 수 있으며, 건설 라이프사이클 전반에 걸쳐 3D 매핑 및 3D 모델링 시장의 적용 가능성을 확대할 수 있습니다.
GPU 및 센서 공급망에서의 높은 변동성
반도체 부족으로 GPU 가격 급등, 리드타임은 9개월 이상 연장. 이로 인해 3D 매핑 및 3D 모델링 시장을 뒷받침하는 실시간 렌더링과 딥러닝 파이프라인에 제약이 발생하고 있습니다. 자동차용 LiDAR 제조업체들도 부족한 VCSEL과 포토다이오드 공급을 놓고 경쟁하고 있으며, 대기업은 다년간의 공급 계약을 체결하고, 중소형 통합업체는 프로젝트를 연기하거나 비싼 가격에 조달해야 하는 상황입니다. 일부 기업들은 하드웨어 부족을 완화하기 위해 클라우드 렌더링 팜으로 전환하고 있지만, 이들 서비스도 마찬가지로 제한된 H100 클러스터에 의존하고 있으며, 새로운 파운드리 생산능력이 성숙할 때까지는 시스템적 취약점이 부각되고 있습니다.
부문 분석
소프트웨어는 2025년 전체 매출의 44.96%를 차지할 것으로 예상되며, 이는 특징 추출 자동화, 생성 모델링, 협업 워크플로우에서 소프트웨어의 역할을 뒷받침합니다. 서비스 부문은 규모는 작지만 2031년까지 CAGR 14.02%로 가장 빠르게 성장하는 분야입니다. 이는 기업들이 사진측량, 규제 준수, 클라우드 최적화 업무를 아웃소싱하는 추세에 따른 것입니다. 하드웨어 부문 점유율은 소폭이지만, 데이터 수집 속도를 5배 향상시키면서 유지보수 비용을 절감하는 단일 광자 LiDAR 모듈이 성장을 주도하고 있습니다.
Trimble Business Center v2024.10과 같은 소프트웨어의 발전으로 AI 알고리즘이 분류 시간을 60% 단축하여 엔지니어가 수작업 라벨링이 아닌 고부가가치 설계에 집중할 수 있게 되었습니다. 워크플로우가 구독형으로 전환되는 가운데, 조직은 프로젝트 단위 또는 장치 단위로 과금되기 때문에 예산 관리가 용이해져 3D 매핑 및 3D 모델링 시장이 확대되고 있습니다. 특히 규제가 엄격한 국방 및 인프라 프로젝트에서 사내에 사진측량 및 데이터 거버넌스 전문 지식이 부족한 경우, 서비스 수요가 증가하고 있습니다. 하드웨어의 혁신으로 소형화 및 저전력화가 지속적으로 진행되어 현장 작업자 및 긴급 대응 요원의 모바일 스캔 환경을 구현합니다.
2025년에는 엔터테인먼트 스튜디오, 제품 디자이너, 건축가가 기하학적 디테일과 시각적 스토리텔링을 우선시한 결과, 3D 모델링이 57.74%의 점유율을 차지할 것으로 예상됩니다. 한편, 인프라의 디지털화와 자율주행차 수요에 따른 센티미터 단위의 정확도 요구로 인해 3D 매핑은 14.78%의 높은 CAGR을 기록하고 있습니다. 두 분야의 융합을 통한 디지털 트윈 솔루션은 기하학적 풍부함과 공간적 정확성을 융합하여 프로젝트 수준의 3D 매핑 및 3D 모델링 시장 규모를 확대하고 있습니다.
성숙한 모델링 파이프라인에서는 오토데스크나 맥슨의 툴셋을 활용한 절차적 생성을 채택하고 있습니다. 한편, 신흥 AI 기술은 수동 키프레임 없이도 캐릭터의 자동 리깅과 물리 시뮬레이션을 실현합니다. 이에 반해 벤더는 자율주행 내비게이션을 위해 HD급 도로 모델을 정교화하여 차선 폐쇄, 보행자 등 동적 객체를 지원하고 있습니다. 벤틀리 iTwin과 같은 하이브리드 플랫폼은 엔지니어링 도면과 텍스처링된 메시를 통합하여 자산 소유자가 단일 뷰포트에서 부식 검사, 교통 흐름 모니터링, 유지보수 계획을 실행할 수 있도록 지원합니다. 상호운용성은 GIS와 CAD 영역 간의 원활한 데이터 교환을 위해 개방형 3D 타일 및 CityGML 스키마에 의존하고 있습니다.
지역 분석
북미는 2025년 전 세계 매출의 37.14%를 차지할 것으로 예상되며, 실리콘밸리의 혁신, 연방 정부의 인프라 투자, 고정밀 지리공간정보에 중점을 둔 방위 산업 계약에 힘입어 성장세를 이어갈 것으로 보입니다. 연방 기관은 자율주행차 전용 도로망을 위한 고정밀 지도를 위탁하고, 제조업체는 디트로이트와 오스틴에서 생산 효율을 높이기 위해 디지털 트윈을 도입하고 있습니다. 스마트폰 LiDAR 기술의 조기 보급과 5G의 급속한 보급으로 사용자 기반이 확대되면서 3D 매핑 및 3D 모델링 시장은 이 지역의 혁신의 최전선에 서게 되었습니다.
아시아태평양은 대규모 도시화, 스마트 공장에 대한 투자, 디지털 도시 계획에 대한 정부의 의무화로 인해 2031년까지 14.12%의 CAGR을 달성할 것으로 예상됩니다. 중국의 3D 산업용 카메라 매출은 2023년 23억 6,200만 위안(3억 2,000만 달러)에 달할 것으로 예상되며, 이는 매핑 공급업체가 탄탄한 하드웨어 기반을 갖추고 있음을 보여줍니다. 일본의 정밀 가공 수출에서는 공차 검증에 계측급 LiDAR가 채택되고 있습니다. 또한, 인도의 스마트 시티 구상에서는 100개 이상의 지자체를 대상으로 드론 측량과 BIM 결과물을 패키지화하여 제공하고 있습니다. 이러한 다양한 수요가 결합되어 아시아태평양의 3D 매핑 및 3D 모델링 시장을 주도하고 있습니다.
유럽에서는 공공 자산의 상세한 3D 기록을 의무화하는 엄격한 규제로 인해 견고한 점유율을 유지하고 있습니다. EU의 디지털 단일시장 전략과 그린딜 전략은 디지털 트윈을 활용한 탄소 저감 분석을 촉진하고, 에너지 사업체 및 교통 사업자의 3D 매핑 및 모델링 시장 확대에 기여하고 있습니다. 독일의 인더스트리 4.0 구상, 프랑스의 자율주행차 전용차선, 영국의 국가 디지털 트윈은 모두 안정적인 수요를 뒷받침하는 기반이 되고 있습니다. GDPR은 컴플라이언스에 대한 부담은 있지만, 데이터 거버넌스 역량이 입증된 공급자를 선별하는 역할도 하고 있으며, 유럽에 클라우드 리전을 두고 있는 벤더와의 계약을 촉진하고 있습니다.
기타 특전:
- 엑셀 형식의 시장 예측(ME) 시트
- 애널리스트의 3개월간 지원
자주 묻는 질문
목차
제1장 소개
제2장 조사 방법
제3장 주요 요약
제4장 시장 구도
제5장 시장 규모와 성장 예측
제6장 경쟁 구도
제7장 시장 기회와 향후 전망
KSM 26.03.09The 3D mapping and 3D modelling market was valued at USD 8.58 billion in 2025 and estimated to grow from USD 9.75 billion in 2026 to reach USD 18.47 billion by 2031, at a CAGR of 13.62% during the forecast period (2026-2031).
This growth trajectory stems from consumer-grade LiDAR in smartphones, generative AI integration into design software, government mandates for infrastructure digital twins, and rising demand for XR-ready content across retail and media. Cloud-native rendering that lowers total cost of ownership for small enterprises and the push for high-definition maps for autonomous vehicles further expand the 3D mapping and 3D modelling market. Competitive intensity increases as vendors pursue vertical integration to secure key sensors and GPUs while simultaneously opening platforms to partner ecosystems for scale.
Global 3D Mapping And 3D Modelling Market Trends and Insights
Smartphone LiDAR Commoditises Real-Time 3D Capture
LiDAR sensors embedded in mainstream smartphones remove the traditional cost and skills barriers associated with professional spatial data collection. Apple's VCSEL-based time-of-flight array now sits inside millions of iPhones and iPads, producing millimeter-grade point clouds that once required industrial scanners. Small businesses exploit these hand-held sensors to offer affordable site scans, interior documentation, and immersive AR merchandising without capital outlays for survey-grade hardware. Developers further harness Apple's ARKit to secure real-time occlusion handling, enabling interior design previews and facility walkthroughs that enrich the 3D mapping and 3D modelling market. Continuous miniaturization keeps LiDAR modules thin, while FCC and CE certifications guarantee cross-region deployment compliance.
Integration of 3D Geospatial Layers into Generative-AI Design Suites
Design software now feeds on 3D geospatial context to automate concept creation. Esri has added AI feature extraction inside ArcGIS Pro, turning raw point clouds into semantic building blocks and cutting manual classification by 70%. SketchUp's generative engine then iterates thousands of floor plans that respect solar exposure, wind flow, and zoning rules in seconds. Such AI-assisted workflows suit urban planners pressed for eco-efficient layouts and architects chasing faster approvals. Open IFC and ISO 19650 data standards move these AI-generated concepts into BIM pipelines without rework, amplifying the 3D mapping and 3D modelling market applicability across construction lifecycles.
High GPU and Sensor Supply-Chain Volatility
Semiconductor shortages send GPU prices soaring and extend lead times beyond 9 months, throttling real-time rendering and deep-learning pipelines that underpin the 3D mapping and 3D modelling market. Automotive LiDAR makers also compete for scarce VCSELs and photodiodes, prompting larger firms to lock multi-year supply deals and forcing small integrators to delay projects or pay premiums. Some enterprises pivot to cloud render farms to cushion hardware gaps, yet those services equally rely on limited H100 clusters, highlighting systemic vulnerability until new foundry capacity matures.
Other drivers and restraints analyzed in the detailed report include:
- Mandates for Digital Twins in Public Infrastructure Projects
- XR-Ready 3D Content Boom in Media and Retail
- Large-File Data-Sovereignty Compliance Costs
For complete list of drivers and restraints, kindly check the Table Of Contents.
Segment Analysis
Software generated 44.96% of overall revenue in 2025, underscoring its role in automating feature extraction, generative modeling, and collaborative workflows. Services, while smaller, is the fastest-growing component with a 14.02% CAGR to 2031 as enterprises outsource photogrammetry, regulatory compliance, and cloud optimization tasks. Hardware retains a leaner slice but benefits from single-photon LiDAR modules that quintuple data-capture speed while cutting maintenance.
Ongoing software advances such as Trimble Business Center v2024.10 slash classification time by 60% through AI algorithms, enabling engineers to focus on higher-value design rather than manual labeling. As workflows migrate to subscription bundles, organizations pay per-project or per-device, smoothing budgets and expanding the 3D mapping and 3D modelling market. Services demand rises where in-house teams lack photogrammetry or data-governance expertise, especially in regulated defense and infrastructure projects. Hardware innovation ensures continuous miniaturization and lower power draw, which unlocks mobile scanning scenarios for field crews and first responders.
3D modelling captured 57.74% share in 2025 as entertainment studios, product designers, and architects prioritized geometric detail and visual storytelling. In contrast, 3D mapping posts the superior 14.78% CAGR owing to infrastructure digitization and autonomous vehicle needs that demand centimeter-level accuracy. The convergence of both streams into digital twin solutions blends geometric richness with spatial exactness, amplifying the 3D mapping and 3D modelling market size at project level.
Mature modelling pipelines leverage Autodesk and Maxon toolsets for procedural generation, while emerging AI features auto-rig characters and simulate physics without manual keyframes. Conversely, mapping vendors refine HD-grade road models for autonomous navigation, supporting dynamic objects such as lane closures or pedestrians. Hybrid platforms such as Bentley iTwin combine engineering schematics with textured meshes, allowing asset owners to inspect corrosion, monitor traffic flow, and schedule maintenance in one viewport. Interoperability depends on open 3D Tiles and CityGML schemas that shuttle data between GIS and CAD domains seamlessly.
The 3D Mapping and 3D Modelling Market Report is Segmented by Component (Hardware, Software, and Services), Type (3D Mapping, and 3D Modelling), Application (Projection Mapping, Texture Mapping, Maps and Navigation, and More), End-User Vertical (Entertainment and Media, Healthcare, Automotive and Transportation, and More), Deployment (On-Premise, and Cloud), and Geography. The Market Forecasts are Provided in Terms of Value (USD).
Geography Analysis
North America held 37.14% of global revenue in 2025, buoyed by Silicon Valley innovation, federal infrastructure spending, and defense contracts that value high-precision geospatial intelligence. Federal agencies commission HD maps for autonomous vehicle corridors, while manufacturers adopt digital twins to streamline production in Detroit and Austin. Early consumer adoption of smartphone LiDAR and fast 5G rollout sustain a receptive user base, keeping the 3D mapping and 3D modelling market at the forefront of innovation in the region.
Asia Pacific is forecast to attain a 14.12% CAGR through 2031, propelled by massive urbanization, smart-factory investments, and government mandates for digital city planning. China's 3D industrial camera revenue climbed to CNY 2.362 billion (USD 0.32 billion) in 2023, signaling strong hardware foundations for mapping suppliers. Japan's precision machining exports adopt metrology-grade LiDAR to verify tolerances, and India's Smart Cities Mission packages drone surveys and BIM deliverables for 100+ municipalities. These multiple demand streams collectively uplift the 3D mapping and 3D modelling market in Asia Pacific.
Europe maintains robust share owing to strict regulations that compel detailed 3D documentation of public assets. The EU's Digital Single Market and Green Deal strategies encourage carbon-reduction analytics on digital twins, expanding the 3D mapping and 3D modelling market among energy utilities and transport operators. Germany's Industry 4.0 initiatives, France's autonomous-vehicle lanes, and the United Kingdom's national digital twin all scaffold consistent demand. GDPR, though a compliance burden, also differentiates providers with proven data-governance capabilities, steering contracts toward vendors with European cloud regions.
- Autodesk Inc.
- Bentley Systems Inc.
- ESRI Inc.
- Trimble Inc.
- Hexagon AB
- Saab AB
- Airbus Defence and Space SAS
- Intermap Technologies Corp.
- Topcon Positioning Systems Inc.
- CyberCity 3D Inc.
- The Foundry Visionmongers Ltd.
- Golden Software LLC
- Pix4D SA
- Maxon Computer GmbH
- Dassault Systemes SE
- Pixologic Inc.
- Matterport Inc.
- FARO Technologies Inc.
- Leica Geosystems AG
- Apple Inc. (ARKit and LiDAR)
Additional Benefits:
- The market estimate (ME) sheet in Excel format
- 3 months of analyst support
TABLE OF CONTENTS
1 INTRODUCTION
- 1.1 Study Assumptions and Market Definition
- 1.2 Scope of the Study
2 RESEARCH METHODOLOGY
3 EXECUTIVE SUMMARY
4 MARKET LANDSCAPE
- 4.1 Market Drivers
- 4.1.1 Smartphone LiDAR commoditises real-time 3D capture
- 4.1.2 Integration of 3D geospatial layers into generative-AI design suites
- 4.1.3 Mandates for digital twins in public infrastructure projects
- 4.1.4 XR-ready 3D content boom in media and retail
- 4.1.5 Cloud-native 3D rendering slashes TCO for SMEs
- 4.1.6 Growth of autonomous-vehicle HD maps
- 4.2 Market Restraints
- 4.2.1 High GPU and sensor supply-chain volatility
- 4.2.2 Large-file data-sovereignty compliance costs
- 4.2.3 Skills shortage in photogrammetry post-processing
- 4.2.4 Fragmented 3D data standards slow interoperability
- 4.3 Industry Ecosystem Analysis
- 4.3.1 Regulatory Landscape
- 4.3.2 Technological Outlook
- 4.3.3 Impact of Macroeconomic Factors
- 4.3.4 Porter's Five Forces Analysis
- 4.3.4.1 Bargaining Power of Suppliers
- 4.3.4.2 Bargaining Power of Buyers
- 4.3.4.3 Threat of New Entrants
- 4.3.4.4 Threat of Substitutes
- 4.3.4.5 Intensity of Competitive Rivalry
5 MARKET SIZE AND GROWTH FORECASTS (VALUE)
- 5.1 By Component
- 5.1.1 Hardware
- 5.1.2 Software
- 5.1.3 Services
- 5.2 By Type
- 5.2.1 3D Mapping
- 5.2.2 3D Modelling
- 5.3 By Application
- 5.3.1 Projection Mapping
- 5.3.2 Texture Mapping
- 5.3.3 Maps and Navigation
- 5.3.4 3D Rendering and Visualisation and Other Applications
- 5.4 By End-user Vertical
- 5.4.1 Entertainment and Media
- 5.4.2 Healthcare
- 5.4.3 Building and Construction
- 5.4.4 Automotive and Transportation
- 5.4.5 Defense and Security and Other nd-user Verticals
- 5.5 By Deployment
- 5.5.1 On-premise
- 5.5.2 Cloud
- 5.6 By Geography
- 5.6.1 North America
- 5.6.1.1 United States
- 5.6.1.2 Canada
- 5.6.1.3 Mexico
- 5.6.2 South America
- 5.6.2.1 Brazil
- 5.6.2.2 Argentina
- 5.6.2.3 Chile
- 5.6.2.4 Colombia
- 5.6.3 Europe
- 5.6.3.1 Germany
- 5.6.3.2 France
- 5.6.3.3 United Kingdom
- 5.6.3.4 Italy
- 5.6.3.5 Spain
- 5.6.3.6 Russia
- 5.6.4 Asia Pacific
- 5.6.4.1 China
- 5.6.4.2 Japan
- 5.6.4.3 India
- 5.6.4.4 South Korea
- 5.6.4.5 Australia
- 5.6.4.6 New Zealand
- 5.6.4.7 Indonesia
- 5.6.5 Middle East
- 5.6.5.1 Saudi Arabia
- 5.6.5.2 United Arab Emirates
- 5.6.5.3 Turkey
- 5.6.5.4 Israel
- 5.6.5.5 Qatar
- 5.6.6 Africa
- 5.6.6.1 South Africa
- 5.6.6.2 Nigeria
- 5.6.6.3 Kenya
- 5.6.6.4 Egypt
- 5.6.6.5 Morocco
- 5.6.1 North America
6 COMPETITIVE LANDSCAPE
- 6.1 Strategic Moves
- 6.2 Market Share Analysis
- 6.3 Company Profiles (includes Global level Overview, Market level overview, Core Segments, Financials as available, Strategic Information, Market Rank/Share for key companies, Products and Services, and Recent Developments)
- 6.3.1 Autodesk Inc.
- 6.3.2 Bentley Systems Inc.
- 6.3.3 ESRI Inc.
- 6.3.4 Trimble Inc.
- 6.3.5 Hexagon AB
- 6.3.6 Saab AB
- 6.3.7 Airbus Defence and Space SAS
- 6.3.8 Intermap Technologies Corp.
- 6.3.9 Topcon Positioning Systems Inc.
- 6.3.10 CyberCity 3D Inc.
- 6.3.11 The Foundry Visionmongers Ltd.
- 6.3.12 Golden Software LLC
- 6.3.13 Pix4D SA
- 6.3.14 Maxon Computer GmbH
- 6.3.15 Dassault Systemes SE
- 6.3.16 Pixologic Inc.
- 6.3.17 Matterport Inc.
- 6.3.18 FARO Technologies Inc.
- 6.3.19 Leica Geosystems AG
- 6.3.20 Apple Inc. (ARKit and LiDAR)
7 MARKET OPPORTUNITIES AND FUTURE OUTLOOK
- 7.1 White-Space and Unmet-Need Assessment
