|
시장보고서
상품코드
1939125
유황 : 시장 점유율 분석, 업계 동향과 통계, 성장 예측(2026-2031년)Sulfur - Market Share Analysis, Industry Trends & Statistics, Growth Forecasts (2026 - 2031) |
||||||
유황 시장은 2025년에 8,479만 메트릭톤으로 평가되었으며, 2026년 8,874만 메트릭톤에서 2031년까지 1억 1,144만 메트릭톤에 달할 것으로 예측됩니다.
예측 기간(2026-2031년) 동안 CAGR은 4.66%로 예상됩니다.

비료의 지속적인 소비, 초저유황경유(ULSD) 규제에 따른 정유사 생산량, 그리고 초기 단계의 배터리 기술 혁신으로 환경 규제가 강화되는 상황에서도 유황 시장은 꾸준히 확대되고 있습니다. 아시아태평양은 인구 증가에 따른 식량 수요, 정유소 용량, 산업 다각화로 인해 공급량과 소비량 모두 최대 규모를 유지하며 지리적 핵심 지역으로서의 지위를 유지하고 있습니다. 고체 형태의 유황은 용융유황 취급에 필요한 고비용의 가열처리, 특수탱크, 안전관리를 피할 수 있어 물류 측면에서 우위를 점하고 있습니다. 경쟁 환경은 유황 회수를 비용 상쇄 제품별로 인식하는 석유 및 가스 복합기업에 유리하게 작용하지만, 리튬유황전지나 유황 개질 건축자재와 같은 고부가가치 용도는 중소 전문업체들의 고순도 생산능력 구축을 촉진하고 있습니다. 지속적인 SOx 배출 규제와 고비용의 용융 물류는 단기적인 장벽이 될 수 있지만, 유황 시장의 5년 성장 전망을 저해하지는 않을 것입니다.
세계 유황 시장 동향 및 전망
비료 제조 수요 증가
세계 식량 안보 목표에 따라 비료 생산량은 높은 수준을 유지할 것이며, 2025년에는 유황 시장 수요의 88.96%를 차지할 것으로 예상됩니다. 인도는 2024년 인산염과 칼륨비료 보조금으로 680억 달러를 책정했으며, 이 정책으로 인해 다량의 황이 서방형 비료 혼합에 포함되었습니다. 중국의 현대화 추진은 황폐화된 토양을 개선하기 위한 유황 공급을 지원하고 있으며, 인도네시아와 말레이시아의 팜유 재배 면적 확대는 이 지역의 영양소 요구량을 증가시키고 있습니다. 정밀농업 시스템에는 유황이 풍부한 미량영양소 배합이 요구되며, 이는 비료 단위당 유황 함량을 증가시켜 분산된 수요 기반을 형성하여 유황 시장을 지역적 충격으로부터 보호하고 있습니다.
초저유황 경유(ULSD) 정제 능력 확대
초저유황경유(ULSD) 규제로 인해 정유사들은 연료에서 유황을 추출해야 하고, 그 공급이 유황 시장으로 환원되고 있습니다. 사우디 자잔 정유소의 새로운 탈황 설비는 2024년 65만 톤의 공급 능력을 추가하고, 마라톤 페트롤리엄의 갤버스턴 베이 확장 프로젝트는 42만 톤을 추가로 공급할 예정입니다. 북미와 유럽의 정유사들은 2030년까지 안정적인 제품별 공급을 확보하기 위해 투자를 지속하고 있으며, 과거 유황 공급 부족으로 어려움을 겪었던 지역의 다운스트림 접근성을 개선하기 위해 노력하고 있습니다.
지역에 관계없이 엄격한 SOx 배출 규제
EU 산업 배출 지침은 2030년까지 황산 공장의 SOx 배출량을 95% 감축하도록 규정하고 있습니다. 미국 국가 대기질 기준은 모니터링 및 스크러버 비용을 톤당 2-4달러 증가시켜 소규모 가공업체들의 통합을 촉진하고 있습니다. 중국에서는 배출가스 규제가 강화되어 위반 기업에는 매출액의 10%에 해당하는 벌금이 부과됩니다. 이러한 규제는 자본 장벽을 높이고 생산능력 증가를 지연시켜 단기적으로 황 시장의 성장 모멘텀을 억제할 것으로 예상됩니다.
부문 분석
고체 제품은 2025년 황 시장 점유율의 80.62%를 차지할 것으로 예상되며, 2031년까지 연평균 5.08%의 CAGR을 기록할 것으로 예상됩니다. 전문 설비를 갖추지 못한 비료업체들이 고체 제품을 선호하는 배경에는 취급의 용이성, 낮은 보험료, 가열 보관이 필요 없는 점 등이 있습니다. 자동 적재 및 분진 억제 설비 개선으로 운영 리스크가 감소함에 따라 고체 황의 시장 규모는 더욱 확대될 것으로 전망됩니다.
입상 및 프리링 형태는 운송 중 제품 무결성을 향상시키고, ISO 14001 관리 시스템을 준수하며, 환경 노출을 줄입니다. 액체 황은 용융 원료가 직접 공정 라인에 통합되는 대규모 황산 복합 시설에 국한되어 있으며, 높은 물류 비용으로 인해 광범위한 채택을 억제하고 있습니다. 따라서 고체 황은 신흥 배터리 및 건설 사용자들이 입상 원료를 지정하는 가운데 선도적인 지위를 유지하고 있습니다.
유황 시장 보고서는 형태별(고체, 액체), 마무리 공정 기술별(과립, 페이스트, 과립), 최종사용자 산업별(비료, 화학 가공, 금속 제조, 고무 가공, 기타 최종사용자 산업), 지역별(아시아태평양, 북미, 유럽, 남미, 중동, 아프리카)로 분류됩니다. 시장 예측은 미터톤 단위로 제공됩니다.
지역별 분석
아시아태평양은 2025년 세계 소비량의 39.40%를 차지하며 2031년까지 CAGR 5.55%를 기록할 것으로 예상됩니다. 중국은 곡물 자급자족 목표에 따라 인산 비료 목표에 따라 2,850만 톤을 소비했습니다. 인도의 농업 지원책과 동남아시아의 플랜테이션 작물에 의한 비료 수요 증가는 이 지역을 황 시장의 주요 성장 동력으로 삼고 있습니다.
북미에서는 네바다주와 텍사스주의 초저유황 경유(ULSD)에 대한 투자와 리튬유황전지 공장 건설이 추진력이 되어 지역 공급에 추가 수요를 창출하고 수급 균형의 기반을 공고히 하고 있습니다. 유럽에서는 정밀농업의 발전과 규제 변화로 인해 합성화학제품보다 유황계 토양 개량제가 선호되는 추세입니다. 중동 및 아프리카에서는 정유소의 회수율 향상과 농업 프로그램 추진으로 비료 사용량이 증가하고 있으며, 유황 시장의 지리적 다변화가 진행되고 있습니다.
기타 특전:
- 엑셀 형식의 시장 예측(ME) 시트
- 애널리스트의 3개월간 지원
자주 묻는 질문
목차
제1장 소개
제2장 조사 방법
제3장 주요 요약
제4장 시장 구도
제5장 시장 규모와 성장 예측
제6장 경쟁 구도
제7장 시장 기회와 향후 전망
KSM 26.03.09The Sulfur Market was valued at 84.79 Million metric tons in 2025 and estimated to grow from 88.74 Million metric tons in 2026 to reach 111.44 Million metric tons by 2031, at a CAGR of 4.66% during the forecast period (2026-2031).
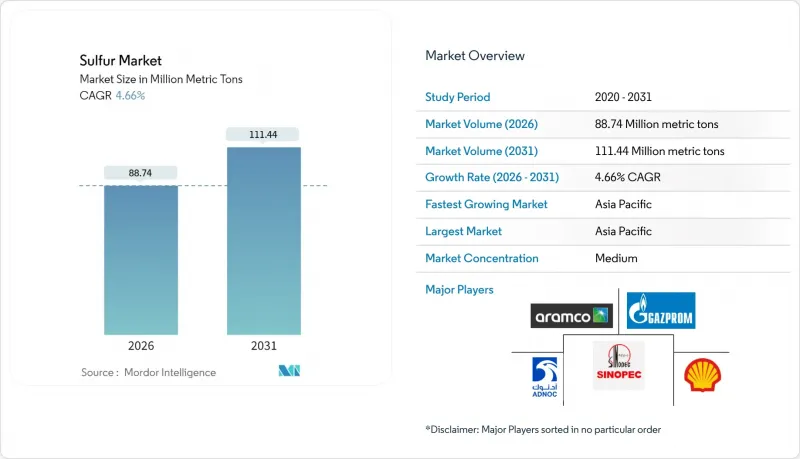
Ongoing fertilizer consumption, refinery output tied to ultra-low-sulfur diesel (ULSD) mandates, and early-stage battery innovation keep the sulfur market on a steady expansion path even as environmental rules tighten. Asia-Pacific remains the geographic anchor, supplying and consuming the largest volumes thanks to population-driven food demand, refinery capacity, and industrial diversification. Solid-form material dominates logistics because it avoids the costly heating, specialized tanks, and safety controls required for molten handling. Competitive behavior skews toward integrated oil and gas conglomerates that treat sulfur recovery as a cost-offsetting by-product, yet premium outlets in lithium-sulfur batteries and sulfur-modified construction materials are motivating smaller specialists to build high-purity capacity. Persistent SOx-emission caps and high-cost molten logistics pose near-term hurdles, but they do not dilute the five-year growth outlook for the sulfur market.
Global Sulfur Market Trends and Insights
Rising Demand from Fertilizer Manufacturing
Global food-security targets keep fertilizer output high, anchoring 88.96% of sulfur market demand in 2025. India earmarked USD 68 billion to subsidize phosphate and potash nutrients in 2024, a policy that pulled large sulfur volumes into controlled-release blends. China's modernization drive supports sulfur supplementation to upgrade depleted soils, while palm-oil acreage in Indonesia and Malaysia lifts regional nutrient intensity. Precision agriculture systems require sulfur-rich micronutrient formulations, which raise the sulfur content per fertilizer unit and create a dispersed demand base that shields the sulfur market from regional shocks.
Expansion of Ultra-Low-Sulfur Diesel Refining Capacity
ULSD legislation forces refiners to extract sulfur from fuel, generating a supply that flows back into the sulfur market. New desulfurization units in Saudi Arabia's Jazan refinery added 650,000 metric tons in 2024, and Marathon Petroleum's Galveston Bay expansion supplied another 420,000 metric tons. North American and European refiners continue to invest, ensuring steady by-product output through 2030 and improving downstream access in regions that once struggled with limited sulfur availability.
Stringent SOx-Emission Regulations Across Regions
The EU Industrial Emissions Directive mandates 95% SOx abatement in sulfuric-acid plants by 2030. The U.S. National Ambient Air Quality Standards add USD 2-4 per metric ton in monitoring and scrubber costs, nudging small processors toward consolidation. China's tighter stack-emission limits introduce fines at 10% of revenue for non-compliance. These rules raise capital barriers that slow capacity additions, trimming growth momentum for the sulfur market in the near term.
Other drivers and restraints analyzed in the detailed report include:
- Increasing Sulfur Usage in Rubber Vulcanization
- Commercialization of Lithium-Sulfur Batteries for E-Mobility
- High Logistics and Handling Cost for Molten Sulfur
For complete list of drivers and restraints, kindly check the Table Of Contents.
Segment Analysis
Solid products represented 80.62% of the sulfur market share in 2025 and are tracking a 5.08% CAGR to 2031. Handling ease, lower insurance premiums and the absence of heated storage explain the preference among fertilizer producers lacking specialized infrastructure. The sulfur market size for solid material is poised to rise further as automated loading and dust-suppression upgrades lower operational risks.
Granular and prilled formats also improve product integrity during transport, align with ISO 14001 management systems and reduce environmental exposure. Liquid sulfur stays limited to large sulfuric-acid complexes where molten feed integrates directly into process lines, but its high logistics bill caps broad adoption. Solid sulfur therefore keeps its leadership as emerging battery and construction users also specify granulated inputs.
The Sulfur Market Report is Segmented by Form (Solid and Liquid), Finishing-Process Technology (Granules, Pastilles, and Prilling), End-User Industry (Fertilizer, Chemical Processing, Metal Manufacturing, Rubber Processing, and Other End-User Industries), and Geography (Asia-Pacific, North America, Europe, South America, and Middle-East and Africa). The Market Forecasts are Provided in Terms of Volume (Metric Tons).
Geography Analysis
Asia-Pacific held 39.40% of global volume in 2025 and is pacing a 5.55% CAGR to 2031. China consumed 28.5 million metric tons, driven by phosphate fertilizer targets aligned with grain self-sufficiency goals. India's farm-support schemes and Southeast Asian plantation crops push fertilizer tonnage upward, making the region the core growth engine of the sulfur market.
North America is propelled by ULSD investments and lithium-sulfur battery plants in Nevada and Texas, placing incremental pull on regional supply, anchoring a balanced demand-supply position. Europe advances on precision farming and regulatory shifts that favor sulfur-based soil additives over synthetic chemicals. Middle East and Africa expand refinery recovery and promote agriculture programs that enlarge fertilizer use, widening geographic diversification for the sulfur market.
- ADNOC
- China Petroleum & Chemical Corporation (Sinopec)
- Flexsys America L.P.
- Gazprom International Limited
- Indian Oil Corporation Ltd
- Marathon Petroleum Corporation
- QatarEnergy LNG
- Saudi Arabian Oil Co.
- Shell plc
- Suncor Energy Inc.
- Tengizchevroil LLP
- Valero
Additional Benefits:
- The market estimate (ME) sheet in Excel format
- 3 months of analyst support
TABLE OF CONTENTS
1 Introduction
- 1.1 Study Assumptions and Market Definition
- 1.2 Scope of the Study
2 Research Methodology
3 Executive Summary
4 Market Landscape
- 4.1 Market Overview
- 4.2 Market Drivers
- 4.2.1 Rising demand from fertilizer manufacturing
- 4.2.2 Expansion of ultra-low-sulfur diesel (ULSD) refining capacity
- 4.2.3 Increasing sulfur usage in rubber vulcanization
- 4.2.4 Commercialization of lithium-sulfur batteries for e-mobility
- 4.2.5 Growing adoption of sulfur-modified asphalt and concrete in circular construction
- 4.3 Market Restraints
- 4.3.1 Stringent SOx-emission regulations across regions
- 4.3.2 High logistics and handling cost for molten sulfur
- 4.3.3 Declining sulfur recovery as refineries decarbonize and desulfurize less crude
- 4.4 Value Chain Analysis
- 4.5 Porter's Five Forces
- 4.5.1 Bargaining Power of Suppliers
- 4.5.2 Bargaining Power of Buyers
- 4.5.3 Threat of New Entrants
- 4.5.4 Threat of Substitutes
- 4.5.5 Degree of Competition
5 Market Size and Growth Forecasts (Volume)
- 5.1 By Form
- 5.1.1 Solid
- 5.1.2 Liquid
- 5.2 By Finishing-Process Technology
- 5.2.1 Granules
- 5.2.2 Pastilles
- 5.2.3 Prilling
- 5.3 By End-User Industry
- 5.3.1 Fertilizer
- 5.3.2 Chemical Processing
- 5.3.3 Metal Manufacturing
- 5.3.4 Rubber Processing
- 5.3.5 Other End-User Industries
- 5.4 By Geography
- 5.4.1 Asia-Pacific
- 5.4.1.1 China
- 5.4.1.2 India
- 5.4.1.3 Japan
- 5.4.1.4 South Korea
- 5.4.1.5 ASEAN Countries
- 5.4.1.6 Rest of Asia-Pacific
- 5.4.2 North America
- 5.4.2.1 United States
- 5.4.2.2 Canada
- 5.4.2.3 Mexico
- 5.4.3 Europe
- 5.4.3.1 Germany
- 5.4.3.2 United Kingdom
- 5.4.3.3 Italy
- 5.4.3.4 France
- 5.4.3.5 Russia
- 5.4.3.6 Rest of Europe
- 5.4.4 South America
- 5.4.4.1 Brazil
- 5.4.4.2 Argentina
- 5.4.4.3 Rest of South America
- 5.4.5 Middle-East and Africa
- 5.4.5.1 Saudi Arabia
- 5.4.5.2 South Africa
- 5.4.5.3 Rest of Middle-East and Africa
- 5.4.1 Asia-Pacific
6 Competitive Landscape
- 6.1 Market Concentration
- 6.2 Strategic Moves
- 6.3 Market Share (%)/Ranking Analysis
- 6.4 Company Profiles {(includes Global level Overview, Market level overview, Core Segments, Financials as available, Strategic Information, Market Rank/Share for key companies, Products and Services, and Recent Developments)}
- 6.4.1 ADNOC
- 6.4.2 China Petroleum & Chemical Corporation (Sinopec)
- 6.4.3 Flexsys America L.P.
- 6.4.4 Gazprom International Limited
- 6.4.5 Indian Oil Corporation Ltd
- 6.4.6 Marathon Petroleum Corporation
- 6.4.7 QatarEnergy LNG
- 6.4.8 Saudi Arabian Oil Co.
- 6.4.9 Shell plc
- 6.4.10 Suncor Energy Inc.
- 6.4.11 Tengizchevroil LLP
- 6.4.12 Valero
7 Market Opportunities and Future Outlook
- 7.1 White-space and unmet-need assessment
