


|
시장보고서
상품코드
1939746
아시아태평양의 섬유 : 시장 점유율 분석, 업계 동향과 통계, 성장 예측(2026-2031년)Asia-Pacific Textile - Market Share Analysis, Industry Trends & Statistics, Growth Forecasts (2026 - 2031) |
||||||
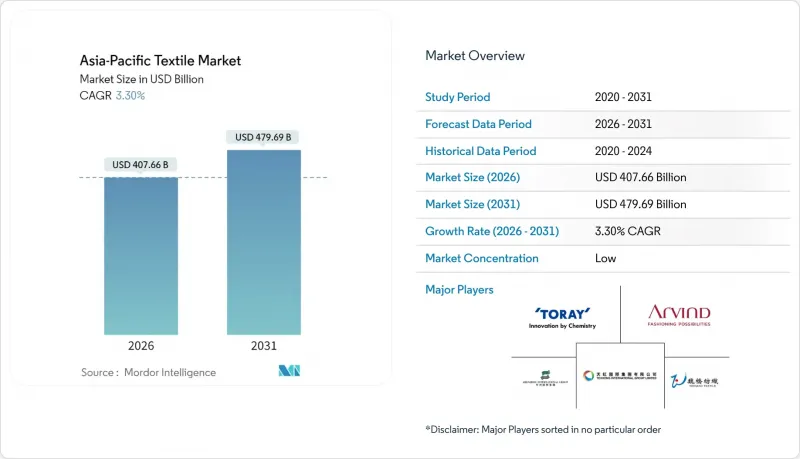
아시아태평양의 섬유 산업 시장은 2025년 3,946억 4,000만 달러에서 2026년에는 4,076억 6,000만 달러로 성장하여 2026년부터 2031년까지 CAGR 3.3%를 기록하며 2031년까지 4,796억 9,000만 달러에 달할 것으로 예측됩니다.

이러한 꾸준한 성장세의 이면에는 마진이 낮은 대량 생산 제품과 현재 프리미엄 가격이 책정되는 고부가가치 기술 응용 분야 간의 격차가 확대되고 있습니다. 비용 중심의 생산은 기존 거점에 집중되는 반면, 기술 집약적 제조는 첨단 기계와 숙련된 노동력을 갖춘 신흥 하위 지역으로 이동하고 있습니다. 에너지 비용 상승, ESG 컴플라이언스 의무, 자동화 투자가 경쟁 우위를 재구축하고, 공급망 다각화 및 수직적 통합 운영을 촉진하고 있습니다. 따라서 아시아태평양의 섬유산업 시장은 대량생산이 아닌 효율성 향상과 제품 혁신이 수익성을 결정하는 양극화된 성장 패턴으로 전환되고 있습니다.
아시아태평양 섬유 시장 동향 및 인사이트
의류 지출의 고급화
아시아태평양 도시 지역의 가처분 소득 증가는 고급 및 기능성 의류에 대한 수요를 증가시키고 있습니다. 이에 대해 브랜드는 추적성 플랫폼과 환경 친화적인 생산 공정에 대한 투자로 대응하고 있습니다. 이를 통해 제조업체는 수직적 통합을 통해 높은 수익률을 확보할 수 있습니다. 예를 들어, 엘메네질도 제니아는 2023년 지역 섬유 매출액이 1억 6,610만 달러에 달해 원자재 가격 변동에 대한 프리미엄 전략의 완충 효과를 뒷받침하고 있습니다. 기능성 섬유 공급업체는 성능 특성으로 인해 일반 원단의 3-5배에 달하는 가격 책정을 정당화할 수 있기 때문에 가장 큰 혜택을 누리고 있습니다.
조직화된 패션 소매업의 성장
대규모 소매 체인이 유통을 지배하고 있으며, 엄격한 품질, 납기, 규정 준수 기준을 요구하고 있습니다. 인도의 수출액이 2025년도에 366억 달러에 달할 수 있었던 것은 인증 공장이 이러한 바이어의 요구사항을 충족시킬 수 있었기 때문입니다. 매장 네트워크가 확장됨에 따라 경쟁은 가격에서 서비스 수준, 환경 감사, 디지털 협업 도구로 이동하여 소규모의 비준수 공장을 퇴출시키고 있습니다.
에너지 가격 변동성
방적 공정은 공장 전력 소비의 최대 70%를 차지하기 때문에 급격한 요금 인상은 조수익률을 압박할 수 있습니다. 일부 인도 주에서는 보조금이 제공되고 있지만, 대부분 비용의 일부만 충당하고 소규모 공장은 폐쇄 또는 합병으로 내몰리고 있습니다. 대규모 그룹은 장기 전력 구매 계약과 부지 내 태양광발전 설비를 통한 헤지로 즉각적인 영향을 완화하고 있지만, 예상 성장률은 여전히 억제되고 있습니다.
부문 분석
산업용 및 기술용 카테고리는 연평균 4.65%의 CAGR로 성장하고 있으며, 자동차, 의료, 필터 분야의 바이어들이 고성능 기판을 요구함에 따라 아시아태평양 섬유 산업 시장에서 매년 점유율을 높여가고 있습니다. 반면, 패션-의류 분야의 46.55% 점유율은 지속가능성에 대한 역풍으로 인해 패스트 패션의 물량 증가가 상쇄되면서 거의 확대되지 않았습니다. 의료용 부직포는 팬데믹 기간과 그 이후에 급증했으며, 자동차 섬유는 전기자동차의 열 관리 요구로 인해 혜택을 받고 있습니다. 가정용 부문은 도시화로 인해 안정세를 유지하는 반면, 보호 장비는 노동 안전 규제 강화에 따라 성장하고 있습니다. 센서의 고도의 통합으로 의류와 스마트 패브릭의 경계가 모호해지면서 프리미엄 주문의 잠재적 시장이 확대되고 있습니다.
단기적 전망으로는, 기술계 공급업체들이 규제 장벽, 의료 분야의 ISO 13485 표준, 운송 분야의 엄격한 OEM 사양을 활용하여 신규 진입을 저지할 것으로 예상됩니다. 기존 공급업체는 자동 직기 및 첨단 코팅 기술에 대한 투자를 통해 부가가치가 높은 틈새 시장에서의 우위를 강화할 수 있습니다. 이러한 움직임은 예측 기간 동안 아시아태평양 전체 섬유 산업 시장에서 기술 부문과 상품 부문의 수익성 격차를 확대할 것으로 예상됩니다.
기타 특전:
- 엑셀 형식의 시장 예측(ME) 시트
- 애널리스트 지원(3개월)
자주 묻는 질문
목차
제1장 소개
제2장 조사 방법
제3장 주요 요약
제4장 시장 구도
제5장 시장 규모와 성장 예측(금액, 10억 달러)
제6장 경쟁 구도
제7장 시장 기회와 향후 전망
KSM 26.03.09The APAC Textile Industry Market is expected to grow from USD 394.64 billion in 2025 to USD 407.66 billion in 2026 and is forecast to reach USD 479.69 billion by 2031 at 3.3% CAGR over 2026-2031.
This steady headline number masks a widening gap between low-margin bulk products and higher-value technical applications that now attract premium pricing. Cost-sensitive output continues to cluster in traditional hubs, while technology-intensive manufacturing migrates to newer sub-regions equipped with advanced machinery and skilled labor. Rising energy costs, ESG compliance mandates, and automation investments are reshaping competitive advantages, prompting both supply-chain diversification and vertically integrated operations. The APAC textile industry market, therefore, moves toward a dual-track growth pattern in which efficiency gains and product innovation, rather than volume alone, determine profitability.
Asia-Pacific Textile Market Trends and Insights
Premiumization of Apparel Spend
Growing disposable incomes in APAC's metropolitan areas lift demand for luxury and performance garments. Brands respond by investing in traceability platforms and low-impact production, which lets manufacturers capture higher margins through vertical integration. Ermenegildo Zegna, for instance, reported USD 166.1 million in regional textile revenue in 2023, underscoring the insulating effect of premium positioning against raw-material volatility. Technical-textile suppliers benefit most because their performance attributes justify price points that are three to five times above commodity fabrics.
Growth of Organized Fashion Retail
Large retail chains now dominate distribution and insist on strict quality, delivery, and compliance standards. India's exports reached USD 36.6 billion in FY 2025, in part because certified mills could meet these buyer requirements. As store networks scale, they shift competition away from price and toward service levels, environmental audits, and digital collaboration tools, edging out small, non-compliant factories.
Energy-Price Volatility
Spinning consumes up to 70% of a mill's electricity, so sudden rate hikes compress gross margins. While some Indian states offer subsidies, most cover only a fraction of costs, pushing small mills toward closure or merger. Larger groups hedge through long-term power-purchase agreements and on-site solar arrays, dampening the immediate impact but still trimming forecast growth.
Other drivers and restraints analyzed in the detailed report include:
- Near-shoring to ASEAN + India
- ESG-linked Sourcing Mandates
- Stringent Wastewater Norms
For complete list of drivers and restraints, kindly check the Table Of Contents.
Segment Analysis
Industrial and technical categories are on a 4.65% CAGR, lifting their portion of the APAC textile industry market size each year as automotive, medical, and filtration buyers specify higher-performance substrates. In contrast, fashion and apparel's 46.55% share shows minimal expansion because sustainability headwinds offset fast-fashion volume. Medical non-wovens surged during and after the pandemic, and automotive textiles benefit from electric-vehicle heat-management needs. Household segments hold steady due to urbanization, while protective gear grows alongside occupational-safety legislation. Greater sensor integration blurs lines between apparel and smart-fabric niches, expanding the addressable pool of premium orders.
The near-term outlook sees technical providers capitalizing on regulatory barriers, ISO 13485 in healthcare, and stringent OEM specifications in transport, which discourage new entrants. Existing suppliers invest in automated looms and advanced coatings, reinforcing their grip on value-added niches. Over the forecast period, these moves will widen the profitability gap between technical and commodity segments within the broader APAC textile industry market.
The Asia-Pacific Textile Market Report is Segmented by Application (Fashion & Apparel, Industrial/Technical Textiles, Household & Home Textiles, and More), by Raw Material (Natural Fibers, Synthetic Fibers, and More), by Process (Woven, Knitted, Non-Woven, and More), and by Geography (China, India, Bangladesh, Australia, South Korea, Japan, ASEAN, Rest of Asia-Pacific). The Market Forecasts are Provided in Terms of Value (USD).
List of Companies Covered in this Report:
- Shenzhou International Group
- Weiqiao Textile
- Texhong Textile Group
- Toray Industries
- Arvind Ltd
- Vardhman Textiles Ltd
- Far Eastern New Century (FENC)
- Hyosung TNC
- Bombay Dyeing & Mfg Co
- Bombay Rayon Fashions
- Pacific Textiles
- Luthai Textile
- Nisshinbo Holdings
- PT Sri Rejeki Isman (Sritex)
- Raymond Ltd
- Fabindia Overseas
- Youngone Corp
- Indorama Ventures (IVL Fibres)
- Teijin Ltd
- Cotton Corporation of India
Additional Benefits:
- The market estimate (ME) sheet in Excel format
- 3 months of analyst support
TABLE OF CONTENTS
1 Introduction
- 1.1 Study Assumptions & Market Definition
- 1.2 Scope of the Study
2 Research Methodology
3 Executive Summary
4 Market Landscape
- 4.1 Market Overview
- 4.2 Market Drivers
- 4.2.1 Premiumisation of apparel spend
- 4.2.2 Growth of organised fashion retail
- 4.2.3 ESG-linked sourcing mandates by global brands
- 4.2.4 Emerging "near-shoring" to ASEAN+India
- 4.2.5 Breakthroughs in bio-based fibre R&D
- 4.2.6 AI-driven demand-forecasting adoption
- 4.3 Market Restraints
- 4.3.1 Energy-price volatility hitting spinning margins
- 4.3.2 Stringent wastewater norms for dye-houses
- 4.3.3 US-China trade policy uncertainty
- 4.3.4 Loom-level labour shortages in tier-2 clusters
- 4.4 Value / Supply-Chain Analysis
- 4.5 Regulatory Outlook
- 4.6 Technological Outlook
- 4.7 Insights into the E-commerce Market
- 4.8 Industry Attractiveness - Porter's Five Forces
- 4.8.1 Bargaining Power of Buyers
- 4.8.2 Bargaining Power of Suppliers
- 4.8.3 Threat of New Entrants
- 4.8.4 Threat of Substitutes
- 4.8.5 Competitive Rivalry
5 Market Size & Growth Forecasts (Value, USD Billion)
- 5.1 By Application
- 5.1.1 Fashion & Apparel
- 5.1.2 Industrial/Technical Textiles
- 5.1.3 Household & Home Textiles
- 5.1.4 Medical & Healthcare Textiles
- 5.1.5 Automotive & Transport Textiles
- 5.1.6 Others (Protective, Sports Textiles, etc.)
- 5.2 By Raw Material
- 5.2.1 Natural Fibers
- 5.2.1.1 Cotton
- 5.2.1.2 Wool
- 5.2.1.3 Silk
- 5.2.2 Synthetic Fibers
- 5.2.2.1 Polyester
- 5.2.2.2 Nylon
- 5.2.2.3 Rayon / Viscose
- 5.2.2.4 Acrylic
- 5.2.2.5 Polypropylene
- 5.2.3 Recycled Fibers
- 5.2.4 Others (Speciality High-Performance Fibers (Aramid, Carbon, UHMWPE))
- 5.2.1 Natural Fibers
- 5.3 By Process / Technology
- 5.3.1 Woven
- 5.3.2 Knitted
- 5.3.3 Non-woven
- 5.3.3.1 Spunlaid (Spunbond / Melt-blown)
- 5.3.3.2 Dry-laid Hydro-entangled
- 5.3.3.3 Wet-Laid
- 5.3.3.4 Needle-punched
- 5.3.4 3-D Weaving & Spacer Fabrics
- 5.4 By Geography
- 5.4.1 China
- 5.4.2 India
- 5.4.3 Bangladesh
- 5.4.4 Australia
- 5.4.5 South Korea
- 5.4.6 Japan
- 5.4.7 ASEAN (Indonesia, Thailand, Philippines, Malaysia, Vietnam)
- 5.4.8 Rest of Asia-Pacific
6 Competitive Landscape
- 6.1 Market Concentration
- 6.2 Strategic Moves
- 6.3 Market Share Analysis
- 6.4 Company Profiles (includes Global level Overview, Market level overview, Core Segments, Financials as available, Strategic Information, Products & Services, and Recent Developments)
- 6.4.1 Shenzhou International Group
- 6.4.2 Weiqiao Textile
- 6.4.3 Texhong Textile Group
- 6.4.4 Toray Industries
- 6.4.5 Arvind Ltd
- 6.4.6 Vardhman Textiles Ltd
- 6.4.7 Far Eastern New Century (FENC)
- 6.4.8 Hyosung TNC
- 6.4.9 Bombay Dyeing & Mfg Co
- 6.4.10 Bombay Rayon Fashions
- 6.4.11 Pacific Textiles
- 6.4.12 Luthai Textile
- 6.4.13 Nisshinbo Holdings
- 6.4.14 PT Sri Rejeki Isman (Sritex)
- 6.4.15 Raymond Ltd
- 6.4.16 Fabindia Overseas
- 6.4.17 Youngone Corp
- 6.4.18 Indorama Ventures (IVL Fibres)
- 6.4.19 Teijin Ltd
- 6.4.20 Cotton Corporation of India
7 Market Opportunities & Future Outlook
- 7.1 White-space & Unmet-Need Assessment
