
|
시장보고서
상품코드
1939750
디지털 지도 : 시장 점유율 분석, 업계 동향과 통계, 성장 예측(2026-2031년)Digital Map - Market Share Analysis, Industry Trends & Statistics, Growth Forecasts (2026 - 2031) |
||||||
2026년 디지털 지도 시장 규모는 328억 달러로 추정되며, 2025년 289억 7,000만 달러에서 성장하여 2031년에는 609억 6,000만 달러에 달할 것으로 예측됩니다.
2026년부터 2031년까지 연평균 성장률(CAGR)은 13.21%에 달할 것으로 예상됩니다.
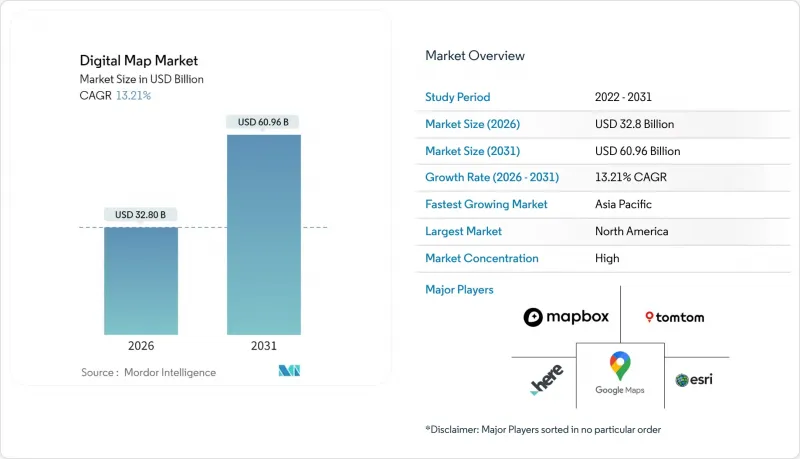
이러한 성장은 자율주행차, 스마트 시티의 디지털 트윈, 실시간 지리 정보 시스템을 지원하는 AI 기반 클라우드 네이티브 플랫폼으로의 전환에 기인합니다. EU의 eCall 및 기업 내 Scope 3 탄소 매핑 규정과 같은 규제 요건으로 인해 기존 내비게이션의 채택이 확대되고 있습니다.
세계 디지털 지도 시장 동향과 인사이트
ADAS 및 자율주행차를 위한 HD맵의 급속한 대중화
BMW는 2024년 독일 최초로 레벨3 자율주행 시스템을 도입했습니다. 이 시스템은 HERE HD Live Map을 채택하여 위치 확인, 경로 계획, 운영 설계 영역 검증에서 차선 수준(17cm 이내)의 정확도를 실현하고 있습니다. HERE의 고정밀 커버리지는 현재 5,300만 대의 차량을 지원하고 있으며, 2023년 대비 40% 증가했습니다. OEM 제조업체가 턴키 방식의 고정밀 데이터에 의존하고 있음을 보여줍니다. TomTom의 Orbis Maps 3D는 8,600만km의 도로를 커버하고 차선 기반 내비게이션과 전기자동차 충전 레이어를 통합하고 있습니다. 일본의 다이나믹맵 플랫폼은 2025년 정부의 지원을 받아 공항과 항구로 HD맵을 확대하여 레벨4 자율주행 트럭을 목표로 하고 있습니다. AI 기반 특징 추출은 업데이트 비용을 절감하고 지도 제작 주기를 단축하여 네트워크를 거의 실시간으로 업데이트할 수 있는 공급자에게 경쟁 우위를 가져다 줍니다.
커넥티드카 OTA 지도 업데이트 생태계 급성장 전망
커넥티드카는 지도를 정적 라이선스에서 지속적인 무선 서비스로 전환하고 있습니다. 하만의 스마트 델타 기술은 지도 업데이트 파일을 최대 97%까지 압축하여 소프트웨어 정의 차량의 안전성을 유지하면서 데이터 전송 비용을 절감합니다. 전 세계 자동차 제조사 10곳 중 9곳이 EU 일반 안전 규제에 대응하기 위해 HERE의 지능형 속도 보조 맵을 도입하여 전 차량 대상 업데이트를 위한 표준화된 OTA 경로를 구축하고 있습니다. 메르세데스-벤츠는 2025년 1월 OTA 출시를 통해 전기 지능과 오프로드 추적 기능을 통합하고, 지도 데이터가 판매 후 기능 수익화를 가능하게 하는 사례를 보여주었습니다.
지속적인 센티미터 단위의 지도 업데이트 비용 증가
도시 지역의 건설 공사와 교통 상황의 변화가 심화되는 가운데, 차선 수준의 업데이트 요구사항은 막대한 운영 비용을 초래하고 있습니다. 톰톰은 현재 위성 데이터, LiDAR, 차량용 카메라 등 멀티센서 데이터를 융합하여 특징 추출의 자동화와 측량 주기 단축을 실현하고 있습니다. GetNexar의 AI 비전 기술은 대시 카메라 영상의 크라우드 소싱을 통해 지도 제작 비용을 절감할 수 있지만, 중소 업체에게는 여전히 자본금 요구가 큰 부담으로 작용하고 있습니다. 비용 압박으로 인해 지도 정확도를 희생하지 않고 업데이트 빈도를 유지하기 위해 제휴 및 선택적 외주화가 진행되고 있습니다.
부문 분석
소프트웨어 솔루션은 2025년 디지털 지도 시장의 60.85%를 차지할 것으로 예상되며, 이는 부서 간 공간 분석을 통합하는 구성 가능한 API 기반 플랫폼에 대한 기업의 수요를 반영합니다. 풍부한 기능의 SDK를 통해 개발자는 이동, 물류, 소매 애플리케이션에 지도, 경로 안내, 지오코딩 기능을 통합할 수 있습니다. 서비스 매출은 13.28%의 CAGR로 성장하고 있으며, 이는 조직이 레거시 GIS를 클라우드 환경으로 전환하고 관리형 통합, 데이터 품질 조정, 사용자 지원 프로그램을 요구하는 복잡성 증가를 반영하고 있습니다. 현대 플랫폼 내 AI 모듈은 선로 마크 감지, 표지판 인식, 자산 상태 평가를 자동화하여 업무 효율성을 높입니다.
전문 서비스에 대한 수요 증가는 위치 데이터 파이프라인에 대한 전문 감사를 의무화하는 컴플라이언스 요건도 반영하고 있습니다. 문서화 도구, 동의 관리 도구, 지오펜싱 정책 엔진이 도입 프로젝트에 통합되어 국경을 넘어 합법적인 배포를 보장합니다. 기업 데이터의 양이 증가함에 따라 벤더가 운영하는 매니지드 서비스가 데이터 수집, 정규화, 준실시간 스트리밍을 처리하는 사례가 증가하면서 일시적인 라이선스 비용을 넘어 지속적인 수익을 확보하고 있습니다.
클라우드 배포는 2025년 디지털 지도 시장 규모의 65.10%를 차지할 것으로 예상되며, 2031년까지 CAGR 15.55%로 확대될 것으로 전망됩니다. 탄력적인 컴퓨팅과 스토리지를 통해 매일 수십억 건의 경로 요청에 대해 1초 미만의 쿼리 성능을 제공합니다. 자동 스케일링 기능은 악천후나 휴가철에 트래픽이 급증할 때에도 대응할 수 있습니다. 엣지 수집 노드는 최신 프로브 데이터를 중앙 저장소로 전송하여 배차 서비스, 물류, 긴급 대응에 있어 지도 데이터의 신선도를 보장합니다.
온프레미스 도입은 국방, 항공, 엄격한 규제가 부과되는 금융 분야에서 지속되고 있지만, 소버린 클라우드 지역, 전용 호스트 옵션, 기밀 컴퓨팅 인클로저의 보급으로 보안 우려가 완화되면서 감소 추세에 있습니다. 비용 모델은 설비투자(CapEx)에서 종량제 운영비(OpEx)로 전환하여 AI 실험과 크로스 도메인 데이터 융합을 위한 자본을 확보할 수 있게 되었습니다. 기업들은 매핑을 GIS 기능 자체로서가 아니라 보다 광범위한 데이터 플랫폼 전략 내에서 소비되는 마이크로서비스로 인식하는 경향이 증가하고 있습니다.
디지털 지도 시장은 솔루션별(소프트웨어, 서비스), 도입 형태별(온프레미스, 클라우드), 지도 유형별(내비게이션 지도, 고정밀/실시간 지도, 지형도/테마 지도), 최종사용자 산업별(자동차, 엔지니어링/건설, 통신 등), 지역별로 세분화되어 있습니다. 시장 예측은 금액 기준(USD)으로 제공됩니다.
지역별 분석
북미는 2025년 디지털 지도 시장 점유율의 29.10%를 차지할 것으로 예상되며, 소프트웨어 정의 차량, 클라우드 GIS, 국방 지형공간 프로그램의 조기 도입이 그 기반이 될 것입니다. 연방 정부 기관은 개방형 공간 프레임워크를 추진하고, 자동차 제조업체는 자동화를 위한 심도 있는 연구 파이프라인을 유지하고 있습니다. 대규모 인프라 프로젝트에서는 건설 주기 단축과 자산 수명주기 가시성 향상을 위해 디지털 지형 모델(DTM)과 GNSS 기계 제어 기술이 채택되고 있습니다. 차량 텔레매틱스 제공업체와 같은 데이터 수익화 선도 기업들은 지역 지도의 정확성을 유지하는 데 필수적인 익명화된 프로브 데이터를 지속적으로 제공하고 있습니다.
아시아태평양은 2031년까지 CAGR 15.22%로 가장 높은 수준을 유지할 것이며, 5G 가입자 증가, 스마트 모빌리티 펀드, 정부 주도의 디지털 트윈 의무화 등이 견인할 것으로 보입니다. 일본 업계는 트럭 대열 주행 및 도심 로보택시 실증을 위해 고정밀 도로 데이터를 축적하여 고정밀 매핑 수요를 가속화하고 있습니다. 중국의 클라우드 제공업체는 EC 물류를 지원하는 대용량 위치정보 API를 제공하고, 인도의 5G 네트워크는 유틸리티 및 농업 분야의 GIS 현대화를 촉진하고 있습니다. 지역 하이퍼스케일 데이터센터에 대한 투자는 데이터 주권 규제 대응에도 기여하며, 세계 벤더가 국내 엔드포인트를 통해 현지 고객에게 서비스를 제공할 수 있도록 합니다.
기타 특전:
- 엑셀 형식의 시장 예측(ME) 시트
- 애널리스트 지원(3개월)
자주 묻는 질문
목차
제1장 소개
제2장 조사 방법
제3장 주요 요약
제4장 시장 구도
제5장 시장 규모와 성장 예측
제6장 경쟁 구도
제7장 시장 기회와 향후 전망
KSM 26.03.09The digital map market size in 2026 is estimated at USD 32.8 billion, growing from 2025 value of USD 28.97 billion with 2031 projections showing USD 60.96 billion, growing at 13.21% CAGR over 2026-2031.

Growth stems from the transition toward AI-powered, cloud-native platforms that support autonomous vehicles, smart-city digital twins, and real-time geographic information systems. Regulatory mandates such as EU eCall and emerging corporate Scope 3 carbon-mapping rules broaden adoption beyond conventional navigation.
Global Digital Map Market Trends and Insights
Rapid Uptake of HD Maps for ADAS and Autonomous Vehicles
BMW launched Germany's first Level 3 system in 2024 using HERE HD Live Map that delivers lane-level accuracy within 17 cm for localization, path planning, and operational-design-domain validation. HERE's high-precision coverage now supports 53 million vehicles, a 40% rise over 2023, indicating OEM reliance on turnkey HD data. TomTom's Orbis Maps 3D spans 86 million km of roads and integrates lane-based navigation with electric-vehicle charging layers. Japan's Dynamic Map Platform received government backing in 2025 to expand HD maps to airports and ports, targeting Level 4 autonomous trucks. AI-based feature extraction lowers refresh costs and shortens map-creation cycles, delivering competitive advantage to providers able to update networks in near-real time.
Explosive Growth of Connected-Car OTA Map-Update Ecosystems
Connected vehicles are shifting maps from static licenses to recurring over-the-air services. HARMAN's Smart Delta technology compresses map-update files by up to 97%, cutting data-transfer costs while maintaining software-defined-vehicle safety integrity. Nine of ten global OEMs deploy HERE's Intelligent Speed Assistance Map to address EU General Safety Regulation compliance, creating standardized OTA pathways for fleet-wide updates. Mercedes-Benz integrated electric-intelligence and off-road tracking features via its January 2025 OTA release, illustrating how map data enables post-sale feature monetization.
Escalating Costs of Continuous, Centimeter-Level Map Refresh
Lane-level refresh requirements drive substantial operational costs as construction and traffic changes intensify in urban zones. TomTom now fuses multi-sensor data-satellite, LiDAR, onboard cameras-to automate feature extraction and cut survey cycles. GetNexar's AI vision reduces cartography expense by crowd-sourcing dash-cam imagery, yet capital requirements remain onerous for smaller vendors. Cost pressures encourage alliances and selective outsourcing to maintain update cadence without sacrificing map accuracy.
Other drivers and restraints analyzed in the detailed report include:
- Mainstream Adoption of Cloud-Native GIS Platforms
- Smart-City Digital-Twin Programs Scaling Globally
- Heightened Data-Privacy and Localization Statutes (GDPR, PIPL)
For complete list of drivers and restraints, kindly check the Table Of Contents.
Segment Analysis
Software solutions captured 60.85% of the digital map market in 2025, reflecting enterprise demand for configurable, API-driven platforms that consolidate spatial analytics across departments. Feature-rich SDKs allow developers to embed maps, routing, and geocoding into mobility, logistics, and retail applications. Services revenue, growing at 13.28% CAGR, mirrors rising complexity as organizations migrate legacy GIS to cloud environments and seek managed integration, data-quality tuning, and user-enablement programs. AI modules within modern platforms automate line-mark detection, sign recognition, and asset-condition scoring, catalyzing operational efficiencies.
Professional-services uptake also reflects compliance mandates that require expert audits of location-data pipelines. Documentation, consent-management tools, and geo-fencing policy engines are bundled into implementation projects to ensure lawful deployment across borders. As enterprise data volumes scale, vendor-operated managed services increasingly handle ingestion, normalization, and near-real-time streaming, locking in recurring revenue beyond one-time license fees.
Cloud deployment held 65.10% share of the digital map market size in 2025 and is forecast to expand at 15.55% CAGR through 2031. Elastic compute and storage enable sub-second query performance for billions of daily route requests while auto-scaling manages traffic peaks during severe-weather or holiday seasons. Edge ingestion nodes push fresh probe data into centralized repositories, ensuring map freshness for ride-hailing, logistics, and emergency response.
On-premise installations persist in defense, aviation, and highly regulated finance but trend downward as sovereign-cloud regions, dedicated host options, and confidential-computing enclaves mitigate security objections. Cost models shift from capex to pay-as-you-go opex, freeing capital for AI experimentation and cross-domain data fusion. Enterprises increasingly view mapping as a micro-service consumed within broader data-platform strategies rather than a standalone GIS function.
Digital Map Market is Segmented by Solution (Software, Services), Deployment (On-Premise, Cloud), Map Type (Navigation Maps, HD and Real-Time Maps, Topographic and Thematic Maps), End User Industry (Automotive, Engineering and Construction, Telecommunications and More), and by Geography. The Market Forecasts are Provided in Terms of Value (USD).
Geography Analysis
North America accounted for 29.10% digital map market share in 2025, anchored by early adoption of software-defined vehicles, cloud GIS, and defense geospatial programs. Federal agencies promote open spatial frameworks, and automotive OEMs maintain deep research pipelines for automation. Large-scale infrastructure projects employ digital terrain models and GNSS machine-control to shorten build cycles and enhance asset lifecycle visibility. Data-monetization champions such as fleet telematics providers continuously feed anonymized probe data that sustain regional map accuracy.
Asia-Pacific delivers the highest 15.22% CAGR through 2031, powered by 5G subscriber growth, smart-mobility funding, and government-backed digital-twin mandates. Japan's industry collects HD corridor data for truck platooning and metropolitan robo-taxi pilots, accelerating HD mapping demand. China's cloud providers expose high-volume location APIs to power e-commerce logistics, while India's 5G networks stimulate GIS modernization across utilities and agriculture. Investments in regional hyperscale data centers also address data-sovereignty rules, enabling global vendors to serve local customers via in-country endpoints.
- Alphabet (Google Maps, Waze)
- HERE Technologies
- TomTom International B.V.
- Esri
- Mapbox
- Apple Inc. (Apple Maps)
- Maxar Technologies (DigitalGlobe)
- Collins Bartholomew
- Digital Map Products
- Digital Mapping Solutions
- DMTI Spatial
- Lepton Software
- ThinkGeo
- MapData Services
- NavInfo Co. Ltd.
- AutoNavi (Gaode, Alibaba)
- Baidu Maps
- Nearmap Ltd
- Zenrin Co. Ltd.
- Trimble Inc.
- CARTO
- OpenStreetMap Foundation
- MapQuest (Verizon)
Additional Benefits:
- The market estimate (ME) sheet in Excel format
- 3 months of analyst support
TABLE OF CONTENTS
1 INTRODUCTION
- 1.1 Study Assumptions and Market Definition
- 1.2 Scope of the Study
2 RESEARCH METHODOLOGY
3 EXECUTIVE SUMMARY
4 MARKET LANDSCAPE
- 4.1 Market Overview
- 4.2 Market Drivers
- 4.2.1 Rapid uptake of HD maps for ADAS and autonomous vehicles
- 4.2.2 Explosive growth of connected-car OTA map-update ecosystems
- 4.2.3 Mainstream adoption of cloud-native GIS platforms
- 4.2.4 Smart-city digital-twin programs scaling globally
- 4.2.5 Mandatory EU eCall and next-gen road-safety regulations
- 4.2.6 Corporate Scope-3 carbon mapping requirements
- 4.3 Market Restraints
- 4.3.1 Escalating costs of continuous, centimetre-level map refresh
- 4.3.2 Heightened data-privacy and localization statutes (GDPR, PIPL)
- 4.3.3 IP-licensing disputes among data providers and OEMs
- 4.3.4 Algorithmic bias and liability concerns in AI-generated maps
- 4.4 Value / Supply-Chain Analysis
- 4.5 Regulatory Landscape
- 4.6 Technological Outlook
- 4.7 Porter's Five Forces
- 4.7.1 Threat of New Entrants
- 4.7.2 Bargaining Power of Buyers
- 4.7.3 Bargaining Power of Suppliers
- 4.7.4 Threat of Substitutes
- 4.7.5 Intensity of Competitive Rivalry
5 MARKET SIZE AND GROWTH FORECASTS (VALUE)
- 5.1 By Solution
- 5.1.1 Software
- 5.1.2 Services
- 5.2 By Deployment
- 5.2.1 On-Premise
- 5.2.2 Cloud
- 5.3 By Map Type
- 5.3.1 Navigation Maps
- 5.3.2 HD and Real-time Maps
- 5.3.3 Topographic and Thematic Maps
- 5.4 By End-use Industry
- 5.4.1 Automotive
- 5.4.2 Engineering and Construction
- 5.4.3 Telecommunications
- 5.4.4 Public Sector and Defense
- 5.4.5 Retail and Geomarketing
- 5.4.6 Other End User
- 5.5 By Geography
- 5.5.1 North America
- 5.5.1.1 United States
- 5.5.1.2 Canada
- 5.5.1.3 Mexico
- 5.5.2 South America
- 5.5.2.1 Brazil
- 5.5.2.2 Argentina
- 5.5.2.3 Rest of South America
- 5.5.3 Europe
- 5.5.3.1 Germany
- 5.5.3.2 United Kingdom
- 5.5.3.3 France
- 5.5.3.4 Netherlands
- 5.5.3.5 Rest of Europe
- 5.5.4 Asia-Pacific
- 5.5.4.1 China
- 5.5.4.2 Japan
- 5.5.4.3 India
- 5.5.4.4 South Korea
- 5.5.4.5 Australia and New Zealand
- 5.5.4.6 Rest of Asia-Pacific
- 5.5.5 Middle East and Africa
- 5.5.5.1 Middle East
- 5.5.5.1.1 United Arab Emirates
- 5.5.5.1.2 Saudi Arabia
- 5.5.5.1.3 Turkey
- 5.5.5.1.4 Rest of Middle East
- 5.5.5.2 Africa
- 5.5.5.2.1 South Africa
- 5.5.5.2.2 Nigeria
- 5.5.5.2.3 Rest of Africa
- 5.5.5.1 Middle East
- 5.5.1 North America
6 COMPETITIVE LANDSCAPE
- 6.1 Market Concentration
- 6.2 Strategic Moves
- 6.3 Market Share Analysis
- 6.4 Company Profiles (includes Global level Overview, Market level overview, Core Segments, Financials as available, Strategic Information, Market Rank/Share for key companies, Products and Services, and Recent Developments)
- 6.4.1 Alphabet (Google Maps, Waze)
- 6.4.2 HERE Technologies
- 6.4.3 TomTom International B.V.
- 6.4.4 Esri
- 6.4.5 Mapbox
- 6.4.6 Apple Inc. (Apple Maps)
- 6.4.7 Maxar Technologies (DigitalGlobe)
- 6.4.8 Collins Bartholomew
- 6.4.9 Digital Map Products
- 6.4.10 Digital Mapping Solutions
- 6.4.11 DMTI Spatial
- 6.4.12 Lepton Software
- 6.4.13 ThinkGeo
- 6.4.14 MapData Services
- 6.4.15 NavInfo Co. Ltd.
- 6.4.16 AutoNavi (Gaode, Alibaba)
- 6.4.17 Baidu Maps
- 6.4.18 Nearmap Ltd
- 6.4.19 Zenrin Co. Ltd.
- 6.4.20 Trimble Inc.
- 6.4.21 CARTO
- 6.4.22 OpenStreetMap Foundation
- 6.4.23 MapQuest (Verizon)
7 MARKET OPPORTUNITIES AND FUTURE OUTLOOK
- 7.1 White-space and Unmet-need Assessment
