
|
시장보고서
상품코드
1940611
PD-1 및 PD-L1 억제제 : 시장 점유율 분석, 업계 동향과 통계, 성장 예측(2026-2031년)PD-1 And PD-L1 Inhibitors - Market Share Analysis, Industry Trends & Statistics, Growth Forecasts (2026 - 2031) |
||||||
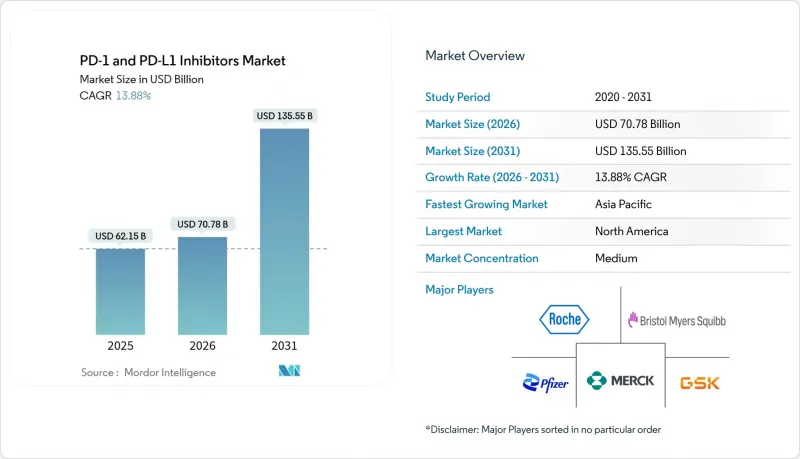
PD-1 및 PD-L1 억제제 시장 규모는 2026년에는 707억 8,000만 달러로 추정되고 있습니다.
이는 2025년 621억 5,000만 달러에서 성장한 수치이며, 2031년에는 1,355억 5,000만 달러에 달할 것으로 예측됩니다. 2026-2031년 연평균 성장률(CAGR)은 13.88%를 나타낼 것으로 예측됩니다.

이러한 성장은 신속한 규제 당국의 승인, 적응증 확대에 대한 끊임없는 투자, 그리고 종양 유형 전반에 걸쳐 면역 체크포인트의 유용성을 확대하는 이중 특이성 구조의 출현에 힘입어 성장하고 있습니다. 2024년 12월 FDA의 피하주사 니볼루맙 승인으로 특허 만료 이후에도 수익원을 보호할 수 있는 새로운 투여 형태가 입증되었습니다. 특히 PD-1/VEGF와 PD-1/CTLA-4 병용요법은 무진행생존기간의 유의미한 연장 효과를 지속적으로 보여줌으로써 처방의사의 신뢰를 강화하는 동시에 높은 가격 설정의 근거를 뒷받침하고 있습니다. 미국과 유럽의 대규모 지불자 시스템은 여전히 높은 인수 비용을 흡수하고 있지만, 중국의 수량 기준 조달 모델은 가격 하락 압력을 발생시켜 다국적 기업이 신흥 경제권에서 출시 전략을 재검토하도록 강요하고 있습니다. 디지털 약국, 원격 종양학 채널, 그리고 새로 진입한 저분자 경구용 약물은 환자 접근성을 확대하고 전통적인 주입 센터 경제를 재구성하여 PD-1 및 PD-L1 억제제 시장에 더 많은 성장 벡터를 창출하고 있습니다.
세계 PD-1 및 PD-L1 억제제 시장 동향과 인사이트
블록버스터 제품의 적응증 확대를 위한 폭발적인 연구개발비 증가
제약사들은 승인된 PD-1/PD-L1 약물의 새로운 적응증 개척을 위한 시판 후 조사에 사상 최대 규모의 자금을 투입하고 있습니다. 머크는 펨브롤리주맙에 대한 1,600개 이상의 임상시험을 진행 중이며, 이를 통해 펨브롤리주맙은 유리한 상환 상태를 유지하면서 추가적인 환자 코호트를 확보할 수 있게 되었습니다. 2024년 6월 FDA가 원발성 진행성 자궁내막암 1차 치료제로 승인하면서 무진행생존기간 중앙값이 6.5개월에서 11.1개월로 연장되어 임상적 가치가 강화되고 제품 수명주기이 연장되었습니다. 유럽 당국도 이에 호응하여 2024년 11월 악성 흉막중피종에 대한 긍정적인 견해를 밝혔습니다. 이는 세계 각국의 규제 당국이 기존 안전성 데이터를 활용하여 심사 기간을 단축하는 경향을 보이고 있음을 보여줍니다. 지속적인 적응증 확대는 바이오시밀러로의 전환을 늦추고, 프리미엄 가격을 유지하며, PD-1/PD-L1 억제제 시장의 성장 궤도를 더욱 가속화할 것입니다.
미국 FDA 및 중국 NMPA의 신속한 실시간 종양학 심사 지원
규제 당국은 현재 개발 기간 단축을 위한 단계적 신청, 대체 엔드포인트 승인, 실시간 자문회의를 허용하고 있습니다. 2024년 12월 FDA의 피하주사 니볼루맙 승인은 신청에서 승인까지 10개월 이내에 이뤄져 당국의 민첩성이 향상되었음을 보여줍니다. 중국 NMPA도 비슷한 속도로 2024년 48개의 퍼스트 인 클래스 암 치료제를 승인했으며, 체크포인트 억제제가 가장 큰 단일 치료 카테고리를 차지했습니다. 비소세포폐암 3상 임상에서 우수한 데이터를 보여준 이보네시맙의 조건부 승인은 우선 심사 인센티브가 경쟁의 타임라인을 재설정하는 현실을 보여줍니다. 가속화된 사이클은 투자 회수 기간을 단축하고, 위험 조정 후 순현재 가치를 향상시키며, PD-1 및 PD-L1 억제제 시장으로의 자본 유입을 강화합니다.
임상 3상 주요 병용 임상에서 자본 지출 증가
적응형 다군 임상시험은 대상자 확대, 추적 기간 연장, 복잡한 바이오마커 패널이 요구되며, 환자 1인당 지출은 최대 6만 1,907달러에 달할 전망입니다. 100개 이상의 펨브롤리주맙 병용 임상을 병행하는 스폰서 기업들은 우량 기업의 현금 흐름까지 위협하는 누적된 예산에 직면해 있습니다. 중소 바이오기업은 자금 조달에 어려움을 겪고 있으며, 파이프라인의 다양화가 둔화되고 있습니다. 이러한 경제적 요인으로 인해 예측 CAGR은 1.4% 하락할 것으로 예상되나, 시장 전체의 성장세는 반전되지 않을 것으로 보입니다.
부문 분석
PD-1 억제제는 2025년 매출의 80.92%를 차지할 것으로 예상되며, PD-1 및 PD-L1 억제제 시장 규모는 502억 9,000만 달러에 달할 전망입니다. 흑색종, 폐암, 방광암, 두경부암에서 우수한 생존율 데이터를 보유하고 있습니다. 종합적인 안전성 데이터, 가이드라인의 정착, 임상의의 숙련도, 종양학 센터 전반의 처방 관성을 강화하고 있습니다. 대규모 임상시험 투자를 통해 1차 치료제로서의 지위를 확보했으며, 새로운 종양 유형으로의 확장을 통해 두 자릿수 성장을 지속하고 있습니다.
개발업체들이 경구제, 헤테로이합체, 고분자 모방체 등의 기술 혁신을 추진하는 가운데, 성장 모멘텀은 PD-L1 분자로 옮겨가고 있습니다. in vitro 연구에서 iBodies는 PD-L1 차단 효과를 유지하면서 열 안정성을 향상시켜 콜드체인 비용 절감을 기대할 수 있는 것으로 나타났습니다. ABSK043 및 후속 경구제는 진료 시간 단축, 환자 편의성 향상, 소매 약국 및 온라인 약국을 통한 유통을 가능하게 할 수 있습니다. 이러한 장점은 PD-L1 억제제의 예측 CAGR 19.85%를 뒷받침하며, PD-1 & PD-L1 억제제 시장에서 PD-1의 우위를 점진적으로 축소시키지만 뒤집지는 않을 것입니다.
지역별 분석
북미는 혁신 기술의 빠른 도입, 광범위한 민간 보험 적용 범위, FDA의 세계 벤치마킹 역할을 바탕으로 2025년 세계 매출의 46.90%를 차지할 것으로 예측됩니다. 페토스템타맙과 펨브롤리주맙과 같은 새로운 병용요법에 대한 혁신치료제 지정은 임상 도입까지의 시간을 단축하고, 치료 기준의 향상을 촉진할 수 있습니다. 2026년부터 시작되는 인플레이션 억제법 가격 협상을 포함한 법규 변화는 향후 수익률에 불확실성을 가져다 주지만, 미충족 수요가 높기 때문에 단기적으로 도입을 저해할 가능성은 낮다고 판단됩니다.
유럽 시장은 성숙하면서도 가격 민감도가 높은 특성을 가지고 있습니다. 2025년 시행되는 유럽의약품청(EMA) 공동임상평가 규정에 따라 근거기준이 통일되어 국경을 초월한 신속한 도입이 기대되지만, 의료기술평가기관(HTA)의 비용효과성 검증은 계속될 것입니다. 보조요법용 펨브롤리주맙에 대한 상업적 접근 계약은 NICE의 기준을 충족하기 위해 제조업체가 할인 제도를 적용하는 사례를 보여줍니다. 중국산 트리팔리맙과 티쎌리주맙의 EMA 승인으로 경쟁은 더욱 치열해졌으며, 지역 내 체크포인트 억제제의 다양화 추세가 더욱 가속화될 것으로 보입니다.
아시아태평양은 15.83%의 연평균 복합 성장률(CAGR)로 가장 빠르게 성장하는 시장입니다. 중국은 NMPA 개혁으로 2024년 228개의 신약(대부분 PD-1/PD-L1 경로 관련)을 승인하여 판매량을 견인할 것으로 예측됩니다. 국내 대기업들은 가격 양보를 활용해 대규모 입찰을 성사시키며 아세안 시장 진출 기반을 다지고 있습니다. 일본에서는 고령화에 따른 암 발생률 상승으로 안정적인 성장을 지속하고 있으며, 호주에서는 국민건강보험을 통한 조기 도입이 추진되고 있습니다. 이 지역 전체가 판매량 확대와 혁신적인 파이프라인의 기여라는 두 가지 측면을 모두 실현하여 PD-1 및 PD-L1 억제제 시장의 세계 모멘텀을 강화하고 있습니다.
기타 특전:
- 엑셀 형식 시장 예측(ME) 시트
- 애널리스트의 3개월간 지원
자주 묻는 질문
목차
제1장 서론
제2장 조사 방법
제3장 주요 요약
제4장 시장 구도
제5장 시장 규모와 성장 예측
제6장 경쟁 구도
제7장 시장 기회와 향후 전망
LSH 26.03.10PD-1 & PD-L1 inhibitors market size in 2026 is estimated at USD 70.78 billion, growing from 2025 value of USD 62.15 billion with 2031 projections showing USD 135.55 billion, growing at 13.88% CAGR over 2026-2031.
Growth rests on rapid regulatory approvals, unrelenting label-expansion spending and the arrival of bispecific constructs that extend immune-checkpoint utility across tumor types. The December 2024 FDA clearance of subcutaneous nivolumab validated novel delivery formats that can protect revenue streams after patent expiry. Combination strategies-particularly PD-1/VEGF and PD-1/CTLA-4 pairings-continue to post meaningful progression-free-survival gains, reinforcing prescriber confidence and underpinning premium pricing. Large payor systems in the United States and Europe still absorb high acquisition costs, yet China's volume-based procurement model exerts downward pricing pressure and forces multinationals to re-examine launch tactics in emerging economies. Digital pharmacies, tele-oncology channels and small-molecule oral entrants broaden patient access and reshape traditional infusion-center economics, creating additional growth vectors for the PD-1 & PD-L1 inhibitors market.
Global PD-1 And PD-L1 Inhibitors Market Trends and Insights
Explosive R&D spend on new-label expansion for blockbuster assets
Drug makers funnel record capital into post-marketing studies aimed at unlocking fresh indications for approved PD-1/PD-L1 agents. Merck alone sponsors more than 1,600 active trials with pembrolizumab, allowing the molecule to secure additional patient cohorts while maintaining favorable reimbursement status. FDA clearance in June 2024 for first-line therapy in primary advanced endometrial carcinoma lifted median progression-free survival from 6.5 to 11.1 months, reinforcing clinical value and elongating product lifecycles. European authorities echoed this momentum with a positive opinion for malignant pleural mesothelioma in November 2024, showing how global regulators lean on existing safety dossiers to shorten review times. Continuous label expansion defers biosimilar substitution, sustains premium pricing and amplifies the growth trajectory of the PD-1 & PD-L1 inhibitors market.
Faster U.S. FDA & NMPA real-time oncology reviews
Regulators now grant rolling submissions, surrogate-endpoint acceptances and real-time advisory meetings that compress development timelines. The December 2024 FDA nod for subcutaneous nivolumab moved from filing to approval inside ten months, underscoring rising agency agility. China's NMPA matched that speed by clearing 48 first-in-class cancer drugs during 2024, with checkpoint inhibitors representing the largest single therapeutic category. Conditional approvals awarded to ivonescimab after superior phase 3 data in non-small cell lung cancer underscore how priority review incentives reset competitive clocks. Accelerated cycles shorten payback windows, improve risk-adjusted net present value and strengthen capital inflows into the PD-1 & PD-L1 inhibitors market.
Escalating CAPEX in pivotal phase-III combination studies
Adaptive multi-arm trials demand expanded cohorts, extended follow-up and complex biomarker panels, driving per-patient outlays as high as USD 61,907. Sponsors running more than 100 concurrent pembrolizumab studies face cumulative budgets that challenge even blue-chip cash flows. Smaller biotech players encounter financing headwinds, slowing pipeline diversity. These economics shave 1.4 percentage points from forecast CAGR yet do not reverse overall market momentum.
Other drivers and restraints analyzed in the detailed report include:
- China's volume-based procurement favouring domestic PD-(L)1 makers
- Rise of bispecific / tri-specific antibodies entering late-phase trials
- Pending 2028 U.S. patent cliffs for Keytruda & Opdivo
For complete list of drivers and restraints, kindly check the Table Of Contents.
Segment Analysis
PD-1 inhibitors held 80.92% of 2025 revenue, equivalent to a USD 50.29 billion PD-1 & PD-L1 inhibitors market size. Their dominance stems from robust survival data across melanoma, lung, bladder and head-and-neck cancers. Comprehensive safety experience, guideline entrenchment and clinician familiarity reinforce prescribing inertia across oncology centers. Heavy trial investment secures ongoing first-line positioning and sustains double-digit expansion through new tumor types.
Growth momentum shifts toward PD-L1 molecules as developers exploit oral, heterodimeric and polymer-mimetic engineering. In vitro studies show iBodies maintain PD-L1 blockade potency while enhancing thermostability, foreshadowing lower cold-chain costs. ABSK043 and follow-on oral assets may shorten chair time, increase patient convenience and open distribution through retail and online pharmacies. These advantages underpin the 19.85% forecast CAGR for PD-L1 agents, gradually narrowing but not overturning PD-1 supremacy within the PD-1 & PD-L1 inhibitors market.
The PD-1 and PD-L1 Inhibitors Market Report is Segmented by Type of Inhibitors (PD-1 Inhibitors and PD-L1 Inhibitors), Application (Hodgkins Lymphoma, Kidney Cancer, Melanoma, Non-Small Cell Lung Cancer, and More), Distribution Channel (Hospital Pharmacies, Retail Pharmacies, and Online Pharmacies), and Geography (North America, Europe, Asia-Pacific, and More). The Market Forecasts are Provided in Terms of Value (USD).
Geography Analysis
North America contributed 46.90% of worldwide revenue in 2025 on the back of rapid innovation uptake, broad private insurance coverage and the FDA's global benchmarking role. Breakthrough designations for novel combinations such as petosemtamab plus pembrolizumab accelerate time to clinic and keep therapy standards shifting upward. Legislative shifts including Inflation Reduction Act price negotiations starting 2026 bring uncertainty to out-year margins but are unlikely to dampen near-term adoption given high unmet oncologic need.
Europe follows with mature yet price-sensitive dynamics. The EMA's joint-clinical-assessment rules effective 2025 harmonize evidence criteria, promising quicker cross-border availability although HTA agencies still scrutinize cost efficiency. Commercial access agreements for pembrolizumab in adjuvant NSCLC illustrate how manufacturers adapt discount schemes to satisfy NICE thresholds. Recent EMA approvals for Chinese-origin toripalimab and tislelizumab add competitive spice and demonstrate willingness to diversify the regional checkpoint arsenal.
Asia-Pacific is the fastest-growing contributor at 15.83% CAGR. China spearheads volume through NMPA reforms that cleared 228 new drugs in 2024, many involving PD-1/PD-L1 pathways. Domestic champions leverage price concessions to cement large-scale tenders and then springboard into ASEAN markets. Japan sustains stable growth as aging demographics drive cancer incidence, while Australia funds early adoption via national health insurance. Collectively, the region delivers both volume expansion and innovative pipeline contributions, reinforcing global momentum of the PD-1 & PD-L1 inhibitors market.
- Merck
- Bristol-Myers Squibb
- Roche
- AstraZeneca
- Sanofi
- Pfizer
- Regeneron Pharma Inc.
- GlaxoSmithKline
- Amgen
- Eli Lilly and Company
- Novartis
- BeiGene Ltd.
- Innovent Biologics
- Hengrui Medicine
- Akeso Inc.
- Henlius Biotech
- Seagen
- Shanghai Junshi Biosciences
- Arcus Biosciences
- Leap Therapeutics
Additional Benefits:
- The market estimate (ME) sheet in Excel format
- 3 months of analyst support
TABLE OF CONTENTS
1 Introduction
- 1.1 Study Assumptions & Market Definition
- 1.2 Scope of the Study
2 Research Methodology
3 Executive Summary
4 Market Landscape
- 4.1 Market Overview
- 4.2 Market Drivers
- 4.2.1 Explosive R&D Spend On New-Label Expansion For Blockbuster Assets
- 4.2.2 Faster U.S. FDA & NMPA Real-Time Oncology Reviews
- 4.2.3 China's Volume-Based Procurement Favouring Domestic PD-(L)1 Makers
- 4.2.4 Rise Of Bispecific / Tri-Specific Antibodies Entering Late-Phase Trials
- 4.2.5 AI-Enabled Biomarker Discovery Improving Responder Rates
- 4.2.6 Point-Of-Care Companion-Diagnostic Advances Lowering Trial Attrition
- 4.3 Market Restraints
- 4.3.1 Escalating CAPEX In Pivotal Phase-III Combination Studies
- 4.3.2 Pending 2028 U.S. Patent Cliffs For Keytruda & Opdivo
- 4.3.3 Uneven Global Reimbursement; HTA Push-Back On Cost-To-Benefit
- 4.3.4 Emergent Small-Molecule PD-(L)1 Oral Entrants Cannibalising Mab Share
- 4.4 Porter's Five Forces
- 4.4.1 Bargaining Power of Suppliers
- 4.4.2 Bargaining Power of Buyers
- 4.4.3 Threat of New Entrants
- 4.4.4 Threat of Substitutes
- 4.4.5 Intensity of Competitive Rivalry
5 Market Size & Growth Forecasts (Value, USD)
- 5.1 By Type of Inhibitors
- 5.1.1 PD-1 Inhibitors
- 5.1.2 PD-L1 Inhibitors
- 5.2 By Application
- 5.2.1 Non-Small Cell Lung Cancer
- 5.2.2 Melanoma
- 5.2.3 Kidney Cancer
- 5.2.4 Hodgkin Lymphoma
- 5.2.5 Other Cancers
- 5.3 By Distribution Channel
- 5.3.1 Hospital Pharmacies
- 5.3.2 Retail Pharmacies
- 5.3.3 Online Pharmacies
- 5.4 Geography
- 5.4.1 North America
- 5.4.1.1 United States
- 5.4.1.2 Canada
- 5.4.1.3 Mexico
- 5.4.2 Europe
- 5.4.2.1 Germany
- 5.4.2.2 United Kingdom
- 5.4.2.3 France
- 5.4.2.4 Italy
- 5.4.2.5 Spain
- 5.4.2.6 Rest of Europe
- 5.4.3 Asia-Pacific
- 5.4.3.1 China
- 5.4.3.2 Japan
- 5.4.3.3 India
- 5.4.3.4 South Korea
- 5.4.3.5 Australia
- 5.4.3.6 Rest of Asia-Pacific
- 5.4.4 Middle East and Africa
- 5.4.4.1 GCC
- 5.4.4.2 South Africa
- 5.4.4.3 Rest of Middle East and Africa
- 5.4.5 South America
- 5.4.5.1 Brazil
- 5.4.5.2 Argentina
- 5.4.5.3 Rest of South America
- 5.4.1 North America
6 Competitive Landscape
- 6.1 Market Concentration
- 6.2 Market Share Analysis
- 6.3 Company Profiles (includes Global level Overview, Market level overview, Core Segments, Financials as available, Strategic Information, Market Rank/Share for key companies, Products & Services, and Recent Developments)
- 6.3.1 Merck & Co.
- 6.3.2 Bristol-Myers Squibb
- 6.3.3 F. Hoffmann-La Roche AG
- 6.3.4 AstraZeneca PLC
- 6.3.5 Sanofi SA
- 6.3.6 Pfizer Inc.
- 6.3.7 Regeneron Pharma Inc.
- 6.3.8 GSK plc
- 6.3.9 Amgen Inc.
- 6.3.10 Eli Lilly and Co.
- 6.3.11 Novartis AG
- 6.3.12 BeiGene Ltd.
- 6.3.13 Innovent Biologics
- 6.3.14 Hengrui Medicine
- 6.3.15 Akeso Inc.
- 6.3.16 Henlius Biotech
- 6.3.17 Seagen Inc.
- 6.3.18 Shanghai Junshi Biosciences
- 6.3.19 Arcus Biosciences
- 6.3.20 Leap Therapeutics
7 Market Opportunities & Future Outlook
- 7.1 White-space & Unmet-Need Assessment
