


|
시장보고서
상품코드
1940628
러기드 디스플레이 : 시장 점유율 분석, 업계 동향과 통계, 성장 예측(2026-2031년)Rugged Display - Market Share Analysis, Industry Trends & Statistics, Growth Forecasts (2026 - 2031) |
||||||
러기드 디스플레이 시장은 2025년 108억 5,000만 달러에서 2026년에는 113억 2,000만 달러에 이르고, 2026-2031년 CAGR 4.36%로 성장을 지속하여 2031년까지 140억 1,000만 달러에 달할 것으로 예측됩니다.

이러한 확대는 국방, 산업 및 비상 대응 분야에서 미션 크리티컬한 업무의 디지털화를 반영하고 있으며, 이러한 환경에서 상업용 스크린은 충격, 진동 또는 극한의 온도를 견딜 수 없습니다. 증강현실(AR) 워크플로우의 도입 증가, 5G 지원 스마트 팩토리로의 업그레이드, 군사 현대화 프로그램, 태양광에서도 가시성, 본질 안전 방폭형, 열 관리형 패널의 적용 범위가 확대되고 있습니다. 태블릿 PC, 차량용 컴퓨터, 초강력 폼팩터로의 제품 구성 변화가 벤더들의 로드맵을 재구성하고 있습니다. 지리적 모멘텀은 제조업체들이 사설 5G 네트워크를 통합하는 아시아태평양에서 가장 강력하며, 북미는 국방 지출과 엄격한 산업 안전 규제로 인해 주도권을 유지하고 있습니다. 중국 중심의 LCD 생산을 둘러싼 공급망 리스크 증가와 OLED의 열적 제약은 역풍으로 작용하는 반면, 대체 소재 및 지역 조달에 대한 연구개발을 촉진하고 있습니다.
세계 러기드 디스플레이 시장 동향 및 인사이트
현장 서비스 용도의 AR 인터페이스 통합
RealWear Navigator 520과 같은 핸즈프리 지원 AR 헤드마운트 태블릿은 실시간 도면, 원격 교육 세션 및 장비 데이터를 작업자의 시야에 직접 스트리밍하여 첫 번째 수리 성공률을 향상시킵니다. 전 세계 AR 하드웨어 출하량은 2030년까지 연평균 복합 성장률(CAGR) 50.7%로 가속화될 것으로 예상되며, 충격 방지 및 음성 제어 기능을 갖추고 폭발성 대기 환경에서 사용하도록 인증된 디스플레이에 대한 수요를 견인할 것으로 보입니다. 각 업체들은 교대 근무 시간을 통한 배터리 수명 연장을 위해 저전력 칩셋과 효율적인 백라이트에 초점을 맞추었습니다. 이에 따라, 러기드 디스플레이 시장은 수동적인 시각화에서 디지털 오버레이와 실제 자산을 결합한 인터랙티브하고 센서가 풍부한 플랫폼으로 진화하고 있습니다. 방열 기술과 눈 안전 밝기 수준을 장악하고 있는 제조업체는 유틸리티, 석유 및 가스 설비 유지보수, 중장비 OEM 서비스 팀 등으로부터 중기적인 성장 기회를 얻을 수 있는 위치에 있습니다.
자율 주행 군용 차량 및 무인 시스템을 위한 러기드 디스플레이 채용
방위 기관은 콜린스 에어로스페이스의 AFD-3210과 같은 적응형 비행 디스플레이가 AI 기반 자율성이 성숙해짐에 따라 업그레이드할 수 있도록 모듈식 개방형 시스템 아키텍처를 규정하고 있습니다. 9,000시간의 MTBF를 갖춘 NVIS 지원 터치스크린은 야간 투시 및 낮은 시그니처 요구 사항을 충족하고, 밀폐형 하우징은 충격, 먼지, 전자기 간섭을 견딜 수 있습니다. 이러한 전환은 2028년 이후에도 계속되는 긴 조달 주기와 일치하지만, 유인 지상 차량에 옵션으로 탑재된 초기 프로토타입은 그 수요를 입증하고 있습니다. 러기드 디스플레이 시장은 실시간 센서 융합, 운동 목표 데이터, 예측 유지보수 알림을 하나의 패널에 통합한 멀티 도메인 명령 인터페이스의 혜택을 누리고 있습니다. 열 제약과 증가하는 탑재 프로세싱 부하의 균형을 맞출 수 있는 공급업체는 전략적 우위를 점하고 있습니다.
고온 환경에서의 국방 임무에서 OLED를 제한하는 열 관리 문제들
유기발광층은 85℃ 이상의 지속 온도에서 빠르게 열화되기 때문에 군에서는 차량 대시보드나 마스트 장착 조준기에 액정 디스플레이 기술을 채택하는 경향이 있습니다. 냉각판, 히트파이프, 전도성 냉각 인클로저는 무게와 전력 소비를 증가시켜 OLED의 이론적 효율을 상쇄합니다. 엔진 베이나 사막 환경에서는 125℃를 초과할 수 있기 때문에 러기드 디스플레이 시장의 벤더들은 내열성이 우수한 비정질 실리콘 LCD를 우선시하는 한편, 미래의 성능 기준을 충족시키면서 열적 취약성을 해소할 수 있는 무기 발광 재료의 연구개발에 자금을 투자하고 있습니다.
부문 분석
2025년 기준 태블릿 PC는 러기드 디스플레이 시장의 34.72%를 차지할 것으로 예상되며, 휴대성, 야외 시인성, 핫스왑이 가능한 배터리, 물류 및 현장 서비스 업무에 적합한 태블릿 PC는 2025년 기준 34.72%를 차지할 것으로 예측됩니다. AI 코프로세서를 통한 기기 내 컴퓨터 비전 분석이 가능해짐에 따라 태블릿 PC용 러기드 디스플레이 시장 규모는 2031년까지 연평균 복합 성장률(CAGR) 4.25%를 나타낼 것으로 예측됩니다. 지게차, 소방차, 전술 차량에 탑재되는 차량용 단말기는 자율 이동 기술에 대한 투자에 힘입어 CAGR 6%로 가장 빠르게 성장하는 틈새 시장입니다. 공공안전-공공서비스 분야에서는 한 손 조작으로 신속한 업무처리가 가능한 스마트폰과 핸드헬드 단말기가 틈새 시장을 점유하고 있습니다. 한편, 24-55인치의 멀티 터치 조작면이 요구되는 제어실에서는 여전히 패널 PC가 필수적입니다.
엣지 AI와 첨단 칩셋의 융합으로 디바이스 개발 계획이 재편되고 있습니다. 파나소닉의 TOUGHBOOK 40 Mk2는 인텔 코어 울트라 실리콘을 활용하여 MIL-STD-810H 낙하 기준을 충족하면서 AI 추론 성능을 143% 향상시켰습니다. 이는 러기드 디스플레이 시장이 범용 노트북에서 전문가용 컴퓨팅으로 전환하는 한 예입니다. 미션 특화 펌웨어, 글로브 대응 터치 디스플레이, 밀폐형 I/O 포트가 신제품의 차별화 요소입니다. 장비군 갱신 시 구매자는 내구성 지표 외에도 수명주기 비용, 주변기기 생태계, 사이버 보안 인증 등을 비교 검토합니다.
완전 내환경 하드웨어는 2025년 내환경 디스플레이 시장의 47.10%를 차지할 것으로 예상되며, 공장 현장, 창고, 국방 전선 기지에서 비용과 내구성의 균형을 이룰 것으로 보입니다. 초강력 모델은 영하에서 시동, 염수분무 부식, 10,000psi의 압력을 견딜 수 있도록 설계되어 광업, 석유 및 가스, 특수부대의 환경적 요구가 증가함에 따라 CAGR 6.9%로 확대되고 있습니다. 준견고한 모델은 충격파나 폭발 과압이 아닌 우발적인 낙하나 액체 비산이 위험요소가 되는 경공업 및 소매 환경에 적합한 도입 가격대를 제공합니다.
MIL-STD-810H 등 엄격한 시험기준이 특수부대용에서 일반 물류 입찰로 전환되고 있으며, 가격대를 불문하고 사양의 고도화를 촉진하고 있습니다. 초강력 장비 시장 규모는 프리미엄 가격이 유지되는 가운데, 수량 성장률을 상회할 것으로 예측됩니다. 각 벤더들은 모듈형 확장 베이, 전파 흡수 인클로저, 현장 교체 가능한 SSD를 추가하여 자산의 미래성을 보장하고 있습니다. 구매자들은 다운타임으로 인한 손실이 초기 비용보다 더 크다는 것을 인식하고 있으며, 세미 라기드 조달 주기에서도 더 높은 내구성 평가로의 전환이 가속화되고 있습니다.
지역별 분석
북미는 2025년 러기드 디스플레이 시장 매출의 37.15%를 차지했습니다. 국방 조달, OSHA(산업안전보건국) 및 MSHA(광산안전보건국)의 엄격한 안전 기준, 성숙한 산업 자동화 기반이 이를 주도하고 있습니다. 미 육군의 ENVG-B(야간투시용 고글) 등의 계약으로 야간투시용 스크린의 대량 생산이 지속되고 있습니다. 캐나다에서는 혹독한 환경의 광업과 파이프라인 모니터링이 수요를 확대하고 있으며, 멕시코에서는 근해 제조의 확대로 자동차 및 전자제품 공장에서의 채용이 증가하고 있습니다. 지역 바이어들은 공급망 안전과 ITAR(국제무기거래규정) 준수를 중시하며, 국내 및 동맹국 공급업체와의 관계 강화를 위해 노력하고 있습니다.
아시아태평양은 CAGR 5.62%로 가장 빠른 성장세를 보이고 있으며, 공장 디지털화, 5G 사설망 구축, 정부 주도의 인더스트리 4.0으로의 도약이 주도하고 있습니다. 중국은 전자제품 제조의 규모의 경제와 적극적인 자동화 보조금을 결합하고, 일본은 로봇 기술의 전문성을 갖춘 저 지연 시각화 노드를 필요로 합니다. 인도에서는 통신 중심의 디지털 인프라 계획이 철도 및 공공시설에 러기드 태블릿을 도입할 수 있는 새로운 기회를 창출하고 있습니다. 스마트공장 시범사업에서 확인된 52-245%의 생산성 향상은 설비투자의 정당성을 뒷받침합니다. 동남아시아의 전자기기 클러스터와 호주 광업 프로젝트가 지역 수요를 보완하고, 다양한 업종에 걸친 수요를 강화합니다.
유럽에서는 ATEX 안전 규제, 자동차 전동화 프로그램, 항공우주 분야 연구개발 및 제휴를 기반으로 안정적인 성장을 기록하고 있습니다. 독일은 자동차 조립 분야에서 도입을 주도하고 있으며, 인간과 로봇의 협업 작업에는 밀폐형 장갑 조작이 가능한 패널이 요구되고 있습니다. 영국은 항공대를 위해 조종석 디스플레이 및 미션 컴퓨팅 업그레이드를 조달하고 있습니다. 북유럽 국가들은 풍력 발전소 모니터링 및 극한의 해상 운송 항로에 대한 투자를 추진하고 있으며, 가열식 터치 표면을 갖춘 초강력 인클로저를 선호하고 있습니다. 유럽의 규제 상황은 종합적인 인증 포트폴리오를 보유한 벤더를 평가하고, 낮은 고장률의 하드웨어에 대한 프리미엄 가격을 책정할 수 있도록 하고 있습니다.
기타 특전:
- 엑셀 형식 시장 예측(ME) 시트
- 애널리스트 지원(3개월)
자주 묻는 질문
목차
제1장 서론
제2장 조사 방법
제3장 주요 요약
제4장 시장 구도
제5장 시장 규모와 성장 예측
제6장 경쟁 구도
제7장 시장 기회와 향후 전망
LSH 26.03.10The rugged display market is expected to grow from USD 10.85 billion in 2025 to USD 11.32 billion in 2026 and is forecast to reach USD 14.01 billion by 2031 at 4.36% CAGR over 2026-2031.
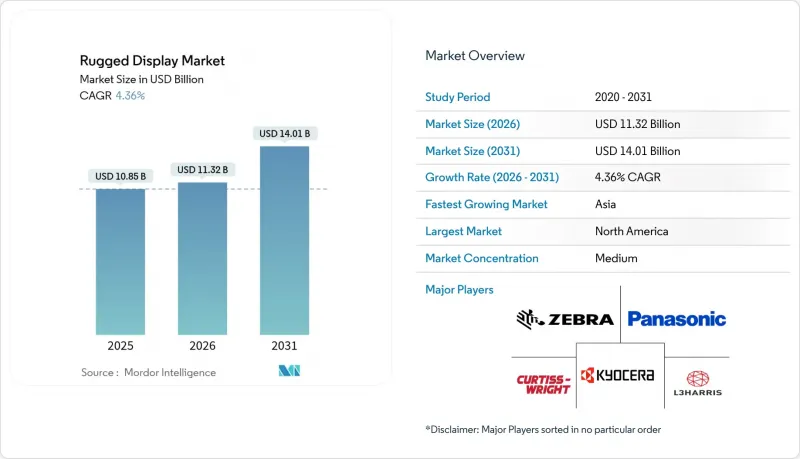
The expansion reflects the digitization of mission-critical operations across defense, industrial, and emergency-response settings where commercial screens cannot survive shocks, vibration, or extreme temperatures. Rising adoption of augmented-reality (AR) workflows, 5G-enabled smart-factory upgrades, and military modernization programs are broadening the application base for sunlight-readable, intrinsically-safe, and thermally-managed panels. A shifting product mix toward tablet PCs, vehicle-mounted computers, and ultra-rugged form factors is reshaping vendor roadmaps. Geographic momentum is strongest in Asia-Pacific as manufacturers integrate private 5G networks, while North America retains leadership thanks to defense spending and strict industrial-safety rules. Intensifying supply-chain risks around China-centric LCD production and OLED thermal constraints pose headwinds but also spur R&D in alternative materials and regional sourcing.
Global Rugged Display Market Trends and Insights
Integration of AR Interfaces in Field-Service Applications
Hands-free AR-ready head-mounted tablets such as RealWear Navigator 520 improve first-time-fix rates by streaming live diagrams, tele-mentoring sessions, and equipment data directly in the operator's line of sight. Global AR hardware shipments are accelerating at 50.7% CAGR through 2030, feeding demand for impact-resistant, voice-controlled displays certified for explosive atmospheres. Vendors focus on low-power chipsets and efficient backlights to extend shift-length battery life. The rugged display market is therefore evolving from passive visualization toward interactive, sensor-rich platforms that blend digital overlays with real-world assets. Manufacturers that master heat-dissipation techniques and eye-safe luminance levels position themselves to capture mid-term growth from utilities, oil-and-gas maintenance, and heavy-equipment OEM service teams.
Adoption of Rugged Displays for Autonomous Military Vehicles and Unmanned Systems
Defense agencies specify modular open-systems architectures so that adaptive flight displays like Collins Aerospace's AFD-3210 can be upgraded as AI-driven autonomy matures. NVIS-compatible touchscreens with 9,000-hour MTBF meet night-vision and low-signature requirements, while sealed enclosures withstand shock, dust, and electromagnetic interference. The transition aligns with long procurement cycles that extend beyond 2028, but early prototypes embedded in optionally-manned ground vehicles validate demand. The rugged display market benefits from multi-domain command interfaces where real-time sensor fusion, kinetic-target data, and predictive-maintenance alerts converge on a single panel. Suppliers able to balance thermal constraints against rising on-board processing loads gain strategic advantage.
Thermal-Management Challenges Limiting OLED in High-Temperature Defense Missions
Organic emissive layers degrade quickly at sustained temperatures above 85 °C, prompting militaries to favor LCD technology for vehicle dashboards and mast-mounted sights. Cooling plates, heat pipes, and conduction-cooled enclosures add weight and power draw, offsetting OLED's theoretical efficiency. As engine-bay and desert climates can surpass 125 °C, rugged display market vendors prioritize robust amorphous-silicon LCDs while funding R&D into inorganic emissive materials that might satisfy future performance criteria without thermal fragility.
Other drivers and restraints analyzed in the detailed report include:
- Stringent Safety Regulations in Hazardous Industrial Environments
- Rising Demand for High-Brightness Sunlight-Readable Screens
- Supply-Chain Volatility of Industrial LCD Panels
For complete list of drivers and restraints, kindly check the Table Of Contents.
Segment Analysis
Tablet PCs accounted for 34.72% of the rugged display market in 2025, combining portability, outdoor readability, and hot-swappable batteries that align with logistics and field-service workflows. The rugged display market size for tablet PCs is projected to climb at 4.25% CAGR through 2031 as AI co-processors enable on-device computer-vision analytics. Vehicle-mounted terminals, installed on forklifts, fire engines, and tactical trucks, represent the fastest-growing niche at 6% CAGR, fueled by autonomous-mobility investments. Smartphones and handhelds hold niche share in public-safety and utilities where single-hand operation speeds ticket closure. Panel PCs remain essential in control rooms that demand 24-inch to 55-inch multi-touch surfaces.
Convergence of edge-AI and advanced chipsets is reshaping device roadmaps. Panasonic's TOUGHBOOK 40 Mk2 leverages Intel Core Ultra silicon to lift AI inference performance by 143% while meeting MIL-STD-810H drop standards. This illustrates how the rugged display market pivots toward specialized computing over generic laptops. Mission-specific firmware, glove-touch displays, and sealed I/O ports differentiate new releases. As fleets refresh, buyers compare lifecycle cost, accessory ecosystems, and cybersecurity certifications alongside raw durability metrics.
Fully-rugged hardware captured 47.10% rugged display market share in 2025, balancing cost and durability for factory floors, warehouses, and frontline defense outposts. Ultra-rugged variants, engineered to withstand sub-zero starts, salt-fog corrosion, and 10,000-psi pressure, are advancing at 6.9% CAGR as mining, oil-and-gas, and special-forces operations escalate environmental demands. Semi-rugged models offer entry pricing for light-industrial and retail settings where occasional drops or spills, rather than shock waves or blast over-pressure, define risk profiles.
Stringent test regimes such as MIL-STD-810H are migrating from elite military to mainstream logistics tenders, driving spec inflation across price bands. The rugged display market size for ultra-rugged gear is poised to outpace unit growth as premium pricing holds. Vendors add modular expansion bays, RF-absorbing housings, and field-swappable SSDs to future-proof assets. Buyers recognise that downtime penalties outweigh initial premiums, reinforcing a shift toward higher endurance ratings even in semi-rugged procurement cycles.
The Rugged Display Market Report is Segmented by Product Type (Smartphones and Handheld Computers, Tablet PCs, Laptops and Notebooks, and More), Level of Ruggedness (Semi-Rugged, Fully-Rugged, and Ultra-Rugged), Operating System (Android, Windows, and More), End User (Oil and Gas, Government, Defense and Aerospace, Industrial Manufacturing, and More) and Geography. The Market Forecasts are Provided in Terms of Value (USD).
Geography Analysis
North America generated 37.15% of rugged display market revenue in 2025, propelled by defense procurement, stringent OSHA and MSHA safety codes, and a mature industrial automation base. Contracts such as the U.S. Army's ENVG-B sustain high-volume production runs for night-vision-ready screens. Canada extends demand through harsh-weather mining and pipeline monitoring, while Mexico's expansion of near-shore manufacturing catalyzes adoption in automotive and electronics plants. Regional buyers emphasize supply-chain security and ITAR compliance, reinforcing relationships with domestic and allied suppliers.
Asia-Pacific is the fastest-growing region at 5.62% CAGR, driven by factory digitization, 5G private-network rollouts, and government initiatives to leapfrog to Industry 4.0. China's scale in electronics manufacturing combines with aggressive automation subsidies, while Japan's robotics expertise demands low-latency visualization nodes. India's telecom-centric digital infrastructure programs create new opportunities for rugged tablet deployments in railways and public utilities. Productivity gains of 52%-245% observed in pilot smart factories validate capital spend. Southeast Asian electronics clusters and Australian mining projects round out regional demand, reinforcing a diversified pull across verticals.
Europe records steady growth underpinned by ATEX safety mandates, automotive e-mobility programs, and aerospace R&D partnerships. Germany leads adoption in automotive assembly where human-robot collaboration requires sealed, glove-operable panels. The United Kingdom procures cockpit displays and mission-computing upgrades for its air fleet. Nordic investment in wind-farm monitoring and extreme-cold shipping lanes favors ultra-rugged enclosures with heated touch surfaces. Europe's regulatory landscape rewards vendors with comprehensive certification portfolios, allowing premium pricing for low-failure-rate hardware.
- Curtiss-Wright Corporation
- General Dynamics Corporation
- Collins Aerospace (Raytheon Technologies)
- L3Harris Technologies Inc.
- Esterline Technologies Corporation
- Xplore Technologies Corporation
- Beijer Electronics AB
- Kyocera Corporation
- Sparton Corporation
- Panasonic Holdings Corporation
- Zebra Technologies Corporation
- Getac Technology Corporation
- Dell Technologies Inc.
- Trimble Inc.
- Honeywell International Inc.
- Winmate Inc.
- Advantech Co., Ltd.
- Rockwell Automation, Inc. (Allen-Bradley)
- Juniper Systems Inc.
- AAEON Technology Inc.
- Datalogic S.p.A.
- Leonardo S.p.A.
- Crystal Group, Inc.
Additional Benefits:
- The market estimate (ME) sheet in Excel format
- 3 months of analyst support
TABLE OF CONTENTS
1 INTRODUCTION
- 1.1 Study Assumptions and Market Definition
- 1.2 Scope of the Study
2 RESEARCH METHODOLOGY
3 EXECUTIVE SUMMARY
4 MARKET LANDSCAPE
- 4.1 Market Overview
- 4.2 Market Drivers
- 4.2.1 Integration of Augmented Reality Interfaces in Field Service Applications
- 4.2.2 Adoption of Rugged Displays for Autonomous Military Vehicles and Unmanned Systems
- 4.2.3 Stringent Safety Regulations in Hazardous Industrial Environments Boosting Intrinsically-Safe Panels
- 4.2.4 Rising Demand for High-brightness Sunlight-Readable Screens in Outdoor Oil and Gas Operations, Middle East
- 4.2.5 Lifecycle Cost Advantage over Frequent Replacement of Consumer-grade Displays in Mining Fleets
- 4.2.6 Expansion of 5G Private Networks Enabling Rugged Tablet Upgrades in Smart Factories, Asia-Pacific
- 4.3 Market Restraints
- 4.3.1 Thermal Management Challenges Limiting Adoption of OLED in High-temperature Defense Missions
- 4.3.2 Supply Chain Volatility of Industrial LCD Panels Due to China-centric Manufacturing
- 4.3.3 High Initial Capital Outlay for Ultra-rugged Panel PCs in SMB Warehouses
- 4.3.4 Form-factor Constraints as Edge Computing Shifts Towards Wearables
- 4.4 Industry Ecosystem Analysis
- 4.5 Regulatory and Technological Outlook
- 4.6 Porter's Five Forces Analysis
- 4.6.1 Bargaining Power of Suppliers
- 4.6.2 Bargaining Power of Consumers
- 4.6.3 Threat of New Entrants
- 4.6.4 Threat of Substitutes
- 4.6.5 Intensity of Competitive Rivalry
5 MARKET SIZE AND GROWTH FORECASTS (VALUES)
- 5.1 By Product Type
- 5.1.1 Smartphones and Handheld Computers
- 5.1.2 Tablet PCs
- 5.1.3 Laptops and Notebooks
- 5.1.4 Avionics Displays
- 5.1.5 Vehicle-mounted Computers
- 5.1.6 Panel PCs and Mission-critical Displays
- 5.2 By Level of Ruggedness
- 5.2.1 Semi-rugged
- 5.2.2 Fully-rugged
- 5.2.3 Ultra-rugged
- 5.3 By Operating System
- 5.3.1 Android
- 5.3.2 Windows
- 5.3.3 Linux and Other
- 5.4 By End-User
- 5.4.1 Oil and Gas
- 5.4.2 Government, Defense and Aerospace
- 5.4.3 Industrial Manufacturing
- 5.4.4 Automotive, Transportation and Logistics
- 5.4.5 Healthcare and Public Safety
- 5.4.6 Utilities and Energy
- 5.4.7 Other End-Users
- 5.5 By Geography
- 5.5.1 North America
- 5.5.1.1 United States
- 5.5.1.2 Canada
- 5.5.1.3 Mexico
- 5.5.2 Europe
- 5.5.2.1 Germany
- 5.5.2.2 United Kingdom
- 5.5.2.3 France
- 5.5.2.4 Nordics
- 5.5.2.5 Rest of Europe
- 5.5.3 South America
- 5.5.3.1 Brazil
- 5.5.3.2 Rest of South America
- 5.5.4 Asia-Pacific
- 5.5.4.1 China
- 5.5.4.2 Japan
- 5.5.4.3 India
- 5.5.4.4 South-East Asia
- 5.5.4.5 Rest of Asia-Pacific
- 5.5.5 Middle East and Africa
- 5.5.5.1 Middle East
- 5.5.5.1.1 Gulf Cooperation Council Countries
- 5.5.5.1.2 Turkey
- 5.5.5.1.3 Rest of Middle East
- 5.5.5.2 Africa
- 5.5.5.2.1 South Africa
- 5.5.5.2.2 Rest of Africa
- 5.5.5.1 Middle East
- 5.5.1 North America
6 COMPETITIVE LANDSCAPE
- 6.1 Market Concentration
- 6.2 Strategic Moves
- 6.3 Market Share Analysis
- 6.4 Company Profiles {(includes Global level Overview, Market level overview, Core Segments, Financials as available, Strategic Information, Market Rank/Share for key companies, Products and Services, and Recent Developments)}
- 6.4.1 Curtiss-Wright Corporation
- 6.4.2 General Dynamics Corporation
- 6.4.3 Collins Aerospace (Raytheon Technologies)
- 6.4.4 L3Harris Technologies Inc.
- 6.4.5 Esterline Technologies Corporation
- 6.4.6 Xplore Technologies Corporation
- 6.4.7 Beijer Electronics AB
- 6.4.8 Kyocera Corporation
- 6.4.9 Sparton Corporation
- 6.4.10 Panasonic Holdings Corporation
- 6.4.11 Zebra Technologies Corporation
- 6.4.12 Getac Technology Corporation
- 6.4.13 Dell Technologies Inc.
- 6.4.14 Trimble Inc.
- 6.4.15 Honeywell International Inc.
- 6.4.16 Winmate Inc.
- 6.4.17 Advantech Co., Ltd.
- 6.4.18 Rockwell Automation, Inc. (Allen-Bradley)
- 6.4.19 Juniper Systems Inc.
- 6.4.20 AAEON Technology Inc.
- 6.4.21 Datalogic S.p.A.
- 6.4.22 Leonardo S.p.A.
- 6.4.23 Crystal Group, Inc.
7 MARKET OPPORTUNITIES AND FUTURE OUTLOOK
- 7.1 White-space and Unmet-Need Assessment
