
|
시장보고서
상품코드
1940686
미국의 스마트 TV : 시장 점유율 분석, 업계 동향과 통계, 성장 예측(2026-2031년)US Smart TV - Market Share Analysis, Industry Trends & Statistics, Growth Forecasts (2026 - 2031) |
||||||
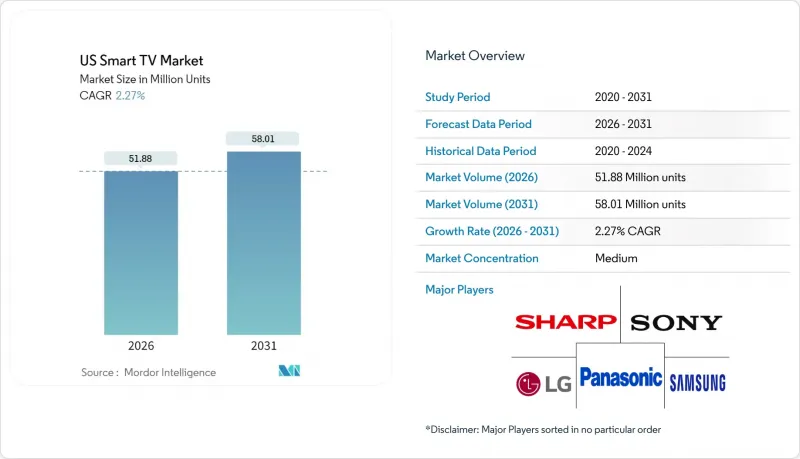
미국의 스마트 TV 시장은 2025년에 5,073만 대라고 평가되어 2026년 5,188만 대로부터 2031년까지 5,801만 대에 이를 것으로 예측됩니다.
예측 기간(2026-2031년)의 CAGR은 2.27%로 예상됩니다.
성숙기에 접어든 가전제품 카테고리의 전반적인 성장 둔화에도 불구하고, 최종 사용자 수요는 고화질, 통합 스트리밍 환경, 게이밍 지원 기능 등으로 옮겨가고 있습니다. 55-64인치의 대형 포맷이 주류 시장의 기조를 계속 유지하고 있는 반면, 75인치 이상의 초대형 스크린은 주요 동경의 구매 대상으로 변모하고 있습니다. 동시에 패널 기술 혁신 주기(4층 구조 OLED, 미니 LED, 신흥 RGB 백라이트 기술)의 가속화로 인해 교체 주기가 단축되고 있습니다. 커넥티드 TV(CTV) 광고를 통한 플랫폼 수익화가 하드웨어 가격을 보완하고, 신규 진입하는 중국 업체들의 가격 경쟁 압력에 맞서 각 브랜드가 판매 점유율을 유지하는 데 일조하고 있습니다. 마지막으로, 주정부 차원의 에너지 절약 혜택과 강화되는 데이터 프라이버시 규제가 제품 개발의 우선순위를 좌우하고 있으며, 이는 미국의 스마트 TV 시장을 둘러싼 복잡한 규제 환경을 잘 보여주고 있습니다.
미국의 스마트 TV 시장 동향 및 인사이트
빠른 4K/8K 업그레이드 주기
4K UHD가 출하량의 절반 이상을 차지하고 있지만, 제조업체들은 8K 지원 프로세서와 첨단 백라이트 기술의 주류화로 기술 주기를 단축하고 있습니다. 삼성이 2025년에 공개한 RGB 미니 LED 프로토타입은 LCD의 원가 경쟁력을 유지하면서 OLED 수준의 콘트라스트를 구현할 수 있습니다. LG의 4중 구조 OLED 아키텍처는 피크 밝기를 40% 향상시켜 프리미엄 모델의 보급을 가로막았던 HDR의 한계를 극복했습니다. 이러한 비약적인 발전은 특히 스트리밍 서비스와 차세대 게임기들이 점차 8K 네이티브 컨텐츠를 제공하게 되면서 기존 사용자들의 조기 구매를 촉진할 것입니다.
내장된 스트리밍 및 앱 생태계
스마트 TV의 OS는 현재 외부 스틱의 기능을 재현하고, TV 브랜드 아래 스토어 프론트, 결제, 타겟팅 광고를 통합하고 있습니다. Roku OS가 여전히 가장 큰 점유율을 차지하고 있지만, 검색 개인화가 시청 시간을 촉진하는 Google TV가 가장 빠르게 성장하고 있습니다. LG는 자사의 webOS 광고 기술로 인한 수익이 2024년 1조원을 돌파할 것으로 보고하고 있어, 플랫폼 경제가 하드웨어의 수익률 하락을 상쇄하고 있음을 증명하고 있습니다.
스마트폰/태블릿 시청을 통한 캐니발리제이션
모바일 화면이 주간 엔터테인먼트 시간을 점점 더 많이 차지하게 되면서, 과거에는 대형 스크린으로 교체해야만 했던 공유 시청 기회가 제한되고 있습니다. 미국 연방거래위원회(FTC)의 2024년 조사는 스트리밍 플랫폼이 모바일 단말기에 지나치게 최적화된 UI 설계를 지적하며, 1인 사용자의 소비 습관을 강화시키고 있다고 강조했습니다. 그러나 게임과 프리미엄 영화 컨텐츠는 여전히 TV의 강점이며, 이러한 캐니발라이제이션 효과를 완화시키고 있습니다.
부문 분석
2025년에도 55-64인치대는 34.02%의 출하 점유율로 1위를 유지하며 주류 최적 사이즈로서의 입지를 확고히 했습니다. 그러나 75인치 이상 부문은 CAGR 2.69%로 가장 빠르게 성장하여 미국 전체 스마트 TV 시장 성장률을 상회할 것으로 예측됩니다. 얼리 어답터들은 몰입형 게임 경험과 극장 수준의 스트리밍을 이유로 프로모션 가격으로 2,000달러 미만의 대형 패널 구매를 정당화하고 있습니다. 삼성은 마이크로 LED 공급망과 적극적인 판촉 전략으로 초대형 포맷 시장의 약 1/3을 점유하고 있습니다. 반면, 45인치 미만 보급형 모델은 개인용 저가형 태블릿과 베젤을 최소화하여 소형 주택에도 적합한 중형 세트의 등장으로 인해 지속적으로 감소하는 추세입니다.
설치업체에 따르면, 무선 브레이크아웃 박스는 설치 시간을 약 40% 단축시켜 기존 주택에서 75인치 벽걸이형 스크린의 보급을 가속화하고 있습니다. ENERGY STAR의 데이터에 따르면, 패널 면적 증가율보다 더 빠른 속도로 평방인치당 전력 소비가 감소하고 있어 에너지 절약에 관심이 높은 구매자들의 전기요금에 대한 우려를 덜어주고 있습니다. 이러한 추세를 종합하면, 대형 디스플레이가 미국의 스마트TV 시장의 주요 촉진제가 될 것임을 알 수 있습니다.
4K UHD는 2025년 출하 점유율 54.02%를 나타낼 것으로 예측되며, 이미 필수 조건이 되었습니다. 신흥 8K 부문은 AI 업스케일링 엔진이 소스 컨텐츠 부족을 보완하는 데 힘입어 3.17%의 연평균 복합 성장률(CAGR)을 보일 것으로 예측됩니다. 마이크로소프트의 Xbox Series X와 소니의 PlayStation 5 Pro는 2025년 펌웨어 업데이트를 통해 8K 출력이 가능하며, 스트리밍 업체들도 한정된 시장에서 8K VOD를 시범 운영하기 시작했습니다. 업셀링 전략은 8K 패널과 단기 할부 플랜을 결합하여 높은 가격을 상쇄하고, 초기 도입자가 3-4년마다 교체할 수 있는 구조를 구축했습니다. 풀HD 모델은 현재 주로 호텔 분야와 가격 중심의 소매점에서 특판 제품으로만 존재하고 있습니다.
OLED 제조업체들은 밝기 향상으로 인해 고품질 4K HDR에 대한 8K의 우위가 줄어들 것이라고 주장하지만, 조사 데이터에 따르면, 초기 게이머층은 벤치마크 성능을 자랑하기 위해 8K TV를 선택하는 경향이 있습니다. 압축 코덱이 성숙해짐에 따라 8K 스트리밍의 대역폭 오버헤드가 감소하여 대규모 배포의 마지막 기술적 장벽 중 하나가 해소될 것으로 예측됩니다.
기타 특전:
- 엑셀 형식 시장 예측(ME) 시트
- 애널리스트 지원(3개월)
자주 묻는 질문
목차
제1장 서론
제2장 조사 방법
제3장 주요 요약
제4장 시장 구도
제5장 시장 규모와 성장 예측
제6장 경쟁 구도
제7장 시장 기회와 향후 전망
LSH 26.03.10The US Smart TV market was valued at 50.73 million units in 2025 and estimated to grow from 51.88 million units in 2026 to reach 58.01 million units by 2031, at a CAGR of 2.27% during the forecast period (2026-2031).

End-user demand is shifting toward premium picture quality, integrated streaming ecosystems, and gaming-ready features, even as overall growth moderates in a maturing consumer electronics category. The momentum behind large formats, notably 55-64 inch sets, continues to anchor mainstream volumes, while ultra-large 75-inch-plus screens turn into the primary aspirational purchase. At the same time, panel innovation cycles, 4-stack OLED, mini-LED, and emerging RGB backlighting, are shortening replacement timelines. Platform monetization through connected-TV (CTV) advertising now subsidizes hardware prices, helping brands defend unit share against aggressive price compression from new Chinese entrants. Finally, state-level energy incentives and tightening data-privacy rules both shape product development priorities, underlining the complex regulatory environment surrounding the US Smart TV market.
US Smart TV Market Trends and Insights
Rapid 4K/8K upgrade cycle
4K UHD already dominates more than half of shipments, yet manufacturers are shortening the technology cycle by mainstreaming 8K-ready processors and advanced backlighting. Samsung's RGB mini-LED prototypes shown in 2025 promise OLED-level contrast while holding LCD cost parity. LG's four-stack OLED architecture lifts peak brightness by 40%, solving HDR limitations that once slowed premium adoption. These step-changes jointly nudge existing owners toward earlier replacement, especially as streaming and next-gen consoles gradually expose 8K native content.
Built-in streaming and app ecosystems
Smart-TV operating systems now replicate the functionality of external sticks, bringing storefronts, payments, and targeted ads under the television brand. Roku OS still accounts for the largest footprint, but Google TV is the fastest riser as search personalization drives watch-time. LG reports that its webOS ad-tech revenue surpassed KRW 1 trillion in 2024, proof that platform economics increasingly offset hardware margin compression.
Smartphone/tablet viewing cannibalization
Mobile screens increasingly capture daytime entertainment minutes, limiting shared viewing occasions that traditionally justified large-screen upgrades. The Federal Trade Commission's 2024 study highlights how streaming platforms over-index their UI design for handheld devices, reinforcing single-user consumption habits. Yet gaming and premium cinematic content remain television strongholds, tempering the cannibalization effect.
Other drivers and restraints analyzed in the detailed report include:
- Surge in larger-than-65" purchases
- CTV advertising revenue sharing creates new business models
- Price compression from low-cost Chinese brands
For complete list of drivers and restraints, kindly check the Table Of Contents.
Segment Analysis
The 55-64 inch band retained a leading 34.02% shipment share in 2025, confirming its role as the mainstream sweet spot. However, the 75-inch-plus segment is set to grow fastest at 2.69% CAGR, outpacing overall US Smart TV market growth. Early adopters cite immersive gaming and theater-grade streaming as justification for purchasing panels that now cost under USD 2,000 at promotion. Samsung commands roughly one-third of ultra-large formats by leveraging its micro-LED supply chain and aggressive channel promotions. Entry-level sub-45-inch models continue sliding, squeezed by cheap tablets for personal viewing and by mid-sized sets that increasingly fit smaller apartments thanks to bezel minimization.
Installers report that wireless breakout boxes reduce setup time by almost 40%, accelerating acceptance of wall-mounted 75-inch screens in existing homes. ENERGY STAR data suggest power consumption per square inch is falling faster than panel area is rising, muting electricity-cost objections among energy-conscious buyers. Collectively, these trends mean that large-format displays will remain the headline growth driver inside the US Smart TV market.
4K UHD reached 54.02% shipment share in 2025, having already become table stakes. The nascent 8K segment is projected to post a 3.17% CAGR, aided by AI-upscaling engines that mask source-content scarcity. Microsoft's Xbox Series X and Sony's PlayStation 5 Pro both enabled 8K output in 2025 firmware updates, and streaming providers have begun test runs of 8K VOD in limited markets. Upsell tactics pair 8K panels with shorter finance plans to offset sticker shock, ensuring early adopters rotate into the pool every 3-4 years. Full-HD models now survive mainly in hospitality and price-first retail doorbusters.
OLED providers argue that brightness gains close the perceived advantage of 8K over high-quality 4K HDR, but survey data show that early gamers disproportionately choose 8K sets for their benchmarking bragging rights. As compression codecs mature, bandwidth overhead for 8K streams will fall, removing one of the last technical hurdles to mass deployment.
The US Smart TV Market Report is Segmented by Screen Size (Up To 45", 45-54", 55-64", 65-74", 75" & Above), Resolution Type (HDTV, Full HD, 4K UHD, 8K UHD), Panel Technology (LCD/LED, QLED, OLED, Mini-LED), Price Band (less Than USD 500, USD 500-999, and More), Operating System (Roku OS, Google/Android TV, and More), and Geography. The Market Forecasts are Provided in Terms of Volume (Units).
List of Companies Covered in this Report:
- Samsung Electronics Co., Ltd.
- LG Electronics Inc.
- Sony Group Corporation
- TCL Electronics Holdings Ltd.
- VIZIO Holding Corp.
- Hisense Group Co., Ltd.
- Panasonic Holdings Corporation
- Sharp Corporation
- Koninklijke Philips N.V.
- Skyworth Group Ltd.
- Xiaomi Corp.
- Amazon.com Inc. (Fire TV Devices)
- Apple Inc. (Apple TV & tvOS Integrations)
- Haier Smart Home Co., Ltd.
- Funai Electric Co., Ltd. (Magnavox/Sanyo)
- Westinghouse Electric Corp.
- Sceptre Inc.
- Insignia Systems Inc. (Insignia TV)
- JVC Kenwood Corp.
- Pioneer Corp.
- Seiki Digital Inc.
- Element Electronics LLC
- Hitachi Ltd.
- LeEco (LeTV)
- Metz Consumer Electronics GmbH
- B&O A/S (Bang & Olufsen)
Additional Benefits:
- The market estimate (ME) sheet in Excel format
- 3 months of analyst support
TABLE OF CONTENTS
1 INTRODUCTION
- 1.1 Study Assumptions and Market Definition
- 1.2 Scope of the Study
2 RESEARCH METHODOLOGY
3 EXECUTIVE SUMMARY
4 MARKET LANDSCAPE
- 4.1 Market Overview
- 4.2 Market Drivers
- 4.2.1 Rapid 4K/8K upgrade cycle
- 4.2.2 Built-in streaming and app ecosystems
- 4.2.3 Surge in larger-than-65" purchases
- 4.2.4 CTV advertising-revenue sharing with OEMs
- 4.2.5 Gaming-optimized TV features (VRR, cloud gaming hubs)
- 4.2.6 Energy-efficiency tax incentives for "ENERGY STAR 9.0" sets
- 4.3 Market Restraints
- 4.3.1 Smartphone/tablet viewing cannibalization
- 4.3.2 Price compression from low-cost Chinese brands
- 4.3.3 OS-level data-privacy pushback curbing telemetry value
- 4.3.4 Supply-chain volatility in mini-LED backlights
- 4.4 Value Chain Analysis
- 4.5 Regulatory Landscape
- 4.6 Technological Outlook
- 4.7 Porter's Five Forces
- 4.7.1 Bargaining Power of Suppliers
- 4.7.2 Bargaining Power of Buyers
- 4.7.3 Threat of New Entrants
- 4.7.4 Threat of Substitutes
- 4.7.5 Competitive Rivalry
- 4.8 Industry Value-Chain Mapping
5 MARKET SIZE AND GROWTH FORECASTS (VOLUME)
- 5.1 By Screen Size
- 5.1.1 Up to 45"
- 5.1.2 45-54"
- 5.1.3 55-64"
- 5.1.4 65-74"
- 5.1.5 75" and Above
- 5.2 By Resolution Type
- 5.2.1 HDTV
- 5.2.2 Full HD
- 5.2.3 4K UHD
- 5.2.4 8K UHD
- 5.3 By Panel Technology
- 5.3.1 LCD/LED
- 5.3.2 QLED
- 5.3.3 OLED
- 5.3.4 Mini-LED
- 5.4 By Price Band
- 5.4.1 less than USD 500
- 5.4.2 USD 500-999
- 5.4.3 USD 1,000-1,999
- 5.4.4 More than USD 2,000
- 5.5 By Operating System
- 5.5.1 Roku OS
- 5.5.2 Google/Android TV
- 5.5.3 Tizen OS
- 5.5.4 webOS
- 5.5.5 Fire TV OS
- 5.5.6 VIDAA U
6 COMPETITIVE LANDSCAPE
- 6.1 Market Concentration
- 6.2 Strategic Moves
- 6.3 Market Share Analysis
- 6.4 Vendor Market Ranking Analysis
- 6.5 Company Profiles (includes Global level Overview, Market level overview, Core Segments, Financials as available, Strategic Information, Market Rank/Share, Products and Services, Recent Developments)
- 6.5.1 Samsung Electronics Co., Ltd.
- 6.5.2 LG Electronics Inc.
- 6.5.3 Sony Group Corporation
- 6.5.4 TCL Electronics Holdings Ltd.
- 6.5.5 VIZIO Holding Corp.
- 6.5.6 Hisense Group Co., Ltd.
- 6.5.7 Panasonic Holdings Corporation
- 6.5.8 Sharp Corporation
- 6.5.9 Koninklijke Philips N.V.
- 6.5.10 Skyworth Group Ltd.
- 6.5.11 Xiaomi Corp.
- 6.5.12 Amazon.com Inc. (Fire TV Devices)
- 6.5.13 Apple Inc. (Apple TV & tvOS Integrations)
- 6.5.14 Haier Smart Home Co., Ltd.
- 6.5.15 Funai Electric Co., Ltd. (Magnavox/Sanyo)
- 6.5.16 Westinghouse Electric Corp.
- 6.5.17 Sceptre Inc.
- 6.5.18 Insignia Systems Inc. (Insignia TV)
- 6.5.19 JVC Kenwood Corp.
- 6.5.20 Pioneer Corp.
- 6.5.21 Seiki Digital Inc.
- 6.5.22 Element Electronics LLC
- 6.5.23 Hitachi Ltd.
- 6.5.24 LeEco (LeTV)
- 6.5.25 Metz Consumer Electronics GmbH
- 6.5.26 B&O A/S (Bang & Olufsen)
7 MARKET OPPORTUNITIES AND FUTURE OUTLOOK
- 7.1 White-Space and Unmet-Need Assessment
