


|
시장보고서
상품코드
1940797
미국의 IT 서비스 : 시장 점유율 분석, 업계 동향과 통계, 성장 예측(2026-2031년)United States (US) IT Services - Market Share Analysis, Industry Trends & Statistics, Growth Forecasts (2026 - 2031) |
||||||
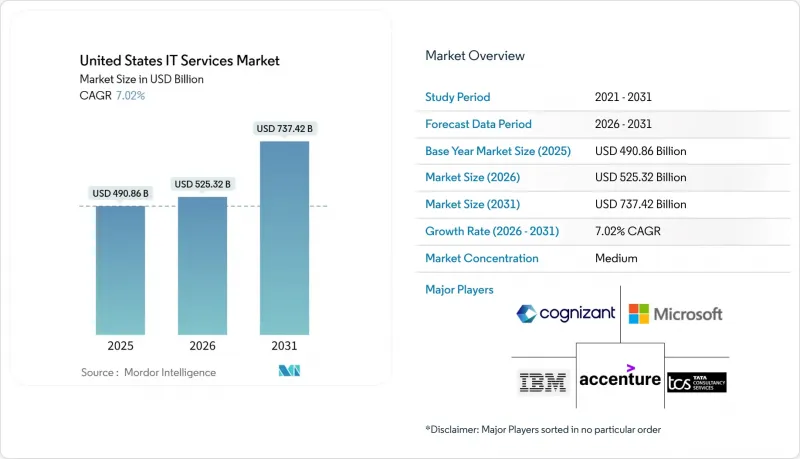
2026년 미국의 IT 서비스 시장 규모는 5,253억 2,000만 달러로 추정되며, 2025년 4,908억 6,000만 달러에서 성장하여 2031년에는 7,374억 2,000만 달러에 달할 것으로 예측됩니다.
2026-2031년 연평균 7.02%의 연평균 복합 성장률(CAGR)을 보일 것으로 예측됩니다.

생성형 AI는 기업 기술 예산의 가장 큰 촉진요인으로 자리매김하고 있으며, 안전한 클라우드 마이그레이션, 5G 엣지 배포, 제로 트러스트 의무화에 대한 연방 정부의 인센티브가 더욱 힘을 실어주고 있습니다. 미국의 IT 서비스 시장은 기업의 견조한 현금 흐름과 공공 및 민간 조직 모두 소비 기반 운영 모델로의 빠른 전환으로 인한 혜택을 누리고 있습니다. 경쟁은 여전히 치열하며, 세계 시스템 통합사업자들이 인재와 자체 AI 플랫폼을 확보하기 위해 틈새 전문업체를 인수하는 움직임이 계속되고 있으며, 벤더 통합이 진행되고 있습니다. 지역적 트렌드는 더욱 복잡성을 더하고 있습니다. 서부 지역이 주도권을 쥐고 있는 반면, 남부 지역은 급증하는 AI 워크로드 수요에 대응하기 위해 새로운 데이터센터 회랑이 생겨나며 가장 빠르게 규모를 확장하고 있습니다.
미국의 IT 서비스 시장 동향과 인사이트
미국 공공 부문의 클라우드 전환을 가속화하는 연방 정부 인센티브 제공
연방 정부 기관은 2024년 상반기에 130억 달러 규모의 신규 IT 서비스 계약을 발표했으며, 2025년 민간 기관 예산 중 751억 3,000만 달러가 기술 분야에 배정되었고, 그 중 16.4%가 사이버 보안에 할당되었습니다. 초당적 제안으로 AI 이니셔티브에 320억 달러의 추가 자금이 요구되고 있으며, FedRAMP 승인을 받은 클라우드 및 보안 조치를 갖춘 제공업체에 대한 기회가 확대되고 있습니다. 대통령령 14028호는 컴플라이언스의 근간이 되는 법령으로, 모든 기관의 안전한 클라우드 도입을 의무화하고 있습니다. 워싱턴 DC, 버지니아, 메릴랜드에 기반을 둔 서비스 파트너들은 급성장하는 공공 부문 프로젝트를 수주하기 위해 배송 센터를 확장하기 시작했습니다.
포춘지 선정 1000대 기업에 생성형 AI 대규모 도입
2025년 중반까지 포춘지 선정 1000대 기업 중 거의 절반이 AI를 핵심 업무 흐름에 도입할 것으로 예상되며, CEO들이 전사적 확산을 우선시함에 따라 그 비율은 급격히 증가할 것으로 전망됩니다. 2025년 AI 연간 예산은 평균 14% 증가할 것으로 예상되며, 데이터 엔지니어링 기반, 거버넌스 모델, 책임 있는 AI 관리에 대한 지출이 집중될 것입니다. 이에 따라 미국의 IT 서비스 시장, 특히 북동부 금융센터와 서해안 혁신 클러스터에서 클라우드 재플랫폼화, LLM 튜닝, 모델 운영 관리 서비스에 대한 수요가 사상 최고치를 기록하고 있습니다.
고급 클라우드 보안 인력 부족
미국의 고용주들은 클라우드 아키텍트 및 고급 보안 엔지니어의 만성적인 부족을 보고하고 있으며, 이러한 인력 부족으로 인해 프로젝트 처리 능력이 제한되고 임금 인플레이션이 가속화되고 있습니다. 이러한 압력은 시애틀, 오스틴, 북버지니아 등 기술 클러스터에서 가장 심각하며, 하이퍼스케일러와 컨설팅 회사가 같은 고급 인력 풀을 놓고 경쟁하고 있습니다. 제로 트러스트 프레임워크를 도입하는 정부 기관은 민간 부문의 보상 수준을 따라잡기 어려워 국내 리더십과 니어쇼어 제공 능력을 겸비한 인력 증강 기업의 활용을 촉진하고 있습니다. 현재 여러 서비스 제공업체들이 AI 기반 소싱 툴을 도입하여 후보자 선별을 가속화하고 공석 공백을 줄이기 위해 노력하고 있습니다.
부문 분석
매니지드 서비스는 2025년 기준 미국의 IT 서비스 시장의 27.85%를 차지했습니다. 이는 기업이 운영 기능을 아웃소싱하고 한정된 인력을 차별화 혁신에 집중하려는 움직임이 배경에 있습니다. 하이브리드 인프라의 복잡성과 끊임없는 사이버 위협은 완전 관리형 가시성, 패치 적용 및 컴플라이언스 서비스에 대한 수요를 증가시키고 있습니다. 공급자는 번들형 매니지드 서비스를 고부가가치 혁신 프로젝트의 발판으로 삼고 지속적인 수익원과 고객 유지의 발판으로 삼고 있습니다.
클라우드 및 플랫폼 서비스는 2026-2031년 연평균 복합 성장률(CAGR) 9.02%로 확대되며 미국의 IT 서비스 시장의 성장 동력이 될 것으로 보입니다. 고객들은 대규모 생성형 AI 파일럿을 퍼블릭 클라우드 기반에서 직접 가속화하고, 종량제 경제를 통해 프라이빗 데이터센터로부터의 워크로드 전환이 진행되고 있습니다. 서비스 파트너는 지출 관리를 위해 공인된 클라우드 팀과 FinOps 역량을 확장하고 있습니다. 애플리케이션 개발 및 유지보수 서비스는 레거시 환경이 마이크로서비스와 서버리스 패러다임으로 전환되는 가운데, 여전히 큰 거래량을 확보하고 있습니다. 한편, 사이버 보안 및 디지털 전환 자문 서비스는 규제 당국의 감시 강화와 이사회 차원의 현대화 로드맵의 우선순위 향상에 힘입어 견조한 파이프라인을 유지하고 있습니다.
2025년 기준 미국의 IT 서비스 시장 규모의 62.65%를 온쇼어 딜리버리가 차지할 것으로 예상되며, 이는 규제 준수, 시간대 일관성, 도메인 지식에 대한 고객의 선호도를 반영합니다. 국내 청구 단가는 시간당 115-175달러 수준으로, 특히 규제 산업에서 고도로 전문화된 컨설턴트에게 높은 보수가 지급되고 있습니다. 공급자는 고부가가치 아키텍처 및 거버넌스 업무를 대도시 지역에 집중하고, 실행 업무를 저비용의 미국 내 도시에 분산하여 수익률을 유지하고 있습니다.
니어쇼어 딜리버리는 2031년까지 연평균 복합 성장률(CAGR) 10.05%로 확대될 것으로 예상되며, 미국 비즈니스 팀과 라틴아메리카 엔지니어 인력을 연결하는 스페인어와 포르투갈어를 구사하는 애자일 팀에 대한 수요 증가에 대응하고 있습니다. '니어쇼어 플러스' 모델을 채택한 기업은 솔루션 아키텍트를 미국에 배치하고 멕시코, 콜롬비아, 코스타리카에서 개발을 확대합니다. 시간당 단가는 85달러 내외로 통합되어 있습니다. 오프쇼어 배송은 비용 우위를 유지하지만, 벵갈루루, 마닐라 등 전통적 거점의 임금 상승으로 인해 기밀성이 높은 업무의 선택적 국내 회귀가 진행되고 있습니다.
미국의 IT 서비스 시장은 유형별(IT 컨설팅/도입, ADM 등), 도입 모델별(온쇼어 제공, 니어쇼어 제공 등), 계약 형태별(프로젝트 기반/정액제 등), 조직 규모별(대기업, 중소기업), 최종 사용자별(은행, 금융서비스 및 보험(BFSI), 제조업, 정부기관 등), 지역별로 분류됩니다.), 지역별로 분류됩니다. 시장 예측은 달러로 표시된 금액으로 제공됩니다.
기타 특전:
- 엑셀 형식 시장 예측(ME) 시트
- 애널리스트의 3개월간 지원
자주 묻는 질문
목차
제1장 서론
제2장 조사 방법
제3장 주요 요약
제4장 시장 구도
제5장 시장 규모와 성장 예측
제6장 경쟁 구도
제7장 시장 기회와 향후 전망
LSH 26.03.10United States IT Services Market size in 2026 is estimated at USD 525.32 billion, growing from 2025 value of USD 490.86 billion with 2031 projections showing USD 737.42 billion, growing at 7.02% CAGR over 2026-2031.
Generative AI ranks as the single largest driver of enterprise technology budgets, while federal incentives for secure cloud migration, 5G-edge roll-outs, and zero-trust mandates supply additional tailwinds. The United States IT services market also benefits from resilient corporate cash flows and the rapid shift of both public and private organizations toward consumption-based operating models. Competition remains intense, yet vendor consolidation continues as global systems integrators acquire niche specialists to secure talent and proprietary AI platforms. Regional dynamics add another layer of complexity: the West retains leadership, but the South is scaling fastest as new data-center corridors emerge to meet surging AI workload demand.
United States (US) IT Services Market Trends and Insights
Federal Incentives Accelerating Cloud Migration in US Public Sector
Federal agencies announced USD 13 billion in new IT services contracts during H1 2024, and the civilian-agency budget for 2025 allocates USD 75.13 billion toward technology, 16.4% of which is earmarked for cybersecurity. A bipartisan proposal seeks an additional USD 32 billion for AI initiatives, widening opportunities for providers with FedRAMP-authorized cloud and security practices.Executive Order 14028 acts as the compliance backbone, mandating secure cloud adoption across agencies. Service partners positioned around Washington, DC, Virginia, and Maryland have begun expanding delivery centers to capture the rapidly growing public-sector pipeline.
Large-Scale Adoption of Generative AI among Fortune 1000
By mid-2025, nearly half of Fortune 1000 enterprises had embedded generative AI into core workflows, and the share is projected to climb sharply as CEOs prioritize enterprise-wide rollouts. Average annual AI budgets are set to rise 14% in 2025, concentrating spend on data-engineering foundations, governance models, and responsible AI controls.The United States IT services market is therefore witnessing record demand for cloud re-platforming, LLM tuning, and model-ops managed services, especially in financial centers along the Northeast corridor and innovation clusters on the West Coast.
Scarcity of Senior Cloud & Security Talent
Employers across the United States report persistent shortages of cloud architects and senior security engineers, a gap that limits project throughput and increases wage inflation. The pressure is fiercest in technology clusters such as Seattle, Austin, and Northern Virginia, where hyperscalers and consultancies compete for the same high-end talent pools. Agencies implementing zero-trust frameworks struggle to match private-sector compensation, encouraging heavier use of staff-augmentation firms that combine domestic leadership with nearshore delivery capacity. Several service providers now deploy AI-based sourcing tools to accelerate candidate screening and reduce vacancy gaps.
Other drivers and restraints analyzed in the detailed report include:
- 5G & Edge Roll-out Driving Network Integration Demand
- Zero-Trust Cybersecurity Mandates Boosting Security Services
- Margin Pressure from Outcome-Based Pricing Models
For complete list of drivers and restraints, kindly check the Table Of Contents.
Segment Analysis
Managed Services held 27.85% of the United States IT services market in 2025, driven by enterprises outsourcing run-and-operate functions to focus scarce talent on differentiating innovation. Hybrid-infrastructure complexity and relentless cyberthreats reinforce demand for fully managed observability, patching, and compliance services. Providers position bundled managed offerings as stepping stones to higher-value transformation engagements, ensuring annuity revenue streams and sticky client relationships.
Cloud & Platform Services, expanding at a 9.02% CAGR from 2026-2031, represents the growth engine of the United States IT services market. Clients accelerate large-scale generative-AI pilots directly onto public-cloud foundations, and consumption-based economics move more workloads off private data centers. Service partners, therefore, scale certified cloud squads and FinOps capabilities to control spend. Application Development & Maintenance services still secure sizable deal flow as legacy estates shift toward microservices and serverless paradigms. Meanwhile, cybersecurity and digital-transformation advisory maintain strong pipelines, given regulatory scrutiny and board-level prioritization of modernization road maps.
Onshore Delivery accounted for 62.65% of the United States IT services market size in 2025, reflecting client preference for regulatory compliance, timezone alignment, and domain knowledge. Domestic bill rates in the USD 115-175 per hour band reward deeply specialized consultants, especially in regulated industries. Providers sustain margin by concentrating high-touch architecture and governance roles in metropolitan hubs while dispersing execution to lower-cost U.S. cities.
Nearshore Delivery, forecast to grow 10.05% CAGR to 2031, meets rising demand for Spanish- and Portuguese-speaking agile pods that bridge U.S. business teams and Latin American engineering talent. Firms adopting a "Nearshore Plus" model base solution architects in the U.S. and scale development in Mexico, Colombia, and Costa Rica at blended rates near USD 85 per hour. Offshore delivery continues to supply cost leverage, but wage inflation in traditional hubs such as Bengaluru and Manila triggers selective reshoring of sensitive workloads.
The United States (US) IT Services is Segmented by Type (IT Consulting and Implementation, ADM, and More), Deployment Model (Onshore Delivery, Nearshore Delivery, and More), Engagement Model (Project-Based / Fixed Price, and More), Organization Size (Large Enterprises, Smes), End-User (BFSI, Manufacturing, Government, and More), and by Geography. The Market Forecasts are Provided in Terms of Value in USD.
List of Companies Covered in this Report:
- Accenture plc
- IBM Corporation
- Cognizant Technology Solutions Corp.
- Tata Consultancy Services Ltd.
- Microsoft Corporation
- Infosys Ltd.
- Wipro Ltd.
- Deloitte Consulting LLP
- Capgemini SE
- HCL Technologies Ltd.
- CGI Inc.
- DXC Technology Co.
- Booz Allen Hamilton Inc.
- Leidos Holdings Inc.
- Atos SE
- EPAM Systems Inc.
- NTT DATA Services
- Kyndryl Holdings Inc.
- LTI Mindtree Ltd.
- Tech Mahindra Ltd.
- Slalom LLC
- Perficient Inc.
- ThoughtWorks Inc.
- Persistent Systems Ltd.
Additional Benefits:
- The market estimate (ME) sheet in Excel format
- 3 months of analyst support
TABLE OF CONTENTS
1 INTRODUCTION
- 1.1 Study Assumptions and Market Definition
- 1.2 Scope of the Study
2 RESEARCH METHODOLOGY
3 EXECUTIVE SUMMARY
4 MARKET LANDSCAPE
- 4.1 Market Overview
- 4.2 Market Drivers
- 4.2.1 Federal Incentives Accelerating Cloud Migration in US Public Sector
- 4.2.2 Large-scale Adoption of Generative AI among Fortune 1000
- 4.2.3 5G and Edge Roll-out Driving Network Integration Demand
- 4.2.4 Zero-Trust Cybersecurity Mandates Boosting Security Services
- 4.2.5 Healthcare Interoperability Rules Fueling EHR Integration Services
- 4.2.6 PE-Backed ERP Modernization Wave in Mid-Market Firms
- 4.3 Market Restraints
- 4.3.1 Scarcity of Senior Cloud and Security Talent
- 4.3.2 Margin Pressure from Outcome-Based Pricing Models
- 4.3.3 Compliance Complexity under CCPA/CPRA Litigation
- 4.3.4 Offshore Wage Inflation Eroding Cost Advantages
- 4.4 Value / Supply-Chain Analysis
- 4.5 Regulatory Outlook
- 4.6 Technological Outlook
- 4.7 Porter's Five Forces
- 4.7.1 Bargaining Power of Suppliers
- 4.7.2 Bargaining Power of Buyers
- 4.7.3 Threat of New Entrants
- 4.7.4 Degree of Competition
- 4.7.5 Threat of Substitutes
- 4.8 Comparative Insights: Tier 1 vs Tier 2 Vendors
- 4.9 In-housing vs Outsourcing Analysis
- 4.10 Investment Analysis
5 MARKET SIZE AND GROWTH FORECASTS (VALUE)
- 5.1 By Service Type
- 5.1.1 IT Consulting and Implementation
- 5.1.2 Application Development and Maintenance (ADM)
- 5.1.3 Infrastructure Services
- 5.1.4 Managed Services
- 5.1.5 IT Outsourcing (ITO)
- 5.1.6 Business Process Outsourcing (BPO)
- 5.1.7 Cloud and Platform Services
- 5.1.8 Cybersecurity Services
- 5.1.9 Digital Transformation and Emerging Tech (AI, IoT, Blockchain)
- 5.2 By Deployment Model
- 5.2.1 Onshore Delivery
- 5.2.2 Nearshore Delivery
- 5.2.3 Offshore Delivery
- 5.3 By Engagement Model
- 5.3.1 Project-based / Fixed Price
- 5.3.2 Staff Augmentation / Time-and-Material
- 5.3.3 Managed Services / Outcome-based
- 5.4 By Organization Size
- 5.4.1 Large Enterprises
- 5.4.2 Small and Medium Enterprises (SMEs)
- 5.5 By End-User Industry
- 5.5.1 Banking, Financial Services and Insurance (BFSI)
- 5.5.2 Manufacturing
- 5.5.3 Government and Public Sector
- 5.5.4 Healthcare and Life Sciences
- 5.5.5 Retail and Consumer Goods
- 5.5.6 Telecom and Media
- 5.5.7 Transportation and Logistics
- 5.5.8 Energy and Utilities
- 5.5.9 Others
- 5.6 By Geography
- 5.6.1 Northeast
- 5.6.2 Midwest
- 5.6.3 South
- 5.6.4 West
6 COMPETITIVE LANDSCAPE
- 6.1 Market Concentration
- 6.2 Strategic Moves
- 6.3 Market Share Analysis
- 6.4 Company Profiles (includes Global level Overview, Market level overview, Core Segments, Financials as available, Strategic Information, Market Rank/Share for key companies, Products and Services, and Recent Developments)
- 6.4.1 Accenture plc
- 6.4.2 IBM Corporation
- 6.4.3 Cognizant Technology Solutions Corp.
- 6.4.4 Tata Consultancy Services Ltd.
- 6.4.5 Microsoft Corporation
- 6.4.6 Infosys Ltd.
- 6.4.7 Wipro Ltd.
- 6.4.8 Deloitte Consulting LLP
- 6.4.9 Capgemini SE
- 6.4.10 HCL Technologies Ltd.
- 6.4.11 CGI Inc.
- 6.4.12 DXC Technology Co.
- 6.4.13 Booz Allen Hamilton Inc.
- 6.4.14 Leidos Holdings Inc.
- 6.4.15 Atos SE
- 6.4.16 EPAM Systems Inc.
- 6.4.17 NTT DATA Services
- 6.4.18 Kyndryl Holdings Inc.
- 6.4.19 LTI Mindtree Ltd.
- 6.4.20 Tech Mahindra Ltd.
- 6.4.21 Slalom LLC
- 6.4.22 Perficient Inc.
- 6.4.23 ThoughtWorks Inc.
- 6.4.24 Persistent Systems Ltd.
7 MARKET OPPORTUNITIES AND FUTURE OUTLOOK
- 7.1 White-space and Unmet-Need Assessment
