


|
시장보고서
상품코드
1940799
냉각기 : 시장 점유율 분석, 업계 동향과 통계, 성장 예측(2026-2031년)Chiller - Market Share Analysis, Industry Trends & Statistics, Growth Forecasts (2026 - 2031) |
||||||
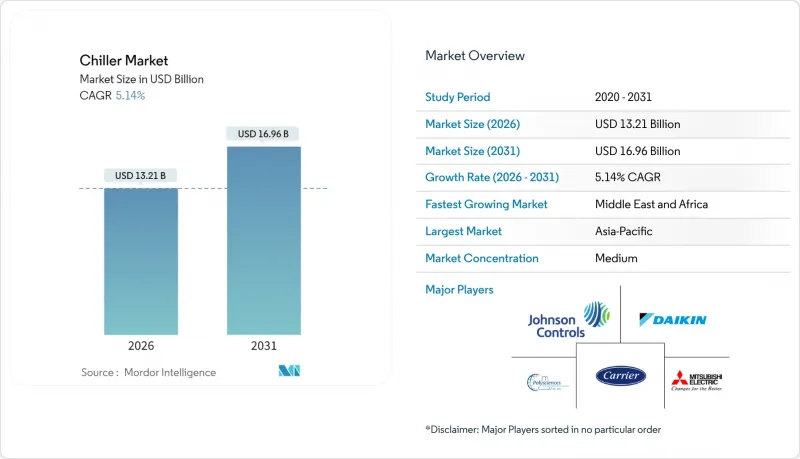
2026년 냉각기 시장 규모는 132억 1,000만 달러로 추정되며, 2025년 125억 6,000만 달러에서 성장을 계속하고 있습니다.
2031년까지 예측은 169억 6,000만 달러에 달할 것으로 예상되며, 2026-2031년 연평균 복합 성장률(CAGR) 5.14%를 나타낼 것으로 예측됩니다.

데이터센터 사업자, 식품 가공업체, 제조업체들이 정밀한 온도 제어, 에너지 효율성, 규제 준수를 추구함에 따라 수요가 꾸준히 증가하고 있습니다. 급속한 디지털화, 특히 랙당 100kW 이상의 워크로드가 증가함에 따라 열 관리는 기존의 공랭식 시스템에서 액체 냉각 지원 플랫폼으로 전환되고 있습니다. 이와 함께 정책 주도의 HFC 단계적 감축으로 저 GWP(지구온난화지수) 기술 도입이 가속화되는 한편, 구리 가격 변동과 기술자 부족이 설비투자 결정에 영향을 미치고 있습니다. 아시아태평양이 계속해서 물량 성장의 주축이 되었지만, 중동 및 아프리카은 인프라 계획과 혹독한 기후 조건으로 인해 냉각 수요가 증가하면서 가장 빠른 성장세를 보였습니다. 기술적 차별화(가변속 압축기, AI 분석, 절수 설계)는 공급업체 경쟁력의 핵심이며, 냉각기 시장 전체에 대한 지속적인 투자를 뒷받침하고 있습니다.
세계 냉각기 시장 동향 및 인사이트
데이터센터의 정밀 냉각에 대한 수요 증가
차세대 하이퍼스케일 및 코로케이션 시설에 100kW 이상의 랙이 도입되면서 기존의 공랭식 냉각 시스템은 열적 한계에 도달했습니다. 마이크로소프트는 시설당 연간 1억 2,500만 리터의 물을 절약할 수 있는 완전 무수 냉각 컨셉을 시연하여 열 성능과 병행하는 수자원 관리의 중요성을 보여주었습니다. 제조업체는 턴키 방식의 액체 대응 냉각기, 원격 모니터링 패키지, 설정점 편차 1℃ 이하를 보장하는 이중화 설계로 대응하고 있습니다. 프리미엄 서비스 계약에는 예측 유지보수가 포함되어 있어, 계산 처리의 밀리초 단위의 수익화가 요구되는 AI 워크로드의 가동 시간을 확보할 수 있습니다. 이러한 추세는 냉각장치 시장에서 고수익 성장 분야의 기반이 되고 있습니다.
상업용 빌딩의 HVAC 냉각기 도입 확대
전기화 의무화로 인해 소유주들은 노후화된 가스식 유닛을 ASHRAE 90.1 기준치 대비 최대 50%까지 에너지를 절감할 수 있는 가변속 저GWP 냉각기로 교체하는 움직임이 가속화되고 있습니다. 2026년까지 신규 상업용 시스템에 저 GWP 냉매 사용을 의무화하는 미국 규정으로 인해 교체 주기가 앞당겨져 첨단 냉각기 주문이 증가했습니다. 미쓰비시전기는 켄튀르키예주 압축기 공장에 1억 4,350만 달러를 투자하여 지속적인 지역 수요에 대한 확신을 보여주었습니다. 건물주들은 고효율 냉각기를 변동하는 유틸리티 비용에 대한 헤지 수단으로 간주하여 초기 비용이 상승하더라도 투자 회수 기간을 단축할 수 있습니다. 이러한 요인들이 결합되어 대상 냉각기 시장이 확대되고 있습니다.
높은 초기 자본 지출
AI 분석과 저 GWP 냉매를 통합한 고급형 냉각기는 기존 모델보다 15-20% 더 비싸기 때문에 가격에 민감한 구매자에게는 투자 회수 기간이 길어집니다. 구리 가격이 파운드당 4.88달러 이상으로 급등하면서 열교환기 비용이 상승하여 OEM의 수익률이 압박을 받고 있습니다. 신흥 시장 수입업체들은 환율 하락에 직면하여 착륙 가격을 더욱 상승시켰습니다. 그 결과, 많은 시설 관리자들이 갱신을 미루면서 냉각기 시장의 단기적인 확장은 억제되었습니다.
부문 분석
2025년, 수냉식 유닛은 냉각기 시장 점유율의 55.80%를 차지했습니다. 물의 우수한 열용량을 활용하여 500톤 이상의 부하를 효율적으로 처리하기 위함입니다. 기존 냉각탑과 저수 시스템을 갖춘 자본집약적 시설의 경우, 수십 년의 수명주기 동안 운영비용을 최소화할 수 있습니다. 그러나 개조 프로젝트에서 설치 속도와 인프라 절감에 우선순위를 두면서 공랭식 시스템은 CAGR 8.62%로 성장했습니다.
각 제조업체들은 부분 부하 효율을 개선하는 마이크로채널 커패시터와 가변속 팬을 통해 기존의 성능 차이를 줄였습니다. 물 부족 지역인 중동 및 아프리카, 미국 남서부 일부 지역에서는 소비량을 줄이고 규제 위험을 피하기 위해 공냉식을 채택했습니다. 하이퍼스케일 공급업체들의 제로 수냉식 시험 도입은 장기적으로 수요를 공랭식으로 전환하는 전략적 전환을 시사하며, 냉각기 시장의 재편을 촉진하고 있습니다.
스크류 압축기는 광범위한 용량 대응과 부하 추종성의 신뢰성으로 인해 2025년 냉각기 시장의 37.95%를 차지했습니다. 화학 및 플라스틱 산업과 중규모 상업시설에서 주력 장비로 자리매김하고 있습니다. 한편, 원심식 모델은 자기 베어링과 오일 프리 설계로 유지보수 비용 절감과 동급 최고의 전체 부하 효율로 인해 CAGR 7.28%로 성장했습니다.
두 구조 모두 가변 속도 구동 장치가 표준으로 장착되어 에너지 비용을 최대 30%까지 절감할 수 있습니다. 스크롤 유닛은 소규모 상업용 건물에서 지지를 유지하고 있으며, 왕복동 기계는 틈새 정밀 응용 분야에 대응하고 있습니다. 흡수식 냉각기는 폐열원을 이용한 열 구동 냉각이 효과적인 분야에서 일정한 점유율을 유지하고 있습니다. 이를 통해 공급업체의 제품 라인업은 냉각기 시장의 전 영역을 아우르는 다중 압축기 기술로 확장되었습니다.
냉각기 시장은 배열방식(수냉식, 공냉식), 압축기 유형(스크류식, 스크롤식, 왕복동식 등), 용량 범위(50KW 미만, 50-350KW, 350-700KW, 700-1200KW, 1200KW 이상), 냉매 유형(HFC, HFO 등), 최종사용자 산업(화학, 석유화학, 식음료 등), 지역(북미, 남미, 유럽, 중동, 아시아태평양, 일본, 중국, 유럽, 인도, 일본, 중국, 한국 등)으로 분류됩니다. 화학 및 석유화학, 식음료 등), 지역(북미, 남미, 유럽, 아시아태평양, 중동 및 아프리카)으로 구분됩니다.
지역별 분석
아시아태평양은 2025년 냉각기 시장의 42.05%를 차지할 것으로 예상되며, 중국의 전자제품 조립 라인, 인도의 제약 기지 확장, 동남아시아의 위탁생산이 견인할 것으로 예측됩니다. 다이킨과 같은 지역 공급업체들은 부품 조달을 현지화하여 리드타임을 단축하고 비용을 절감하고 있습니다. '메이크 인 인디아'와 같은 정부 캠페인은 제조업 GDP 점유율 25%를 목표로 하고 있으며, 다년간의 냉각 수요를 뒷받침하고 있습니다.
중동 및 아프리카은 2031년까지 9.05%의 가장 빠른 CAGR을 기록했습니다. 이는 가혹한 기후 조건과 NEOM, 루사일과 같은 메가 프로젝트가 대규모 HVAC(냉난방공조) 시스템 및 지역 냉난방 시스템을 필요로 했기 때문입니다. 물 부족이 공냉식 채택을 촉진하는 한편, 석유 및 가스 처리 플랜트에서는 사막 환경에 대응하는 내식성 냉각기가 도입되었습니다. CVC와 Tabreed의 UAE 지역 냉방 사업 인수 등 사모펀드 거래는 이 지역의 높은 수익성을 뒷받침하고 있습니다.
북미와 유럽은 데이터센터, 바이오테크놀러지, 레트로 커미셔닝 기회에 집중하며 기술 리더로서의 지위를 유지했습니다. 캐리어의 2025년 1분기 매출 급증은 한 자릿수의 낮은 수량 성장에도 불구하고, 고부가가치 용도에 따른 성장 여지를 보여줍니다. 유럽의 프레온 규제 로드맵은 신규 냉매의 도입을 가속화했지만, 거시경제의 침체가 물량 확대를 억제했습니다. 라틴아메리카에서는 산업단지 및 냉장창고에 대한 투자가 열 인프라의 전문화를 점진적으로 추진하여 냉각기 시장의 세계 확대에 기여하는 등 새로운 성장 기회를 발견할 수 있었습니다.
기타 특전:
- 엑셀 형식 시장 예측(ME) 시트
- 애널리스트의 3개월간 지원
자주 묻는 질문
목차
제1장 서론
제2장 조사 방법
제3장 주요 요약
제4장 시장 구도
제5장 시장 규모와 성장 예측
제6장 경쟁 구도
제7장 시장 기회와 향후 전망
LSH 26.03.10The chillers market size in 2026 is estimated at USD 13.21 billion, growing from 2025 value of USD 12.56 billion with 2031 projections showing USD 16.96 billion, growing at 5.14% CAGR over 2026-2031.
Demand has remained resilient as data-center operators, food processors, and manufacturers pursue precise temperature control, energy efficiency, and regulatory compliance. Rapid digitization, especially workloads exceeding 100 kW per rack, has moved thermal management beyond conventional air systems toward liquid-ready platforms. In parallel, policy-driven HFC phase-downs are accelerating low-GWP adoption, while volatile copper prices and technician shortages influence capital decisions. Asia-Pacific continued to anchor volume growth, but the Middle East and Africa delivered the fastest gains as infrastructure programs and extreme climates intensified cooling needs. Technology differentiation-variable-speed compressors, AI analytics, and water-saving designs-remains central to supplier competitiveness, underpinning sustained investment across the chillers market.
Global Chiller Market Trends and Insights
Rising demand for precision cooling in data centres
Next-generation hyperscale and colocation sites deployed racks that exceeded 100 kW, pushing legacy air systems to their thermal limits. Microsoft validated fully water-free cooling concepts that conserve 125 million liters per facility annually, highlighting water stewardship alongside thermal performance. Manufacturers responded with turnkey liquid-ready chillers, remote monitoring packages, and redundant designs that guarantee sub-1 °C set-point deviation. Premium service contracts now bundle predictive maintenance, ensuring uptime for AI workloads that monetize every millisecond of compute. These dynamics underpin a high-margin growth pocket within the chillers market.
Growing adoption of HVAC chillers in commercial buildings
Electrification mandates drove owners to swap aging gas units for variable-speed, low-GWP chillers that cut energy use up to 50% versus ASHRAE 90.1 baselines. U.S. regulations requiring low-GWP refrigerants in new commercial systems by 2026 triggered an early replacement cycle, lifting order books for advanced chillers. Mitsubishi Electric committed USD 143.5 million to a Kentucky compressor plant, signalling confidence in sustained regional demand. Building owners viewed higher-efficiency chillers as a hedge against volatile utility prices, accelerating payback even as upfront costs rose. These factors collectively widen the addressable chiller market.
High initial capital expenditure
Advanced chillers that integrate AI analytics and low-GWP refrigerants cost 15-20% more than legacy units, prolonging payback for price-sensitive buyers. Recent spikes in copper above USD 4.88 per lb raised heat-exchanger costs and pressured OEM margins. Emerging-market importers faced currency devaluation, further inflating landed prices. Consequently, many facility managers deferred replacements, tempering short-term expansion in the chillers market.
Other drivers and restraints analyzed in the detailed report include:
- Increasing consumption of processed food and beverages
- Rapid industrialization in emerging economies
- Stricter environmental regulations on HFCs
For complete list of drivers and restraints, kindly check the Table Of Contents.
Segment Analysis
Water-cooled units controlled 55.80% of the chillers market share in 2025, leveraging water's superior heat capacity to serve loads above 500 tons efficiently. Capital-intensive facilities with existing cooling towers and retained water systems to minimize operating costs over multi-decade lifecycles. Nevertheless, air-cooled systems advanced at 8.62% CAGR as retrofit projects prioritized installation speed and reduced infrastructure.
Manufacturers narrowed historical performance gaps through micro-channel condensers and variable-speed fans that improve part-load efficiency. Water-scarce regions, Middle East, Africa, parts of the U.S. Southwest, favored air-cooled adoption to cut consumption and regulatory risk. Hyperscale providers piloted zero-water cooling, underscoring a strategic pivot that could redirect long-term demand toward air variants, reshaping the chillers market.
Screw compressors captured 37.95% of the chillers market in 2025 thanks to broad capacity coverage and load-following reliability. They remained the workhorse for chemical, plastics, and medium-sized commercial installations. Centrifugal models, however, expanded at 7.28% CAGR as magnetic bearings and oil-free designs cut maintenance and delivered best-in-class full-load efficiency.
Variable-speed drives became standard across both architectures, slicing energy bills up to 30%. Scroll units retained traction in small commercial buildings, while reciprocating machines addressed niche precision applications. Absorption chillers held a modest share where waste-heat sources justified thermally driven cooling. Supplier portfolios thus spanned multiple compressor technologies to service the full spectrum of the chillers market.
Chillers Market is Segmented by Heat Rejection Method (Water-Cooled, and Air-Cooled), Compressor Type (Screw, Scroll, Reciprocating, and More), Capacity Range (<50 KW, 50-350 KW, 350-700 KW, 700-1200 KW, and >1200 KW), Refrigerant Type (HFC, HFO, and More), End-User Industry (Chemicals and Petrochemicals, Food and Beverage, and More), and Geography (North America, South America, Europe, Asia-Pacific, and Middle East and Africa).
Geography Analysis
Asia-Pacific held 42.05% of the chillers market in 2025, driven by China's electronics assembly lines, India's expanding pharma hubs, and Southeast Asian contract manufacturing. Regional suppliers such as Daikin are localizing component sourcing, shortening lead times, and cutting costs. Government campaigns like "Make in India" targeted a 25% manufacturing GDP share, anchoring multi-year cooling demand.
Middle East and Africa posted the quickest 9.05% CAGR through 2031 as extreme climates and mega-projects, NEOM, Lusail, required large-scale HVAC and district systems. Water scarcity spurred air-cooled adoption, while oil-and-gas processing plants ordered corrosion-resistant chillers for desert duty. Private-equity deals, like CVC and Tabreed's UAE district cooling acquisition, underscored the region's attractive returns.
North America and Europe remained technology leaders, focusing on data-center, biotech, and retro-commissioning opportunities. Carrier's Q1 2025 sales jump illustrated upside tied to high-value applications despite low single-digit unit growth. Europe's F-gas roadmap accelerated novel refrigerant uptake, though macroeconomic softness tempered volume expansion. Latin America offered emerging upside where industrial parks and cold-storage investments slowly professionalized thermal infrastructure, extending the global reach of the chillers market.
- Carrier Global Corporation
- Mitsubishi Electric Corporation
- Daikin Industries, Ltd.
- Trane Technologies plc
- Johnson Controls International plc
- LG Electronics Inc.
- GEA Group Aktiengesellschaft
- Danfoss A/S
- Climaveneta S.p.A.
- Thermax Limited
- Smardt Chiller Group Inc.
- Dimplex Thermal Solutions
- Polyscience Inc.
- Shuangliang Eco-Energy Systems Co., Ltd.
- Hitachi, Ltd.
- Midea Group Co., Ltd.
- Haier Smart Home Co., Ltd.
- Baltimore Aircoil Company, Inc.
- ENGIE Refrigeration GmbH
- Bosch Thermotechnology Ltd.
- Dunham-Bush Holding Bhd.
- Hisense HVAC Equipment Co., Ltd.
- Arctic Chiller Group Ltd.
- KKT Kraus GmbH
- Frigel Firenze S.p.A.
Additional Benefits:
- The market estimate (ME) sheet in Excel format
- 3 months of analyst support
TABLE OF CONTENTS
1 INTRODUCTION
- 1.1 Study Assumptions and Market Definition
- 1.2 Scope of the Study
2 RESEARCH METHODOLOGY
3 EXECUTIVE SUMMARY
4 MARKET LANDSCAPE
- 4.1 Market Overview
- 4.2 Market Drivers
- 4.2.1 Rising demand for precision cooling in data centres
- 4.2.2 Growing adoption of HVAC chillers in commercial buildings
- 4.2.3 Increasing consumption of processed food and beverages
- 4.2.4 Rapid industrialisation in emerging economies
- 4.2.5 Uptake of low-GWP refrigerant chillers (CBAM effect)
- 4.2.6 AI-based predictive maintenance improves ROI
- 4.3 Market Restraints
- 4.3.1 High initial capital expenditure
- 4.3.2 Stricter environmental regulation on HFCs
- 4.3.3 Volatile copper prices raising heat-exchanger costs
- 4.3.4 Shortage of skilled chiller service technicians
- 4.4 Value Chain Analysis
- 4.5 Regulatory Landscape
- 4.6 Technological Outlook
- 4.7 Porter's Five Forces Analysis
- 4.7.1 Bargaining Power of Suppliers
- 4.7.2 Bargaining Power of Buyers
- 4.7.3 Threat of New Entrants
- 4.7.4 Threat of Substitutes
- 4.7.5 Intensity of Competitive Rivalry
- 4.8 Impact of Macroeconomic Factors
5 MARKET SIZE AND GROWTH FORECASTS (VALUE)
- 5.1 By Heat Rejection Method (Type of Cooling)
- 5.1.1 Water-Cooled
- 5.1.2 Air-Cooled
- 5.2 By Compressor Type
- 5.2.1 Screw Chillers
- 5.2.2 Scroll Chillers
- 5.2.3 Reciprocating Chillers
- 5.2.4 Centrifugal Chillers
- 5.2.5 Absorption Chillers
- 5.3 By Capacity Range
- 5.3.1 < 50 kW
- 5.3.2 50 - 350 kW
- 5.3.3 350 - 700 kW
- 5.3.4 700 - 1 200 kW
- 5.3.5 > 1 200 kW
- 5.4 By Refrigerant Type
- 5.4.1 Hydrofluorocarbon (HFC)
- 5.4.2 Hydrofluoro-olefin (HFO)
- 5.4.3 Natural (CO2, NH3, Propane)
- 5.4.4 Hydrochlorofluorocarbon (HCFC - phase-out)
- 5.4.5 Water-based / Magnetic-bearing
- 5.5 By End-User Industry
- 5.5.1 Chemicals and Petrochemicals
- 5.5.2 Food and Beverage
- 5.5.3 Medical and Pharmaceutical
- 5.5.4 Plastics and Rubber
- 5.5.5 Data Centres and IT
- 5.5.6 Commercial Buildings
- 5.5.7 Others
- 5.6 By Geography
- 5.6.1 North America
- 5.6.1.1 United States
- 5.6.1.2 Canada
- 5.6.1.3 Mexico
- 5.6.2 South America
- 5.6.2.1 Brazil
- 5.6.2.2 Argentina
- 5.6.2.3 Rest of South America
- 5.6.3 Europe
- 5.6.3.1 Germany
- 5.6.3.2 United Kingdom
- 5.6.3.3 France
- 5.6.3.4 Italy
- 5.6.3.5 Spain
- 5.6.3.6 Russia
- 5.6.3.7 Rest of Europe
- 5.6.4 Asia-Pacific
- 5.6.4.1 China
- 5.6.4.2 Japan
- 5.6.4.3 India
- 5.6.4.4 South Korea
- 5.6.4.5 Southeast Asia
- 5.6.4.6 Rest of Asia-Pacific
- 5.6.5 Middle East and Africa
- 5.6.5.1 Middle East
- 5.6.5.1.1 Saudi Arabia
- 5.6.5.1.2 United Arab Emirates
- 5.6.5.1.3 Turkey
- 5.6.5.1.4 Rest of Middle East
- 5.6.5.2 Africa
- 5.6.5.2.1 South Africa
- 5.6.5.2.2 Nigeria
- 5.6.5.2.3 Egypt
- 5.6.5.2.4 Rest of Africa
- 5.6.5.1 Middle East
- 5.6.1 North America
6 COMPETITIVE LANDSCAPE
- 6.1 Market Concentration
- 6.2 Strategic Moves
- 6.3 Market Share Analysis
- 6.4 Company Profiles (includes Global Level Overview, Market Level Overview, Core Segments, Financials as available, Strategic Information, Market Rank/Share, Products and Services, Recent Developments)
- 6.4.1 Carrier Global Corporation
- 6.4.2 Mitsubishi Electric Corporation
- 6.4.3 Daikin Industries, Ltd.
- 6.4.4 Trane Technologies plc
- 6.4.5 Johnson Controls International plc
- 6.4.6 LG Electronics Inc.
- 6.4.7 GEA Group Aktiengesellschaft
- 6.4.8 Danfoss A/S
- 6.4.9 Climaveneta S.p.A.
- 6.4.10 Thermax Limited
- 6.4.11 Smardt Chiller Group Inc.
- 6.4.12 Dimplex Thermal Solutions
- 6.4.13 Polyscience Inc.
- 6.4.14 Shuangliang Eco-Energy Systems Co., Ltd.
- 6.4.15 Hitachi, Ltd.
- 6.4.16 Midea Group Co., Ltd.
- 6.4.17 Haier Smart Home Co., Ltd.
- 6.4.18 Baltimore Aircoil Company, Inc.
- 6.4.19 ENGIE Refrigeration GmbH
- 6.4.20 Bosch Thermotechnology Ltd.
- 6.4.21 Dunham-Bush Holding Bhd.
- 6.4.22 Hisense HVAC Equipment Co., Ltd.
- 6.4.23 Arctic Chiller Group Ltd.
- 6.4.24 KKT Kraus GmbH
- 6.4.25 Frigel Firenze S.p.A.
7 MARKET OPPORTUNITIES AND FUTURE OUTLOOK
- 7.1 White-space and Unmet-Need Assessment
