
|
시장보고서
상품코드
1940855
교육 보안 : 시장 점유율 분석, 업계 동향과 통계, 성장 예측(2026-2031년)Education Security - Market Share Analysis, Industry Trends & Statistics, Growth Forecasts (2026 - 2031) |
||||||
교육 보안 시장은 2025년 9억 8,000만 달러에서 2026년에는 11억 달러로 성장하고, 2026-2031년 CAGR 11.78%로 성장을 지속하여, 2031년까지 19억 1,000만 달러에 이를 것으로 예측됩니다.

연방정부의 2억 달러 규모의 'K-12 교육 사이버 보안법' 보조금 등 예산 배분 증가로 인해 학교는 중요한 인프라 시설로 자리매김하고 있습니다. 2022년부터 2024년까지 캠퍼스 대상 사이버 공격이 156% 급증한 것에서 알 수 있듯이, 물리적 위협과 디지털 위협의 융합이 진행되면서 통합 보호 솔루션에 대한 수요가 증가하고 있습니다. 인공지능(AI)을 활용한 영상 분석 기술은 의심스러운 행동을 3-5초 이내에 감지할 수 있어 사고 대응 시간을 단축하고 학군 전체에 도입 가속화를 촉진하고 있습니다. 교육 보안 시장에서는 북미가 37.31%의 매출 점유율로 1위를 차지하고 있으며, 아시아태평양은 수십억 달러 규모의 스마트 캠퍼스 계획에 힘입어 13.8%의 연평균 복합 성장률(CAGR)로 가장 빠른 성장세를 보이고 있습니다. 경쟁의 격렬함은 중간 정도에 머물러 있습니다. 이는 전 세계 복합기업과 클라우드 네이티브 전문 기업들이 엄격한 학생 데이터 규제에 맞추어 보안 제공을 맞추기 위해 경쟁하고 있기 때문입니다.
세계 교육 보안 시장 동향 및 인사이트
위협을 조기에 감지하기 위한 AI 기반 행동 감지 기술
첨단 컴퓨터 비전 모델을 통해 보안은 반응형에서 예측형으로 전환되고 있습니다. 2024년 500개 학군에 도입된 Verkada 시스템은 AI를 통한 요주의 인물 알림 후 대응 속도가 67% 향상되었고, 이상 징후 감지 정확도 94%를 달성했습니다. 캘리포니아의 한 학군에서는 도입 후 사건 발생률이 43% 감소했다고 보고하여, 이 기술이 왕따 및 무기 관련 사건 감소에 효과가 있음을 입증했습니다. 현재는 오감지를 억제하기 위해 장소, 시간대, 과거 위험 이력을 고려한 문맥 분석을 통해 오감지를 억제하고 있습니다. 다만, 알고리즘이 안정화되기 위해서는 6-12개월 분량의 기준 영상을 수집해야 하며, 대규모 엣지 컴퓨팅 투자가 필요합니다. AI와 컴플라이언스 대시보드를 통합한 벤더는 FERPA 준수를 쉽게 도입할 수 있도록 함으로써 교육 보안 시장에서 우위를 점하고 있습니다.
정부 안전 보조금으로 기술 업데이트 주기 가속화
2024년 이후 12억 달러가 넘는 'STOP School Violence' 보조금을 통해 소규모 학군에서도 구식 아날로그 시스템을 우회하여 클라우드 네이티브 플랫폼을 도입할 수 있게 되었습니다. 텍사스는 학교 보안에 3억 달러, 플로리다의 가디언 프로그램은 연간 1억 5,000만 달러의 예산을 배정하여 턴키 솔루션에 유리한 동기화 된 업데이트 주기를 생성하고 있습니다. 보조금 지표는 측정 가능한 성과를 요구하기 때문에 벤더들은 인시던트 분석 대시보드를 표준으로 제공합니다. 다년간의 지원 의무 조항은 시스템 유지보수를 보장하는 동시에 공급자의 수익을 안정적으로 보장합니다. 자금이 ESG 기반 안전 KPI와 연동되는 경향이 강화되는 가운데, 학군에서는 보안 이벤트를 감사 가능한 사회적 영향력 점수로 변환하는 플랫폼을 우선적으로 채택하고 있습니다.
초기 조달 비용과 라이프사이클 비용 상승
캠퍼스 전체 도입 비용은 평균 15만-50만 달러, 연간 서비스 요금은 자본 지출의 최대 25%를 차지하여 한정된 지구 예산에 부담을 줍니다. 특수한 설치 공사는 비용이 30-40% 증가하며, 진화하는 위협에 대응하기 위해 3-5년마다 대규모 시스템 업데이트가 필수적입니다. 보조금 제도에서는 소프트웨어 라이선스나 클라우드 스토리지의 갱신 비용이 제외되는 경우가 많아, 일부 학군에서는 고도화된 시스템을 폴백 모드로 운영할 수밖에 없는 상황입니다. 성과 연동형 가격 책정 및 모듈형 업그레이드를 제공하는 벤더는 교육 보안 업계 전반의 예산 마찰을 줄이고 총소유비용(TCO) 지표를 개선하는 데 기여하고 있습니다.
부문 분석
보안 서비스는 2025년 매출의 41.12%를 차지할 것으로 예상되며, 자동화의 급속한 발전에도 불구하고 교육 보안 시장의 기반이 되고 있습니다. 경비원은 규제 요건을 충족하고 이해관계자의 안정감을 높입니다. AI 분석 기반 경보 모니터링 서비스는 13.72%의 연평균 복합 성장률(CAGR)로 전체 서비스를 앞질렀습니다. 유인 순찰과 드론 영상, 모바일 대시보드를 결합한 하이브리드 보안 모델이 기존의 역할을 변화시키고 있습니다. 실시간 지령 센터에 보조금을 투입하는 학군이 증가하면서 시스템 통합 및 관리 서비스 계약에 대한 수요가 증가하고 있습니다.
교육 보안 시장에서는 교육기관이 벤더 포트폴리오를 통합함에 따라 시스템 통합 서비스 규모가 확대될 것으로 예측됩니다. 채용 전 전형은 엄격해지는 인사 심사 규정 속에서 회복세를 보이고 있습니다. 컨설팅 업무는 사이버 보안 감사 및 ESG 기반의 안전 보고로 진화하고 있습니다. 서비스 스위트를 번들로 제공하는 벤더들은 조달 프로세스의 복잡성을 줄임으로써 시장 평균보다 높은 성장을 달성하고 있습니다.
2025년 기준 교육용 보안 시장 점유율의 52.15%를 하드웨어가 차지하고 있으며, 이는 카메라 및 출입통제장치의 일괄 도입이 주도하고 있습니다. 그러나 소프트웨어 분야의 CAGR 13.05%는 분석 중심의 클라우드 관리형 아키텍처로의 전환을 뒷받침합니다. 엣지 지원 카메라는 AI를 디바이스에 직접 탑재하여 구성 요소의 경계를 모호하게 하고, 데이터센터 설치 면적을 줄일 수 있습니다. 비디오 관리 플랫폼의 구독 가격 설정은 자본 지출을 예측 가능한 운영 지출로 전환합니다.
서비스는 전체 매출의 약 4분의 1을 차지하며, 학군이 유지보수, 펌웨어 업데이트, 위협 감시를 외부에 위탁하는 경향이 강해지고 있습니다. 벤더들이 전용 하드웨어에서 기능을 분리하고 무선 업데이트를 통한 기능 업그레이드를 추진함에 따라, 교육용 보안 시장의 소프트웨어 규모는 계속 확대될 것입니다.
지역별 분석
북미는 2025년 교육 보안 시장 매출의 36.85%를 차지할 것으로 예상되며, 미국에서는 14억 달러의 연방 보조금으로 인해 기술 업데이트 주기가 가속화될 것으로 예측됩니다. 캐나다 주 정부도 비슷한 추세를 보이고 있으며, 온타리오 주에서는 1억 8,000만 캐나다 달러 규모의 프로그램을 통해 영상 감시 시스템과 출입 통제 시스템을 업데이트하고 있습니다. 멕시코는 현대화 추진책의 일환으로 공립학교 안전기술에 8,900만 달러를 배정하고, 지역 공급업체 파이프라인을 확장하고 있습니다.
아시아태평양은 2031년까지 13.63%의 가장 높은 CAGR을 나타낼 것으로 예측됩니다. 중국은 780억 달러 규모의 교육 개혁에서 통합 보안에 최대 15%를 할당하여 대규모 조달을 가속화하고 있습니다. 인도의 스마트 캠퍼스 투자액은 120억 달러를 넘어섰고, 동남아시아 국가의 교육부는 디지털 학습 도입에 안전 솔루션을 통합하고 있습니다. 세계 카메라 대기업의 현지 생산은 납기 단축과 국내 조달 요건 충족을 실현하고, 교육용 보안 시장에서의 경쟁 심화를 촉진하고 있습니다.
유럽에서는 GDPR(EU 개인정보보호규정) 대응이 꾸준히 진행되고 있습니다. 독일은 디지털 학교에 28억 유로, 영국은 프라이버시 바이 디자인 기술로 강화된 인프라에 6억 5,000만 파운드를 각각 투입하고 있습니다. 중동 및 아프리카은 총 지출액에서는 뒤쳐져 있지만, 고성장 지역이 존재합니다. 아랍에미리트의 스마트 스쿨 프로젝트와 사우디아라비아의 '비전 2030' 교육 분야는 클라우드 지원 및 다국어 지원 보안 제품군에 대한 수요를 자극하고 있습니다. 서로 다른 데이터 거주 규칙을 능숙하게 운영할 수 있는 공급업체는 해당 지역에서의 사업 확장에 성공할 가능성이 높습니다.
기타 특전:
- 엑셀 형식 시장 예측(ME) 시트
- 애널리스트 지원(3개월)
자주 묻는 질문
목차
제1장 서론
제2장 조사 방법
제3장 주요 요약
제4장 시장 구도
제5장 시장 규모와 성장 예측
제6장 경쟁 구도
제7장 시장 기회와 향후 전망
LSH 26.03.11The education security market is expected to grow from USD 0.98 billion in 2025 to USD 1.1 billion in 2026 and is forecast to reach USD 1.91 billion by 2031 at 11.78% CAGR over 2026-2031.
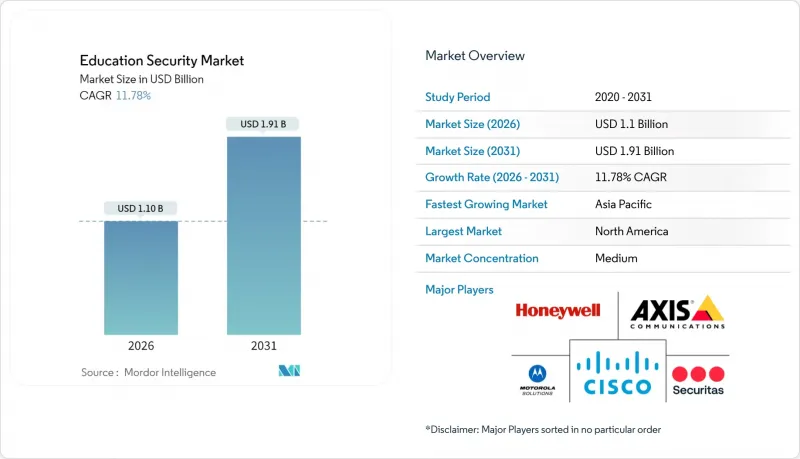
Rising federal allocations, such as the USD 200 million K-12 Education Cybersecurity Act grant, have positioned schools as critical-infrastructure sites. Converging physical and digital threats, underscored by a 156% jump in campus cyberattacks between 2022 and 2024, sharpen demand for integrated protection. Artificial-intelligence video analytics now detect suspicious behavior within 3-5 seconds, shortening incident response times and bolstering adoption momentum across districts. North America leads the education security market with a 37.31% revenue share, while the Asia-Pacific region records the fastest growth at a 13.8% CAGR, driven by multi-billion-dollar smart campus programs. Competitive intensity remains moderate as global conglomerates and cloud-native specialists vie to align security offerings with strict student-data regulations.
Global Education Security Market Trends and Insights
AI-Enabled Behavioural Detection for Early Threat Identification
Advanced computer vision models are increasingly shifting security from a reactive to a predictive mode. Verkada rollouts across 500 districts in 2024 demonstrated 67% faster responses after AI person-of-interest alerts, achieving 94% accuracy in anomaly detection. Districts in California reported a 43% decline in incidents following the deployment, highlighting the technology's effectiveness in reducing bullying and weapons-related events. Contextual analytics now factor in location, time of day, and historical risk to curb false positives. However, campuses must capture 6-12 months of baseline footage before algorithms stabilize, requiring sizable edge-compute investments. Vendors that bundle AI with compliance dashboards gain an edge in the education security market by easing FERPA-aligned rollouts.
Government Safety Grants Accelerating Technology Refresh Cycles
Since 2024, STOP School Violence grants exceeding USD 1.2 billion have enabled smaller districts to bypass legacy analog systems and adopt cloud-native platforms. Texas earmarked USD 300 million for school security, and Florida's Guardian Program injects USD 150 million annually, creating synchronized refresh cycles that favor turnkey solutions. Grant metrics demand measurable outcomes, prompting vendors to ship incident analytics dashboards as standard. Mandatory multi-year support clauses stabilize provider revenue while ensuring system upkeep. As funds increasingly link to ESG-based safety KPIs, districts prioritize platforms that convert security events into auditable social-impact scores.
High Upfront Procurement and Lifecycle Costs
Complete campus installations average USD 150,000-500,000, with annual service fees consuming up to 25% of capital outlays, straining tight district budgets. Specialized installations raise costs by 30-40%, and major system refreshes are required every 3-5 years to counter evolving threats. Grant schemes rarely cover software licensing or cloud-storage renewals, prompting some districts to run sophisticated systems in fallback modes. Vendors offering outcome-based pricing and modular upgrades mitigate budget friction and improve total cost-of-ownership metrics across the education security industry.
Other drivers and restraints analyzed in the detailed report include:
- Heightened Incidence of School Violence and Vandalism
- Infrastructure Modernisation Programs in Emerging Economies
- Persistent Privacy and Data-Protection Concerns
For complete list of drivers and restraints, kindly check the Table Of Contents.
Segment Analysis
Guarding services generated 41.12% of 2025 revenue, anchoring the education security market despite the rapid advancement of automation. Visible officers fulfill regulatory mandates and boost stakeholder reassurance. Alarm-monitoring services, fueled by AI analytics, outpace all services at 13.72% CAGR. Hybrid guard models that combine human patrols with drone feeds and mobile dashboards are reshaping traditional roles. Districts allocating grant funds toward real-time command centers elevate demand for systems integration and managed service contracts.
The education security market size for systems integration services is set to expand as institutions consolidate their vendor portfolios. Pre-employment screening rebounds amid stricter personnel vetting rules. Consulting engagements evolve into cybersecurity audits and ESG-based safety reporting. Vendors offering bundled service suites achieve above-market growth by lowering procurement complexity.
Hardware accounted for 52.15% of the education security market share in 2025, driven by the rollout of bulk cameras and access controls. Yet software's 13.05% CAGR underscores the shift toward analytics-driven, cloud-managed architectures. Edge-enabled cameras blur component lines by embedding AI directly on devices, shrinking data-center footprints. Subscription pricing for video-management platforms converts capital expenditure into predictable operating outlays.
Services accounted for nearly one-quarter of total revenue as districts increasingly outsourced maintenance, firmware updates, and threat monitoring. The education security market size for software will continue expanding as vendors decouple functionality from proprietary hardware and push feature upgrades via over-the-air updates.
The Education Security Market Report is Segmented by Services (Guarding, Pre-Employment Screening, and More), Component (Hardware, Software, and Services), Security Solution (Video Surveillance Systems, Access Control Systems, and More), Deployment Mode (On-Premise, Cloud, and Hybrid), Facilities (Primary and Secondary Facilities, and More), and Geography. The Market Forecasts are Provided in Terms of Value (USD).
Geography Analysis
North America accounted for 36.85% of the education security market revenue in 2025, led by the United States' USD 1.4 billion in combined federal grants that catalyzed rapid technology refresh cycles. Canadian provinces echo this trend, with Ontario's CAD 180 million program upgrading video surveillance and access-control stacks. Mexico's modernization drive earmarks USD 89 million for public-school safety technology, broadening regional supplier pipelines.
Asia-Pacific posts the most aggressive 13.63% CAGR through 2031. China's USD 78 billion education overhaul allocates up to 15% for integrated security, fast-tracking large-scale procurements. India's smart-campus investments surpass USD 12 billion, and Southeast Asian ministries bundle safety solutions within digital-learning rollouts. Local manufacturing by global camera giants shortens delivery cycles and satisfies domestic-content mandates, heightening competitive churn within the education security market.
Europe advances steadily on GDPR context compliance. Germany commits EUR 2.8 billion to digital schools, and the United Kingdom channels GBP 650 million toward infrastructure fortified by privacy-by-design tools. The Middle East and Africa trail in aggregate spending yet exhibit pockets of high growth-UAE smart-school projects and Saudi Arabia's Vision 2030 education pillar stimulate demand for cloud-ready, multi-lingual security suites. Suppliers adept at navigating divergent data-residency rules are more likely to succeed in scaling across these regions.
- Cisco Systems Inc.
- Honeywell International Inc.
- Motorola Solutions Inc.
- Securitas AB
- Axis Communications AB
- Genetec Inc.
- Verkada Inc.
- Hangzhou Hikvision Digital Technology Co. Ltd.
- Johnson Controls International plc
- Robert Bosch GmbH
- ADT Inc.
- Allied Universal Topco LLC
- Prosegur Compania de Seguridad S.A.
- Hanwha Vision Co., Ltd.
- Zhejiang Dahua Technology Co. Ltd.
- Gallagher Group Limited
- Silverseal Corporation
- SEICO Inc.
- Kisi Inc.
- AxxonSoft LLC
- Eagle Eye Networks Inc.
Additional Benefits:
- The market estimate (ME) sheet in Excel format
- 3 months of analyst support
TABLE OF CONTENTS
1 INTRODUCTION
- 1.1 Study Assumptions and Market Definition
- 1.2 Scope of the Study
2 RESEARCH METHODOLOGY
3 EXECUTIVE SUMMARY
4 MARKET LANDSCAPE
- 4.1 Market Overview
- 4.2 Market Drivers
- 4.2.1 Surging demand for real-time video analytics on campuses
- 4.2.2 Heightened incidence of school violence and vandalism
- 4.2.3 Government safety grants accelerating technology refresh cycles
- 4.2.4 Infrastructure modernisation programs in emerging economies
- 4.2.5 AI-enabled behavioural detection for early threat identification
- 4.2.6 ESG-linked safety KPIs guiding funding decisions
- 4.3 Market Restraints
- 4.3.1 High upfront procurement and lifecycle costs
- 4.3.2 Persistent privacy and data-protection concerns
- 4.3.3 Disjointed physical-cybersecurity architectures
- 4.3.4 Shortage of skilled campus security personnel
- 4.4 Impact of Macroeconomic Factors
- 4.5 Industry Value Chain Analysis
- 4.6 Regulatory Landscape
- 4.7 Technological Outlook
- 4.8 Porter's Five Forces Analysis
- 4.8.1 Bargaining Power of Suppliers
- 4.8.2 Bargaining Power of Buyers
- 4.8.3 Threat of New Entrants
- 4.8.4 Threat of Substitutes
- 4.8.5 Intensity of Competitive Rivalry
5 MARKET SIZE AND GROWTH FORECASTS (VALUE)
- 5.1 By Services
- 5.1.1 Guarding
- 5.1.2 Pre-Employment Screening
- 5.1.3 Security Consulting
- 5.1.4 Systems Integration and Management
- 5.1.5 Alarm Monitoring Services
- 5.1.6 Other Private Security Services
- 5.2 By Component
- 5.2.1 Hardware
- 5.2.2 Software
- 5.2.3 Services
- 5.3 By Security Solution
- 5.3.1 Video Surveillance Systems
- 5.3.2 Access Control Systems
- 5.3.3 Emergency Communication Systems
- 5.3.4 Cybersecurity Solutions
- 5.4 By Deployment Mode
- 5.4.1 On-Premise
- 5.4.2 Cloud
- 5.4.3 Hybrid
- 5.5 By Facilities
- 5.5.1 Primary and Secondary Facilities
- 5.5.2 Higher Education Facilities
- 5.5.3 Other Educational Facilities
- 5.6 By Geography
- 5.6.1 North America
- 5.6.1.1 United States
- 5.6.1.2 Canada
- 5.6.1.3 Mexico
- 5.6.2 South America
- 5.6.2.1 Brazil
- 5.6.2.2 Argentina
- 5.6.2.3 Rest of South America
- 5.6.3 Europe
- 5.6.3.1 Germany
- 5.6.3.2 United Kingdom
- 5.6.3.3 France
- 5.6.3.4 Italy
- 5.6.3.5 Spain
- 5.6.3.6 Rest of Europe
- 5.6.4 Asia Pacific
- 5.6.4.1 China
- 5.6.4.2 Japan
- 5.6.4.3 India
- 5.6.4.4 South Korea
- 5.6.4.5 South-East Asia
- 5.6.4.6 Rest of Asia Pacific
- 5.6.5 Middle East
- 5.6.5.1 Saudi Arabia
- 5.6.5.2 United Arab Emirates
- 5.6.5.3 Turkey
- 5.6.5.4 Rest of Middle East
- 5.6.6 Africa
- 5.6.6.1 South Africa
- 5.6.6.2 Nigeria
- 5.6.6.3 Rest of Africa
- 5.6.1 North America
6 COMPETITIVE LANDSCAPE
- 6.1 Market Concentration
- 6.2 Strategic Moves
- 6.3 Market Share Analysis
- 6.4 Company Profiles (includes Global level Overview, Market level overview, Core Segments, Financials as available, Strategic Information, Market Rank/Share for key companies, Products and Services, and Recent Developments)
- 6.4.1 Cisco Systems Inc.
- 6.4.2 Honeywell International Inc.
- 6.4.3 Motorola Solutions Inc.
- 6.4.4 Securitas AB
- 6.4.5 Axis Communications AB
- 6.4.6 Genetec Inc.
- 6.4.7 Verkada Inc.
- 6.4.8 Hangzhou Hikvision Digital Technology Co. Ltd.
- 6.4.9 Johnson Controls International plc
- 6.4.10 Robert Bosch GmbH
- 6.4.11 ADT Inc.
- 6.4.12 Allied Universal Topco LLC
- 6.4.13 Prosegur Compania de Seguridad S.A.
- 6.4.14 Hanwha Vision Co., Ltd.
- 6.4.15 Zhejiang Dahua Technology Co. Ltd.
- 6.4.16 Gallagher Group Limited
- 6.4.17 Silverseal Corporation
- 6.4.18 SEICO Inc.
- 6.4.19 Kisi Inc.
- 6.4.20 AxxonSoft LLC
- 6.4.21 Eagle Eye Networks Inc.
7 MARKET OPPORTUNITIES AND FUTURE OUTLOOK
- 7.1 White-space and Unmet-need Assessment
