|
시장보고서
상품코드
2035070
농약 시장 : 점유율 분석, 업계 동향 및 통계, 성장 예측(2026-2031년)Agrochemicals - Market Share Analysis, Industry Trends & Statistics, Growth Forecasts (2026 - 2031) |
||||||
 Mordor Intelligence
농약 시장 규모는 2026년에 3,170억 달러로 추정되고 있어 2031년까지 4,124억 달러에 이를 것으로 예측됩니다.
이는 CAGR 5.40%에 해당합니다.
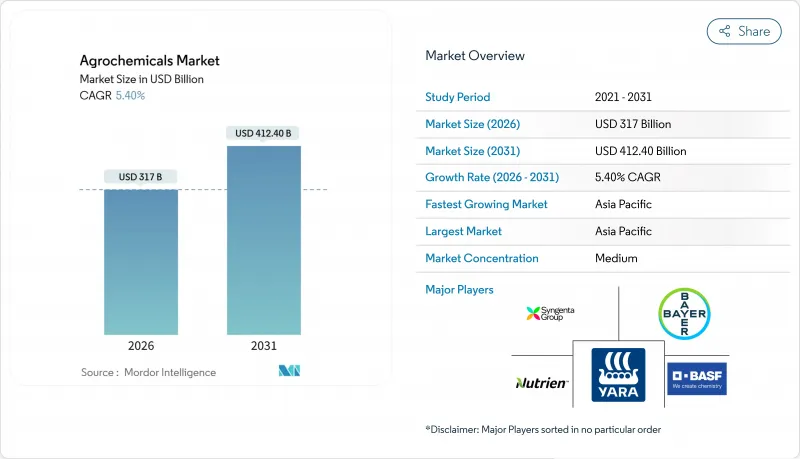
이러한 성장은 판매량 증가뿐만 아니라 저항성 잡초에 대응하는 프리미엄 제초제로의 전환과 고독성 화학물질의 단계적 퇴출을 위한 규제 조치에 힘입은 바 큽니다. 이러한 추세에 따라 서방형 비료와 첨단 작물 보호 솔루션에 대한 투자가 증가하고 있습니다. Nutrien의 탄소 연계 질소 프로그램이나 Yara의 그린 암모니아 프로젝트와 같은 노력은 제품의 성능과 지속가능성을 동시에 충족시키는 것이 점점 더 중요해지고 있음을 보여줍니다. 또한, 탄소 가격 책정, 농약세, 잔류 기준 강화 등의 요인으로 인해 제품 파이프라인이 재편되고 있으며, 검증된 배출권을 획득할 수 있는 피복 비료가 우위를 점하고 있습니다. 그러나 소송 리스크와 재등록 비용으로 인해 제품 포트폴리오가 축소되고 진입장벽이 높아지는 반면, 컴플라이언스 비용을 효과적으로 관리할 수 있는 다각화 기업에게는 유리하게 작용하고 있습니다.
세계 농약 시장 동향과 인사이트
제초제 내성 잡초 발생 증가로 프리미엄 제초제 수요 증가
현재 팔마 아마란스의 확산은 미국 31개 주에 걸쳐 있으며, 글리포세이트 내성 라이그라스는 호주에서 200만 헥타르 이상에 퍼져 있습니다. 생산자들은 제네릭 글리포세이트에서 40-60%의 가격 상승이 예상되는 프리미엄 그룹 15 및 그룹 27 화학물질로 전환하고 있습니다. 작물 재배 면적이 정체되어 있음에도 불구하고, 처리 헥타르당 수익은 증가하고 있으며, 한 시즌에 여러 작용 기작을 순환시키는 제품 포트폴리오가 성과를 거두고 있습니다. 2025년 미국 대두 재배 면적의 35%를 차지한 Corteva의 Enlist E3 대두와 같은 형질 및 제초제 번들 제품은 통합 솔루션이 어떻게 지속적인 판매를 보장하고 내성 진화를 억제할 수 있는지를 보여줍니다. 규제 당국은 순환 재배 및 피난 작물 재배를 공식적으로 규정하는 관리 규정을 강화하고 있으며, 이로 인해 여러 작용기전을 가진 화학 물질에 대한 접근에 대한 요구가 증가하고 있습니다. 따라서 생산자는 종합적인 내성 관리 프로그램을 제공할 수 있는 공급업체를 선호합니다.
정밀농업과 데이터 구독 모델, 전 세계적으로 확대되고 있습니다.
'Input-as-a-Service(서비스로서의 농자재)' 계약은 일회성 자재 구매를 지속적인 수익과 데이터 루프로 전환합니다. 코르테바의 'Granular' 플랫폼은 2025년 6,000만 에이커의 농지를 관리하고, 야라의 'Atfarm'은 유럽에서 120만 헥타르의 농지를 지도하여 질소 낭비를 12% 줄이고, 톤당 25유로(톤당 27달러)에 거래되는 탄소배출권을 창출했습니다. 인도와 인도네시아에서 스마트폰의 보급으로 소규모 농가에도 유사한 서비스가 확대되고 있으며, 텔레매틱스 기술을 통해 바이엘의 'Climate FieldView'가 전 세계 400만 개의 농장에 도입되고 있습니다. 처방 데이터 관리를 통해 기존 기업은 종자, 비료, 작물보호제 조합을 주도할 수 있게 되었으며, 플랫폼은 유효성분 파이프라인과 동등한 중요성을 가지며 수익의 중심이 되고 있습니다.
유럽연합(EU), 브라질, 중국에서 고독성 유효성분 단계적 폐지 가속화
2027년까지 네오니코티노이드 및 유기인계 농약 12종을 추가로 폐지하겠다는 유럽연합(EU)의 제안, 파라콰트를 '매우 독성이 강한' 농약으로 재분류한 브라질의 조치, 41개 농약 활성 성분을 금지한 중국의 조치로 인해 등록업체들의 제품 포트폴리오가 축소되고 있습니다. 포트폴리오 교체는 대체 분자의 유효 특허 기간을 단축하고, 기업은 수익을 보호하기 위해 제품 출시를 가속화하거나 바이오 농약으로 전환해야 합니다. 재제형화 자금을 조달할 수 없는 중소 제제업체들은 시장에서 철수하고 있으며, 컴플라이언스 비용을 분산시킬 수 있는 다각화를 추진한 기존 업체들 사이에 시장 지배력이 더욱 집중되고 있습니다.
부문 분석
2025년 농약 시장에서 비료가 매출의 75%를 차지하며 시장을 독점했습니다. 질소계 비료인 요소, 질산암모늄, 요소-질산암모늄(UAN) 용액은 아시아태평양과 북미의 곡물 생산에 여전히 필수적인 요소입니다. 반면, 식물 성장 조절제는 과일 및 채소의 개화시기를 조절하고 저장기간을 연장하는 용도로 사용되며 CAGR 13.0%로 가장 빠른 성장세를 기록할 것으로 예측됩니다. 제초제는 농약 시장에서 큰 비중을 차지하고 있으며, 잔류물 제로를 의무화하는 엄격한 규제가 있는 지역에서는 제품 포트폴리오가 재편되고 있습니다. 보조제는 점유율은 작지만 살포량을 최대 25%까지 줄일 수 있고, 유효성을 유지하면서 규제 압력을 완화할 수 있어 매우 큰 전략적 가치를 창출하고 있습니다. 코테바 애그리사이언스의 지베렐린계 조절제 'ProGibb'는 기존 비료 지출을 넘어 수확량 향상 분자에 대한 수요 증가를 반영하여 2025년 큰 폭의 매출을 기록했습니다. 비료 분야의 농약 시장 규모는 꾸준히 확대될 것으로 예상되며, 그 성장의 중심에는 고수익성 성장 조절제 및 지속가능성에 부합하는 기타 제품들이 자리 잡을 것으로 예측됩니다.
독성 활성 성분의 단계적 폐지, 코팅 제제에 대한 선호도가 높아짐에 따라 기업은 비료와 작물 보호 솔루션을 통합할 수 있게 되었습니다. 영양 효율성과 병해충 방제를 함께 제공하는 기업은 동일한 경작지 내에서 교차판매를 할 수 있고, 판매 채널 파트너와의 관계를 강화하여 시장 점유율을 높일 수 있습니다. 이러한 추세로 인해 농약 기업들은 범용 비료의 수급 주기 변동에도 불구하고 수익성을 유지할 수 있게 되었습니다. 또한, 제3자 인증을 통해 환경성능을 입증한 기업들은 가격 프리미엄을 확보하고 있으며, 이는 장기적으로 물량 위주의 경쟁에서 벗어나고 있음을 보여줍니다.
지역별 분석
아시아태평양은 2025년 농약 시장 점유율의 53%를 차지하고, 2031년까지 연평균 6.6%의 성장률을 보일 것으로 전망됩니다. 기초 수요를 뒷받침하는 주요 요인으로는 농업 생산성을 유지하면서 비료 사용량을 안정화하기 위한 중국의 '비료 사용량 제로 성장' 정책, 농부들에게 저렴한 가격을 보장하고 수요를 유지하기 위한 인도의 우레아 보조금 프로그램 등을 들 수 있습니다. 또한, 일본의 정밀 농업 플랫폼은 탄소 화폐화(carbon monetization) 노력이 고품질 농자재 도입을 촉진하고 이 지역 시장 성장을 더욱 촉진할 수 있다는 것을 보여줍니다. 이러한 추세에 따라 아시아태평양은 세계 농약 시장에서 중요한 견인차 역할을 하고 있습니다.
아프리카에서는 소규모 농가의 수확량 향상을 위해 디지털 자문 서비스 도입이 진행되고 있으며, 기존 농자재 접근성 제한, 기후 변화 등의 과제에 대응하기 위해 디지털 자문 서비스를 도입하고 있습니다. 이집트와 남아공은 잘 정비된 관개 인프라와 고부가가치 작물 생산을 뒷받침하는 수출 지향적 원예 농업에 중점을 두고 있어 주요 시장으로 부상하고 있습니다. 한편, 남미 시장의 성장은 주로 브라질의 대두와 옥수수 재배 면적 확대에 의해 주도되고 있습니다. 이는 유리한 기후 조건과 정부 정책에 힘입은 바 큽니다. 또한, 아르헨티나의 수출 지향적인 농업 관행도 성장 요인으로 작용하고 있으며, 아르헨티나는 세계 시장에서의 경쟁력을 중요시하고 있습니다.
북미의 경우, 시장 성장은 경작지 성숙과 소송의 영향과 같은 과제를 반영하고 있지만, 데이터 플랫폼과 탄소 프로그램의 발전은 농약 제조업체에게 새로운 서비스 수익 기회를 창출하고 있습니다. 유럽 시장 성장은 지역 중 가장 둔화되고 있으며, '팜 투 포크' 정책에 따른 농약 감축 목표가 걸림돌로 작용하고 있습니다. 그러나 이 지역은 '탄소국경조정메커니즘(CBAM)'과 같은 규제 이니셔티브에 힘입어 저탄소 비료 도입에 있어 선도적인 역할을 하고 있습니다. 중동에서는 저가의 천연가스 자원을 활용하여 수출용 암모니아를 생산하고 있으며, 블루암모니아 및 그린암모니아 생산 경로를 적극적으로 모색하고 있습니다. 이러한 지역적 추세는 아시아태평양이 절대적인 매출에서 우위를 점하고 있는 반면, 아프리카와 남미에도 큰 성장 기회가 있으며, 이는 농약 시장 확대 전략을 형성하고 있음을 보여줍니다.
기타 특전:
- 엑셀 형식 시장 예측(ME) 시트
- 3개월간 애널리스트 지원
자주 묻는 질문
목차
제1장 서론
제2장 조사 방법
제3장 주요 요약
제4장 시장 구도
제5장 시장 규모와 성장 예측
제6장 경쟁 구도
제7장 시장 기회와 향후 전망
JHS 26.05.20The agrochemicals market size is estimated to be USD 317.00 billion in 2026 and is forecast to reach USD 412.40 billion by 2031, reflecting a 5.40% CAGR.
This growth is driven not only by volume increases but also by a shift toward premium herbicides that address resistant weeds and regulatory measures phasing out high-toxicity chemicals. These trends are steering investments toward controlled-release fertilizers and advanced crop protection solutions. Initiatives such as Nutrien's carbon-aligned nitrogen program and Yara's green ammonia projects underscore the rising importance of combining product performance with sustainability compliance. Additionally, factors like carbon pricing, pesticide taxes, and stricter residue limits are reshaping product pipelines, favoring coated fertilizers that enable verified emission credits. However, litigation risks and re-registration costs are narrowing product portfolios, increasing entry barriers, and benefiting diversified companies capable of managing compliance costs effectively.
Global Agrochemicals Market Trends and Insights
Rising Incidence of Herbicide-Resistant Weeds Fuels Demand for Premium Herbicides
Palmer amaranth infestations now span 31 United States states, and glyphosate-resistant ryegrass covers more than 2 million hectares in Australia. Growers are substituting generic glyphosate with premium Group 15 and Group 27 chemistries, commanding 40-60% price uplifts. Revenue per treated hectare is rising even as acreage stays flat, rewarding portfolios that rotate multiple modes of action within a season. Trait-herbicide bundles such as Corteva's Enlist E3 soybean, which reached 35% of U.S. soybean acres in 2025, illustrate how integrated solutions secure recurring sales and temper resistance evolution. Regulators are tightening stewardship rules that formalize rotation and refuge planting, increasing demand for multi-site chemistry access. Growers, therefore, prioritize suppliers able to deliver complete resistance-management programs.
Precision Agriculture and Data Subscription Models Scale Globally
Input-as-a-Service contracts convert one-time input purchases into recurring revenue and data loops. Corteva's Granular platform guided 60 million acres in 2025, while Yara's Atfarm advised 1.2 million hectares in Europe, cutting nitrogen waste by 12% and spawning carbon credits priced at EUR 25 per metric ton (USD 27 per metric ton). Smartphone penetration in India and Indonesia is extending similar services to smallholders, and telematics are embedding Bayer's Climate FieldView across 4 million farms worldwide. Control of prescription data lets incumbents steer seed, fertilizer, and crop-protection mix, positioning platforms as profit centers equal in importance to active-ingredient pipelines.
Accelerating Phase-Outs of High-Toxicity Actives in the European Union, Brazil, and China
European Union proposals to retire 12 additional neonics and organophosphates by 2027, Brazil's reclassification of paraquat as "extremely toxic," and China's ban on 41 pesticide actives are shrinking registrant portfolios. Portfolio churn shortens effective patent lives for replacement molecules, forcing companies to accelerate product launches or pivot into biologicals to protect revenue. Smaller formulators, unable to fund reformulation, are exiting segments, further concentrating market power among diversified incumbents that can spread compliance costs.
Other drivers and restraints analyzed in the detailed report include:
- Controlled-Release and Inhibitor-Coated Fertilizers Gain Mainstream Adoption
- Carbon-Credit Monetization of Nitrogen-Efficiency Products
- Volatile Glyphosate Pricing Squeezes Formulator Margins
For complete list of drivers and restraints, kindly check the Table Of Contents.
Segment Analysis
Fertilizers dominated the agrochemicals market in 2025, holding 75% of revenue. Nitrogenous grades urea, ammonium nitrate, and Urea Ammonium Nitrate (UAN) solutions remain indispensable in cereal production across Asia-Pacific and North America. In contrast, plant growth regulators are forecast to post the fastest expansion at 13.0% CAGR, propelled by applications that synchronize flowering and extend shelf life in fruits and vegetables. Herbicides constitute a significant portion of pesticide value, reshaping product portfolios in regions with stringent zero-residue mandates. Adjuvants, though a small share, generate outsize strategic value because they reduce spray rates by up to 25%, preserving efficacy while easing regulatory pressure. Corteva Agriscience's ProGibb, a gibberellin-based regulator, recorded significant revenue in 2025, reflecting increasing demand for yield-enhancement molecules beyond traditional fertilizer expenditures. The agrochemicals market size for fertilizers is projected to grow steadily, with discretionary growth likely to center on high-margin regulators and other products that align with sustainability initiatives.
The ongoing phase-out of toxic active ingredients and the increasing preference for coated formulations enable companies to integrate fertilizer and crop protection solutions. Firms offering nutrient efficiency alongside pest control can cross-sell within the same acreage, strengthening relationships with channel partners and capturing additional market share. These trends allow agrochemical companies to maintain profitability despite fluctuations in commodity fertilizer cycles. Additionally, companies that validate environmental performance through third-party protocols are securing pricing premiums, indicating a long-term shift away from volume-based competition.
The Agrochemicals Market Report is Segmented by Product Type (Fertilizers, Pesticides, and More), by Crop Type (Grains and Cereals, Pulses and Oilseeds, Fruits and Vegetables, and Commercial Crops, and More), and by Geography (North America, Europe, Asia-Pacific, South America, and More). The Market Forecasts are Provided in Terms of Value (USD).
Geography Analysis
Asia-Pacific accounted for 53% of the agrochemicals market share in 2025 and is projected to grow at a CAGR of 6.6% through 2031. Key factors supporting baseline demand include China's zero-growth fertilizer mandate, which aims to stabilize fertilizer usage while maintaining agricultural productivity, and India's subsidized urea program, which ensures affordability for farmers and sustains demand. Additionally, Japan's precision agriculture platforms demonstrate how carbon monetization initiatives can incentivize the adoption of premium agricultural inputs, further driving market growth in the region. These developments position Asia-Pacific as a critical driver of the global agrochemicals market.
In Africa, digital advisory services are increasingly being adopted to enhance yields among smallholder farmers, addressing challenges such as restricted access to traditional inputs and climate variability. Egypt and South Africa stand out as anchor markets due to their well-developed irrigation infrastructure and focus on export-oriented horticulture, which supports higher-value crop production. Meanwhile, South America's market growth is primarily driven by Brazil's expanding soybean and corn acreage, supported by favorable climatic conditions and government policies, and Argentina's export-oriented agricultural practices, which emphasize competitiveness in global markets.
In North America, market growth reflects the challenges of mature acreage and the impact of litigation, yet advancements in data platforms and carbon programs are creating new service revenue opportunities for agrochemical companies. Europe's market growth is the slowest among regions, hindered by the Farm to Fork pesticide-reduction targets. However, the region is becoming a leader in adopting low-carbon fertilizers, supported by regulatory initiatives like the Carbon Border Adjustment Mechanism (CBAM). The Middle East is capitalizing on its low-cost natural gas resources to produce ammonia for export while actively exploring blue and green ammonia production pathways. These regional trends highlight that while Asia-Pacific dominates in absolute sales, Africa and South America offer significant growth opportunities, shaping expansion strategies in the agrochemicals market.
- Syngenta Group
- Bayer AG
- BASF SE
- Corteva Agriscience
- Nutrien Ltd.
- Yara International ASA
- Mosaic Company
- CF Industries Holdings Inc.
- UPL Ltd.
- FMC Corporation
- Sumitomo Chemical Co., Ltd.
- Nufarm Ltd.
- K+S Aktiengesellschaft
- ICL Group
- OCP Group
Additional Benefits:
- The market estimate (ME) sheet in Excel format
- 3 months of analyst support
TABLE OF CONTENTS
1 Introduction
- 1.1 Study Assumptions and Market Definition
- 1.2 Scope of the Study
2 Research Methodology
3 Executive Summary
4 Market Landscape
- 4.1 Market Overview
- 4.2 Market Drivers
- 4.2.1 Rising Incidence of Herbicide-Resistant Weeds Fuels Demand for Premium Herbicides
- 4.2.2 Precision Agriculture and Data Subscription Models Scale Globally
- 4.2.3 Major Pesticide Patent Cliff (2024-2028) Fuels Low-Cost Generic Uptake
- 4.2.4 Carbon-credit Monetization of Nitrogen-Efficiency Products
- 4.2.5 Controlled-release and Inhibitor-Coated Fertilizers Gain Mainstream Adoption
- 4.2.6 European Union Carbon Border Adjustment Mechanism (CBAM) and Similar Carbon Policies Accelerate Low-Carbon Ammonia Uptake
- 4.3 Market Restraints
- 4.3.1 Accelerating Phase-outs of High-toxicity Actives in the European Union, Brazil, and China
- 4.3.2 Volatile Glyphosate Pricing Squeezes Formulator Margins
- 4.3.3 Rising Regulatory Data-package and Re-registration Costs
- 4.3.4 Chronic Activist Litigation Risk in North America
- 4.4 Regulatory Landscape
- 4.5 Technological Outlook
- 4.6 Porter's Five Forces Analysis
- 4.6.1 Bargaining Power of Suppliers
- 4.6.2 Bargaining Power of Buyers
- 4.6.3 Threat of New Entrants
- 4.6.4 Threat of Substitutes
- 4.6.5 Intensity of Competitive Rivalry
5 Market Size and Growth Forecasts (Value)
- 5.1 By Product Type
- 5.1.1 Fertilizers
- 5.1.1.1 Nitrogenous
- 5.1.1.2 Phosphatic
- 5.1.1.3 Potassic
- 5.1.1.4 Other Fertilizers
- 5.1.2 Pesticides
- 5.1.2.1 Herbicides
- 5.1.2.2 Insecticides
- 5.1.2.3 Fungicides
- 5.1.2.4 Other Pesticides
- 5.1.3 Adjuvants
- 5.1.4 Plant Growth Regulators
- 5.1.1 Fertilizers
- 5.2 By Crop Type
- 5.2.1 Grains and Cereals
- 5.2.2 Pulses and Oilseeds
- 5.2.3 Fruits and Vegetables
- 5.2.4 Commercial Crops
- 5.2.5 Turf and Ornamental
- 5.3 By Geography
- 5.3.1 North America
- 5.3.1.1 United States
- 5.3.1.2 Canada
- 5.3.1.3 Mexico
- 5.3.1.4 Rest of North America
- 5.3.2 Europe
- 5.3.2.1 Germany
- 5.3.2.2 France
- 5.3.2.3 United Kingdom
- 5.3.2.4 Italy
- 5.3.2.5 Spain
- 5.3.2.6 Russia
- 5.3.2.7 Rest of Europe
- 5.3.3 Asia-Pacific
- 5.3.3.1 China
- 5.3.3.2 India
- 5.3.3.3 Japan
- 5.3.3.4 Australia
- 5.3.3.5 Rest of Asia-Pacific
- 5.3.4 South America
- 5.3.4.1 Brazil
- 5.3.4.2 Argentina
- 5.3.4.3 Rest of South America
- 5.3.5 Middle East
- 5.3.5.1 Saudi Arabia
- 5.3.5.2 United Arab Emirates
- 5.3.5.3 Rest of Middle East
- 5.3.6 Africa
- 5.3.6.1 South Africa
- 5.3.6.2 Egypt
- 5.3.6.3 Rest of Africa
- 5.3.1 North America
6 Competitive Landscape
- 6.1 Market Concentration
- 6.2 Strategic Moves
- 6.3 Market Share Analysis
- 6.4 Company Profiles (Includes Global Level Overview, Market Level Overview, Core Segments, Financials as Available, Strategic Information, Market Rank/Share for Key Companies, Products and Services, and Recent Developments)
- 6.4.1 Syngenta Group
- 6.4.2 Bayer AG
- 6.4.3 BASF SE
- 6.4.4 Corteva Agriscience
- 6.4.5 Nutrien Ltd.
- 6.4.6 Yara International ASA
- 6.4.7 Mosaic Company
- 6.4.8 CF Industries Holdings Inc.
- 6.4.9 UPL Ltd.
- 6.4.10 FMC Corporation
- 6.4.11 Sumitomo Chemical Co., Ltd.
- 6.4.12 Nufarm Ltd.
- 6.4.13 K+S Aktiengesellschaft
- 6.4.14 ICL Group
- 6.4.15 OCP Group