|
시장보고서
상품코드
2035098
폐기물 관리 시장 : 점유율 분석, 업계 동향 및 통계, 성장 예측(2026-2031년)Waste Management - Market Share Analysis, Industry Trends & Statistics, Growth Forecasts (2026 - 2031) |
||||||
 Mordor Intelligence
폐기물 관리 시장 규모는 2026년에 1조 5,200억 달러로 추계되고 있으며 예측 기간(2026-2031년)에 CAGR 6.58%로 성장을 지속하여, 2031년까지 2조 900억 달러에 이를 전망입니다.
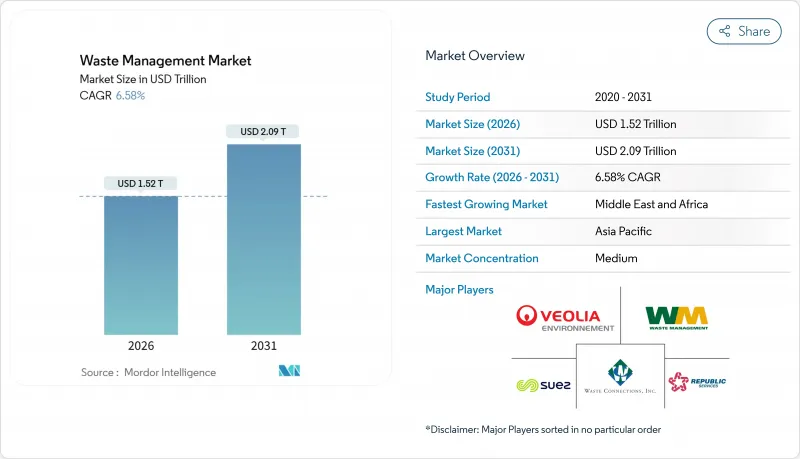
폐기물 처리 중심의 사업 운영에서 자원회수로의 전환이 진행되고 있다는 점이 이 시장 규모와 성장 궤적을 뒷받침하고 있습니다. 유럽연합(EU)과 미국 일부 주에서 시행되고 있는 재활용률 의무화, 아시아태평양의 확대된 생산자책임재활용(EPR) 의무화, 기업의 과학기반목표(Science-Based Targets)와 연계된 Scope 3 폐기물 보고는 고도의 선별, 화학적 재활용, 폐기물 발전 인프라에 대한 자본 유입을 촉진하고 있습니다. 매립처리 서비스는 여전히 수익의 주축이지만, 재활용 및 자원회수 사업이 연 6.80%의 성장률을 기록함에 따라 사업자들은 사업 전환을 추진하고 있습니다. 이는 자원회수시설에서 순도 99%의 순도를 실현하는 인공지능(AI) 탑재 로봇기술이 뒷받침하고 있습니다. 아시아태평양이 여전히 수익의 중심지이지만, 중동 및 아프리카는 폐기물 발전 프로젝트에 대한 정부 펀드의 자금 지원으로 인해 지역별로 가장 높은 CAGR(CAGR: 9.1%)을 기록했습니다. 대형 에너지 기업과 디지털 선별 스타트업들이 기존 사업자들에게 수집, 처리, 재생가능 연료 생산의 통합 서비스를 제공하도록 압력을 가하면서 경쟁 압력은 더욱 거세지고 있습니다.
세계 폐기물 관리 시장 동향 및 인사이트
플라스틱 포장재에 대한 재생재 함량 의무화 법(EU, 미국)
유럽연합(EU)의 '포장 및 포장 폐기물 규정(2025/40)'과 캘리포니아주의 '상원 법안 54'와 같은 법규에 따라 브랜드 소유자는 모든 1차 포장에 일정 비율의 소비 후 수지를 포함시켜야 하며, 이를 통해 기계적 및 화학적 재활용 재활용 업체와의 다년간의 인수 계약을 촉진하고 있습니다. 이러한 법규는 품질 기준을 강화하여 광학 선별 라인의 업그레이드와 식품 등급의 제품을 생산할 수 있는 탈중합 장비에 대한 투자를 촉진하고 있습니다. 국제에너지기구(IEA)의 추산에 따르면, 회수 시스템이 따라잡는 것을 전제로 법적 목표를 달성하면 2030년까지 연간 1,500만 톤의 플라스틱이 매립처분을 피할 수 있다고 합니다. ISO 9001 및 ISO 14001 인증을 획득한 대형 재활용 업체들은 컴플라이언스 비용을 흡수하고 있지만, 추적성 도구가 없는 소규모 시설들은 사업 지속에 어려움을 겪고 있습니다. 컴플라이언스 위반에 대한 처벌이 강화되고 있으며, 조달팀은 순도 보증과 장기적인 처리 능력을 제공하는 사업자에 대한 평가를 강화하고 있습니다.
아시아태평양의 섬유 및 전자제품에 대한 EPR 확대
싱가포르, 홍콩, 인도는 2024년부터 2025년까지 EPR(확대된 생산자책임재활용제도)의 틀을 확대하여 폐기물 회수 및 처리 비용을 제품 제조업체에 전가하고 있습니다. 싱가포르에서는 위반 건당 벌금이 7만 4,000달러에 달하며, 인도의 개정 목표에서는 2027년까지 회수율을 70%로 설정하여 분해를 전제로 한 설계에 대한 경제적 인센티브가 강화되고 있습니다. 아시아의 많은 지역에서 공식적인 회수율이 여전히 20%를 밑돌고 있기 때문에 브랜드 소유주들은 규정 준수를 위해 지자체 회수 거점이나 역물류 허브에 공동 출자해야 하는 상황에 처해 있습니다. 이러한 정책으로 민간 자본이 전자제품 해체센터와 고처리 능력의 섬유 슈레더에 유입되어 포장 분야를 넘어 수익원이 확대되고 있습니다. 업계 분석가들은 매립지 용량이 부족하고 비공식 재활용이 규제 당국의 감시 대상이 되면서 더 많은 관할 구역에서 EPR 제도를 도입할 것으로 예상하고 있습니다.
높은 금리로 인해 재활용 플랜트 PPP 자금 조달이 약화됨
세계 금융 긴축으로 2024년 민관협력(PPP) 폐기물 프로젝트가 25% 감소하고, 부채상환비율이 악화되면서 투자액이 68억 달러로 감소했습니다. 남아공의 입찰 중단과 인도네시아의 처리시설 건설 연기는 자본비용의 상승이 스폰서들의 장기 컨세션 계약에 대한 진입을 막고 있는 현실을 보여줍니다. 신용 보완 조치가 없는 지자체는 시설 지연 위험을 피하기 위해 더 높은 게이트 수수료 보증을 제공해야 하며, 그 결과 매립지 수명이 연장되고 폐기물 전환 목표 달성에 지장을 초래할 수 있습니다. 또한, 자금 조달의 어려움은 사업 확장을 위해 프로젝트 파이낸싱에 의존하고 있는 중소 기술 제공업체들에게도 장벽이 될 수 있습니다. 금리가 완화되지 않는 한, 신흥 시장의 많은 재활용 프로젝트는 양허성 금융이나 혼합금융 구조에 의존하게 될 것입니다.
부문 분석
2025년에도 생활 폐기물이 매출의 46.54%를 차지하며 폐기물 관리 시장에서 가장 큰 점유율을 유지했지만, 산업 폐기물의 중요성이 커지고 있습니다. 이 부문의 CAGR이 8.3%로 높은 이유는 2024년 OSHA의 유해물질 정보 전달 기준 개정 등 보다 엄격한 산업 안전 규정을 충족하기 위해 제조업체들이 사업장 내 중화 장치를 설치하고 있기 때문입니다. 현재 많은 공장에서 폐쇄형 물 순환 시스템과 유해 폐기물 전처리를 결합하여 공장 외부 반출량을 줄이고 허가 취득 비용을 절감하고 있습니다. 말레이시아와 베트남의 전자제품 조립업체는 유럽의 수입 감사를 준수하기 위해 2025년 산세척 반응장치를 도입했습니다. 이는 다운스트림의 구매자가 업스트림의 폐기물 처리 방식을 결정하는 한 예입니다. 멕시코의 한 자동차 부품 공급업체는 이소프로판올의 95%를 회수하는 용제 회수 증류 장치를 도입하여 재료비를 절감하고 가연성 폐기물에 대한 추가 비용을 지불하지 않게 되었습니다. 이러한 사례는 컴플라이언스에 대한 투자가 비용 절감과 결합되어 상품 가격이 하락하더라도 해당 부문의 성장을 유지할 수 있다는 것을 보여줍니다.
예측 기간 동안 산업체들은 단순 톤당 요금이 아닌 성과 연동형 조항을 포함한 다년 계약의 '넷 제로 웨이스트' 서비스 계약을 체결할 것으로 예측됩니다. 이 방식은 이미 미국 애리조나 주와 싱가포르의 반도체 팹에서 시범 도입된 바 있습니다. 따라서 ISO 14001 인증을 받은 전문 유해폐기물 처리업체가 실험실 테스트나 매니페스트 추적 소프트웨어가 없는 종합운반업체를 제치고 입찰을 따내고 있습니다. 설비 투자가 증가함에 따라 일부 소규모 전기도금 공장은 인도의 섬유 산업 클러스터에서 채택한 공동 폐수 처리 시설과 마찬가지로 현장 처리 시설을 공유하는 협동조합을 형성하고 있습니다. 폐기물 관리 시장에서는 유화유를 발생지 부두에서 처리하는 모듈식 이동식 분리장치를 도입하여 도로 운송과 그에 따른 책임을 없애려는 움직임이 나타나고 있습니다. 또한, 금융기관이 ESG 대출 계약에 폐기물 관련 지표를 포함시키는 사례가 증가함에 따라, 폐기물 감축 진행 상황을 공개하기를 꺼리는 제조업체는 더 높은 이자율 스프레드를 지불하게 되어, 이 분야에서 인증 획득 벤더의 이용이 더욱 가속화되고 있습니다.
본 '폐기물 관리 시장 보고서'는 발생원별(가정, 상업시설(소매, 사무실 등), 산업시설 등), 서비스 유형별(수거, 운송, 선별/분리, 처리/처리), 폐기물 유형별(일반 폐기물, 전자 폐기물 등), 지역별(북미, 유럽 등)로 분류하여 조사 분석하였습니다. 본 보고서에서는 위의 모든 부문에 대해 시장 규모와 예측(금액: USD)을 제시합니다.
지역별 분석
아시아태평양은 2025년 전 세계 매출의 56%를 차지하며 폐기물 관리 시장 점유율에서 가장 규모가 큰 지역 점유율을 차지하며 처리량 성장을 뒷받침하는 핵심 지역으로 자리매김하고 있습니다. 중국에서 개정된 '고형폐기물법'은 불법 투기에 대해 14만 달러의 벌금을 부과하는 것으로, 늘어나는 도시 지역의 폐기물 처리량에 대응하기 위해 광학 선별기 및 폐기물 발전 보일러에 대한 투자가 가속화되고 있습니다. 인도의 'Swachh Bharat Mission 2.0'은 4,700개 도시에 17억 달러가 할당되어 발생원 분리배출과 퇴비화를 확대하기 위해 사용되었습니다. 한편, 일본 지자체는 섬유제품과 스마트폰 회수 의무화에 힘입어 2030년까지 최종 처리량을 50% 감축하는 것을 공동의 목표로 삼고 있습니다. 싱가포르의 사모펀드는 말레이시아 재활용 기업의 소수 지분을 인수하여 고부가가치 플라스틱을 현지 화학적 탈중합 공장으로 출하하기 전에 집적하는 지역 물류 허브에 기대를 걸고 있습니다. 유럽으로 수출하는 기업들은 베트남과 태국의 라이선싱 사업자가 발행하는 컴플라이언스 준수 회수 인증서에 대한 의존도가 높아지고 있으며, 이는 EU REACH 규제와 현지 허가를 모두 취득한 기업들에게 새로운 수익원이 되고 있습니다.
중동 및 아프리카는 가장 빠르게 성장하는 지역으로, 2031년까지 연평균 복합 성장률(CAGR) 9.1%로 확대될 것으로 예상되며, 국부펀드가 통합 폐기물 처리 시설 건설에 공동 투자하고 있습니다. 사우디아라비아가 Averda와 체결한 18억 달러 규모의 합작투자는 2030년까지 폐기물의 70%를 재활용 및 재사용한다는 정책 목표와 공적 자금이 어떻게 연계되는지 보여주는 좋은 사례입니다. 아랍에미리트(UAE)는 2024년 일회용 플라스틱 사용을 금지하고, 현재 아부다비의 KEZAD 구역에 첨단 자원 회수 시설을 설치하는 사업자에게 수수료 면제 조치를 취하고 있습니다. 이집트는 세계은행의 융자를 활용하여 매립지 셀을 개보수하고, 카이로의 음식물 쓰레기를 처리하여 농업용 개량재를 생산하는 퇴비화 라인을 정비하고 있으며, 이 개량재는 보증된 인수 계약에 따라 판매되고 있습니다. 2024년 시행된 남아공의 확대된 생산자책임재활용(EPR) 규정은 시행 첫 해에 9,000만 달러의 준수 수수료를 발생시켰으며, 이는 서비스 취약 지역의 수거 협동조합에 대한 자금 지원으로 사용되었습니다.
북미와 유럽은 기술적으로 성숙한 곳이지만, 결코 자만하지 않습니다. 캘리포니아와 워싱턴 주에서는 재활용 소재 함유율에 대한 각기 다른 법규를 통과시켰으며, 브랜드 소유주들은 블록체인을 통해 추적이 가능한 미국 내 재활용 업체를 우선으로 하는 10년 계약을 통해 공급을 확보하도록 촉구하고 있습니다. 독일과 네덜란드의 지자체는 사업자가 게이트 요금 할인이 아닌 폐기물 전환율을 입찰하는 경매제도를 도입하여 인센티브를 순환경제의 목표와 일치시키고 있습니다. 브라질, 칠레, 콜롬비아는 공식적인 인프라 구축에 있어서는 뒤쳐져 있지만, 차량 현대화 및 선별시설(MRF) 개보수를 지원하는 지속가능성 연동 채권 발행을 통해 그 격차를 줄여나가고 있습니다. 폐기물 수출을 제한하는 법규가 확대됨에 따라 국경을 넘는 폐기물 이동이 줄어들고 있으며, 이로 인해 지역 자급자족이 강화되고 사업자들은 국내 처리 능력을 최적화해야 하는 상황에 직면해 있습니다.
기타 특전:
- 엑셀 형식 시장 예측(ME) 시트
- 3개월간 애널리스트 지원
자주 묻는 질문
목차
제1장 서론
제2장 분석 방법
제3장 주요 요약
제4장 시장 구도
제5장 시장 규모 및 성장 예측(단위 : 10억 달러)
제6장 경쟁 구도
제7장 시장 기회와 향후 전망
JHS 26.05.20The Waste Management Market size is estimated at USD 1.52 trillion in 2026, and is expected to reach USD 2.09 trillion by 2031, at a CAGR of 6.58% during the forecast period (2026-2031).
The opening shift from disposal-centric operations toward resource recovery underscores this market size and growth trajectory. Mandatory recycled-content laws in the European Union and several U.S. states, broader extended-producer-responsibility (EPR) mandates across Asia-Pacific, and Scope-3 waste reporting tied to corporate science-based targets are accelerating capital flows into advanced sorting, chemical recycling, and waste-to-energy infrastructure. Landfill services still anchor revenue, yet operators are pivoting as recycling and resource-recovery lines attract 6.80% annual growth, supported by artificial-intelligence robotics that deliver 99% purity at material-recovery facilities. Asia-Pacific remains the revenue epicenter, but sovereign-wealth-fund financing of waste-to-energy projects is lifting the Middle East and Africa to the fastest regional CAGR (9.1%). Competitive pressure is intensifying as energy majors and digital-sorting start-ups push incumbents to bundle collection, treatment, and renewable-fuel production within integrated offerings.
Global Waste Management Market Trends and Insights
Mandatory Recycled-Content Laws for Plastic Packaging (EU, US)
Legislation such as the European Union's Packaging and Packaging Waste Regulation 2025/40 and California's Senate Bill 54 compels brand owners to integrate defined shares of post-consumer resin in all primary packaging, driving multi-year offtake contracts with mechanical and chemical recyclers. These statutes tighten quality standards, prompting upgrades in optical-sorter lines and investment in depolymerization units capable of food-grade outputs. The International Energy Agency estimates that meeting statutory targets could divert 15 million metric tons of plastic from landfills annually by 2030, provided collection systems keep pace. Larger recyclers equipped with ISO 9001 and ISO 14001 certifications are absorbing compliance premiums, while smaller facilities lacking traceability tools struggle to remain viable. Penalties for non-compliance escalate, and procurement teams increasingly reward operators offering guaranteed purity and long-term capacity.
EPR Expansion to Textiles & Electronics Across APAC
Singapore, Hong Kong, and India broadened EPR frameworks during 2024-2025, shifting waste-collection and treatment costs upstream to product manufacturers. Penalties now reach USD 74,000 per violation in Singapore, and India's revised targets demand 70% take-back volumes by 2027, sharpening financial incentives for design-for-disassembly. Formal collection remains below 20% in much of Asia, so compliance pushes brand owners to co-fund municipal drop-off points and reverse-logistics hubs. These policies channel private capital into electronics-dismantling centers and high-throughput textile shredders, expanding addressable revenue pools beyond packaging. Industry analysts expect more jurisdictions to replicate EPR schemes as landfill capacity tightens and informal recycling draws regulatory scrutiny.
High Interest Rates Weakening PPP Financing for Recycling Plants
Global monetary tightening pushed public-private partnership (PPP) waste projects down 25% in 2024, with investment falling to USD 6.8 billion as debt-service ratios worsened. Canceled tenders in South Africa and postponed treatment plants in Indonesia illustrate how higher capital costs deter sponsors from long-tenor concessions. Municipalities lacking credit enhancements must now offer higher gate-fee guarantees or risk facility delays, extending landfill lifespans and undermining diversion targets. The financing squeeze also raises barriers for small technology providers that rely on project finance for scale-up. Unless interest rates ease, many emerging-market recycling projects will hinge on concessional or blended-finance structures.
Other drivers and restraints analyzed in the detailed report include:
- Corporate Science-Based Targets Requiring Waste Scope-3 Reporting
- Sustainability-Linked Bonds Financing Waste Infrastructure in Emerging Markets
- Labor Shortages Inflating Collection Wages in OECD Countries
For complete list of drivers and restraints, kindly check the Table Of Contents.
Segment Analysis
Industrial streams are gaining prominence even though residential waste still accounted for 46.54% of revenue in 2025, the largest share within the Waste Management market share landscape. The segment's faster 8.3% CAGR stems from manufacturers installing on-site neutralization units to satisfy stricter occupational-safety rules such as OSHA's 2024 Hazard Communication Standard revision. Many plants now couple closed-loop water systems with hazardous-waste pretreatment, reducing off-site hauling volumes and permitting costs. Electronics assemblers in Malaysia and Vietnam added acid-scrubbing reactors in 2025 to comply with European import audits, illustrating how downstream buyers dictate upstream waste behavior. Automotive suppliers in Mexico deployed solvent-recovery stills that recaptured 95% of isopropanol, cutting material expense and avoiding flammable-waste surcharges. These examples show that compliance investments are lining up with cost avoidance, a combination that sustains segment growth even when commodity prices dip.
Over the forecast horizon, industrial operators will sign multi-year "net-zero waste" service contracts that embed pay-for-performance clauses rather than simple tonnage fees, a structure already piloted by semiconductor fabs in Arizona and Singapore. Specialized hazardous-waste firms displaying ISO 14001 credentials are therefore winning bids over generalist haulers that lack laboratory testing and manifest-tracking software. Rising capital expenditure pushes some smaller electroplating shops to form cooperatives that share on-site treatment units, echoing pooled effluent plants adopted by Indian textile clusters. The Waste Management market is responding with modular mobile separators that treat emulsified oils at the generator's dock, eliminating road transport and the liability it entails. As credit providers increasingly incorporate waste metrics into ESG loan covenants, industrial producers unwilling to disclose diversion progress are paying higher interest spreads, reinforcing the segment's push toward certified vendors.
The Waste Management Market Report is Segmented by Source (Residential, Commercial [Retail, Office, Etc. ], Industrial and More), by Service Type (Collection, Transportation, Sorting & Segregation and Disposal/Treatment), by Waste Type (Municipal Solid Waste, E-Waste and More), and by Geography (North America, Europe and More). The Report Offers Market Size and Forecasts in Value (USD) for all the Above Segments.
Geography Analysis
Asia-Pacific held 56% of 2025 global revenue, giving it the largest regional slice of the Waste Management market share and positioning it as the anchor for volume growth. China's revised Solid Waste Law imposes fines of USD 140,000 for illegal dumping, accelerating investment in optical sorters and waste-to-energy boilers that handle rising urban tonnage. India's Swachh Bharat Mission 2.0 disbursed USD 1.7 billion across 4,700 cities to scale source segregation and composting, while Japanese municipalities collectively target a 50% cut in final disposal by 2030, supported by mandatory take-back for textiles and smartphones. Private equity funds in Singapore are buying minority stakes in Malaysian recyclers, betting on regional logistics hubs that consolidate high-value plastics before shipment to local chemical depolymerization plants. Corporations exporting into Europe increasingly depend on compliant recovery certificates issued by licensed operators in Vietnam and Thailand, creating new revenue channels for firms that obtain both EU REACH and local permits.
The Middle East and Africa are the fastest-growing territories, expanding at a 9.1% CAGR to 2031 as sovereign wealth funds co-finance integrated waste campuses. Saudi Arabia's USD 1.8 billion joint venture with Averda exemplifies how public capital aligns with policy mandates targeting 70% diversion by 2030. The United Arab Emirates banned single-use plastics in 2024 and now grants fee holidays to operators installing advanced material-recovery facilities in Abu Dhabi's KEZAD zone. Egypt leverages World Bank loans to rehabilitate landfill cells and establish composting lines that process Cairo's food waste into agricultural amendments sold under guaranteed off-take agreements. South Africa's extended producer responsibility regulations, effective 2024, generated USD 90 million in compliance fees during their first full year, financing collection cooperatives in underserved townships.
North America and Europe remain technologically mature yet far from complacent. California and Washington State passed patchwork recycled-content statutes, prompting brand owners to lock in supply via 10-year contracts that favor U.S. recyclers offering blockchain-verified traceability. German and Dutch municipalities launched auction mechanisms where operators bid diversion percentages instead of gate-fee discounts, aligning incentives with circular-economy goals. Brazil, Chile, and Colombia trail in formal infrastructure but are closing gaps through sustainability-linked bond issuances, which subsidize fleet modernization and MRF upgrades. As legislation restricting waste exports widens, cross-border movements shrink, reinforcing regional self-sufficiency and pushing operators to optimize domestic treatment capacity.
- Veolia Environment SA
- Waste Management Inc.
- Suez SA
- Republic Services Inc.
- Waste Connections Inc.
- Clean Harbors Inc.
- Covanta Holding Corporation
- Biffa Group
- Remondis SE & Co. KG
- Stericycle Inc.
- GFL Environmental Inc.
- FCC Environment
- Cleanaway Waste Management Ltd
- Hitachi Zosen Inova AG
- Sims Limited
- Renewi PLC
- Averda
- Daiseki Co. Ltd
- Tatweer Environmental Services
- Waste Pro USA
- Recology
Additional Benefits:
- The market estimate (ME) sheet in Excel format
- 3 months of analyst support
TABLE OF CONTENTS
1 Introduction
- 1.1 Scope of the Study
2 Research Methodology
3 Executive Summary
4 Market Landscape
- 4.1 Market Drivers
- 4.1.1 Mandatory Recycled-Content Laws for Plastic Packaging (EU, US)
- 4.1.2 EPR Expansion to Textiles & Electronics Across APAC
- 4.1.3 Corporate Science-Based-Targets Requiring Waste Scope-3 Reporting
- 4.1.4 Sustainability-Linked Bonds Financing Waste Infrastructure in Emerging Markets
- 4.1.5 Green-Hydrogen Projects Using MSW Feedstock
- 4.1.6 AI-Driven Robotics Achieving 99 % MRF Purity, Cutting Sorting Costs
- 4.2 Market Restraints
- 4.2.1 Labour Shortages Inflating Collection Wages in OECD Countries
- 4.2.2 High Interest Rates Weakening PPP Financing for Recycling Plants
- 4.2.3 Import Bans on Solid Waste (e.g., China) Shrinking Disposal Options
- 4.2.4 Absence of End-of-Waste Rules for Recycled Carbon Fibre Limiting Adoption
- 4.3 Value / Supply-Chain Analysis
- 4.4 Regulatory Outlook
- 4.5 Technological Outlook
- 4.6 Startup Ecosystem Analysis
- 4.7 Key Emerging Trends
- 4.8 Impact of Geopolitical Shocks
- 4.9 Industry Attractiveness - Porter's Five Forces
- 4.9.1 Threat of New Entrants
- 4.9.2 Bargaining Power of Buyers
- 4.9.3 Bargaining Power of Suppliers
- 4.9.4 Threat of Substitute Products
- 4.9.5 Intensity of Competitive Rivalry
5 Market Size & Growth Forecasts (Value, In USD Billion)
- 5.1 By Source
- 5.1.1 Residential
- 5.1.2 Commercial (retail, office, etc.)
- 5.1.3 Industrial
- 5.1.4 Medical (Health and Pharmaceutical)
- 5.1.5 Construction & Demolition
- 5.1.6 Others (institutional, agricultural, etc)
- 5.2 By Service Type
- 5.2.1 Collection, Transportation, Sorting & Segregation
- 5.2.2 Disposal / Treatment
- 5.2.2.1 Landfill
- 5.2.2.2 Recycling & Resource Recovery
- 5.2.2.3 Incineration & Waste-to-Energy
- 5.2.2.4 Others (Chemical Treatment, Composting, etc.)
- 5.2.3 Others (Consulting, Audit & Training, etc.)
- 5.3 By Waste Type
- 5.3.1 Municipal Solid Waste
- 5.3.2 Industrial Hazardous Waste
- 5.3.3 E-waste
- 5.3.4 Plastic Waste
- 5.3.5 Biomedical Waste
- 5.3.6 Construction & Demolition Waste
- 5.3.7 Agricultural Waste
- 5.3.8 Other Specialized Waste (radio active, etc)
- 5.4 By Geography
- 5.4.1 North America
- 5.4.1.1 United States
- 5.4.1.2 Canada
- 5.4.1.3 Mexico
- 5.4.2 South America
- 5.4.2.1 Brazil
- 5.4.2.2 Argentina
- 5.4.2.3 Rest of South America
- 5.4.3 Asia-Pacific
- 5.4.3.1 China
- 5.4.3.2 Japan
- 5.4.3.3 India
- 5.4.3.4 South Korea
- 5.4.3.5 ASEAN (Indonesia, Thailand, Philippines, Malaysia, Vietnam)
- 5.4.3.6 Australia
- 5.4.3.7 Rest of Asia-Pacific
- 5.4.4 Europe
- 5.4.4.1 United Kingdom
- 5.4.4.2 Germany
- 5.4.4.3 France
- 5.4.4.4 Italy
- 5.4.4.5 Spain
- 5.4.4.6 Russia
- 5.4.4.7 BENELUX (Belgium, Netherlands, and Luxembourg)
- 5.4.4.8 NORDICS (Denmark, Finland, Iceland, Norway, and Sweden)
- 5.4.4.9 Rest of Europe
- 5.4.5 Middle East and Africa
- 5.4.5.1 Saudi Arabia
- 5.4.5.2 United Arab Emirates
- 5.4.5.3 Qatar
- 5.4.5.4 Turkey
- 5.4.5.5 South Africa
- 5.4.5.6 Egypt
- 5.4.5.7 Nigeria
- 5.4.5.8 Rest of Middle East and Africa
- 5.4.1 North America
6 Competitive Landscape
- 6.1 Strategic Moves
- 6.2 Market Share Analysis
- 6.3 Company Profiles {(includes Global level Overview, Market level overview, Core Segments, Financials as available, Strategic Information, Products & Services, and Recent Developments)}
- 6.3.1 Veolia Environment SA
- 6.3.2 Waste Management Inc.
- 6.3.3 Suez SA
- 6.3.4 Republic Services Inc.
- 6.3.5 Waste Connections Inc.
- 6.3.6 Clean Harbors Inc.
- 6.3.7 Covanta Holding Corporation
- 6.3.8 Biffa Group
- 6.3.9 Remondis SE & Co. KG
- 6.3.10 Stericycle Inc.
- 6.3.11 GFL Environmental Inc.
- 6.3.12 FCC Environment
- 6.3.13 Cleanaway Waste Management Ltd
- 6.3.14 Hitachi Zosen Inova AG
- 6.3.15 Sims Limited
- 6.3.16 Renewi PLC
- 6.3.17 Averda
- 6.3.18 Daiseki Co. Ltd
- 6.3.19 Tatweer Environmental Services
- 6.3.20 Waste Pro USA
- 6.3.21 Recology