
|
시장보고서
상품코드
2043834
북미의 스마트 미터 시장 : 점유율 분석, 업계 동향과 통계, 성장 예측(2026-2031년)North America Smart Meters - Market Share Analysis, Industry Trends & Statistics, Growth Forecasts (2026 - 2031) |
||||||
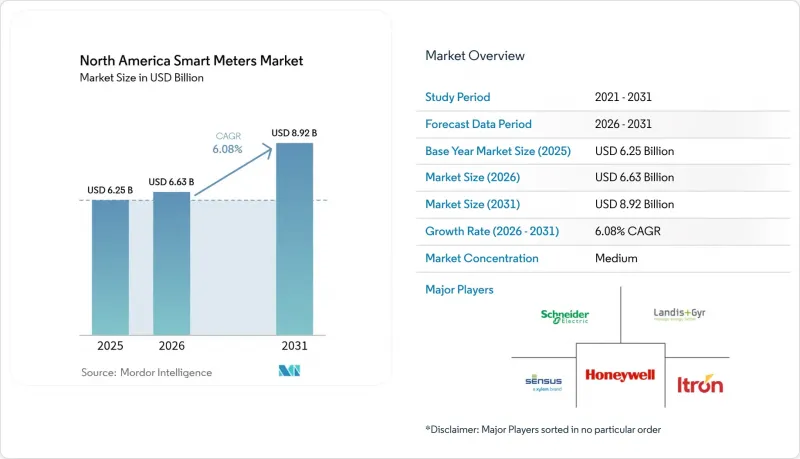
북미의 스마트 미터 시장 규모는 2025년 62억 5,000만 달러에서 2026년에는 66억 3,000만 달러로 확대되어 2026년부터 2031년까지 CAGR 6.08%로 성장을 지속하여, 2031년에는 89억 2,000만 달러에 이를 것으로 예측됩니다.

송배전 설비의 지속적인 현대화, 첨단 계량 인프라(AMI)에 대한 연방정부의 직접적인 예산 배분, 에너지 절약 의무의 확대 등으로 전력, 수도, 가스 사업자를 가로지르는 업그레이드 물결은 계속되고 있습니다. 스마트 미터 보급률이 이미 80%를 넘어섰기 때문에 다음 성장의 주축은 1단계 도입에서 엣지 컴퓨팅, 전압 최적화, 분산형 에너지 자원의 양방향 측정 기능을 통합한 AMI 2.0으로 대체하는 것입니다. 실시간 정확한 청구, 현장 대응 횟수 감소, 동적 가격 책정 프로그램 및 고객 참여 포털을 지원하는 상세한 소비 데이터에 대한 수요로 인해 유틸리티 사업자 수요는 더욱 증가하고 있습니다. 2024년 하반기 이후 반도체 공급망 경색은 완화되었지만, 부품 조달 리스크는 여전히 제약 요인으로 작용하고 있으며, 유틸리티 업체들은 다년 계약에 의한 조달, 공급업체 다변화, 안전재고 확충을 통해 이를 관리하고 북미 스마트미터 시장의 구매 모멘텀을 유지하고 있습니다. 하고 있습니다.
북미 스마트 미터 시장 동향 및 인사이트
전국적인 스마트 미터 도입을 위한 규제적 의무사항
설치 의무화 규제로 인해 첨단 계량 기술은 임의 기술에서 전력망 인프라로 변모했습니다. 온타리오주의 초기 지침은 시간대별 요금제 도입률을 90%까지 끌어올려 북미 전역의 규제 당국에 요금제 개혁과 스마트미터 보급이 함께 진행될 수 있다는 것을 보여주었습니다. 캘리포니아 주 의회 법안 2572는 2025년까지 모든 가정에 스마트 수도계량기 설치를 의무화함으로써 상수도 분야에도 비슷한 압력을 가하고 있습니다. 뉴욕주 상원 법안 S1550은 건강 영향에 대한 보고 요건을 추가하여, 도입의 모멘텀을 유지하면서 감독 체제를 강화할 것을 시사하고 있습니다. 예측 가능한 컴플라이언스 타임라인을 통해 공급업체는 생산 능력을 확장할 수 있는 자신감을 얻었으며, 북미 스마트미터 시장 수요량을 뒷받침하는 다년 계약을 체결하고 있습니다.
전력회사 주도의 송배전망 현대화 프로그램
전력회사들은 AMI를 배전 자동화, 전압 제어, 정전 관리에 대한 투자와 결합하고 있습니다. 미국 에너지부의 스마트 그리드 투자 보조금은 총 80억 달러에 달하는 99개 프로젝트에 자금을 지원하여 첨단 계량기를 현대 그리드의 센서 기반으로 통합했습니다. 뉴멕시코 주 공공 서비스 회사(Public Service Company of New Mexico)만 해도 3억 4,400만 달러의 광범위한 현대화 로드맵 중 1억 8,800만 달러를 계량기 업그레이드에 할당했습니다. 현재 많은 기업들이 더 높은 처리 능력과 메모리를 갖춘 AMI 2.0 엔드포인트를 지정하고 있습니다. 이를 통해 전압 이상이나 분산형 에너지 자원(DER)의 역송전을 실시간으로 감지하는 온보드 분석이 가능해져 그리드 가시성이 향상되는 동시에 분석 소프트웨어 제공업체에 새로운 수익 기회를 창출할 수 있습니다.
계량기 및 설치에 드는 높은 초기 비용
스마트 미터는 현장 작업비, 통신 모듈, 백오피스 통합 비용을 포함하면 기존 아날로그 계량기의 5배에서 7배의 비용이 소요됩니다. 산호세 워터가 23만 대에 투자한 1억 달러는 엔드포인트 당 약 435달러에 해당합니다. BC Hydro의 주 전역에 걸친 프로그램에는 20억 캐나다 달러(1.5억 달러)가 필요하며, 2033년까지 5억 2천만 캐나다 달러(3.9억 달러)의 순현재가치가 예상됩니다. 요금 개정 절차에서는 대부분 요금 가산으로 비용 회수가 가능하지만, 차입 능력이 제한된 소규모 협동조합의 경우 도입 기간을 8년에서 10년까지 연장하는 경우가 있어 단기적인 설치 대수가 억제되어 북미 스마트미터 시장에 간헐적인 수요 변동이 발생하게 됩니다. 간헐적인 수요 변동이 발생하게 됩니다.
부문 분석
2025년 매출의 79.60%를 전력 미터가 차지해, 북미 스마트미터 시장에서 전력량계가 핵심적인 역할을 하고 있음을 입증합니다. 의무적인 교체 일정과 미국 내 11억 1,000만 대의 엔드포인트가 이미 구축되어 있어 안정적인 AMI 2.0 업데이트 주기가 보장됩니다. 전력회사는 전압 분석, 정전 감지 및 서비스 중단 기능의 가치를 높이 평가하고 있으며, 이는 도난으로 인한 손실 회수 및 O&:M(운영 및 유지보수) 비용 절감에 기여하고 있습니다.
수도 미터는 2025년 매출의 13.10%에 불과하지만, CAGR 7.20%로 다른 모든 기기 카테고리를 능가하는 속도로 성장하고 있습니다. 물 절약 의무, 누수 감소 목표, 주정부가 지원하는 가뭄 대책 프로그램이 성장을 주도하고 있으며, 샌프란시스코와 같은 유틸리티 사업자는 5,600만 달러의 예산으로 18만 대를 도입했습니다. 아메리칸 워터는 이미 100만대 이상의 설치 실적을 달성했으며, 누수 지속 시간 38% 감소, 무수익 물량 두 자릿수 감소를 보고했습니다.
나머지 점유율은 가스 미터가 차지하고 있습니다. 이러한 완만한 증가세는 원격 차단 및 메탄 누출 감지를 의무화하는 안전 규제가 뒷받침하고 있습니다. 여러 유틸리티 사업자들은 출장 작업의 효율성을 극대화하기 위해 전기, 가스, 수도 설치를 함께 진행하고 있으며, 이러한 관행은 북미 스마트 미터 시장의 총 잠재 시장 규모를 더욱 확대시키고 있습니다.
기타 특전:
- 엑셀 형식 시장 예측(ME) 시트
- 3개월간 애널리스트 지원
자주 묻는 질문
목차
제1장 서론
제2장 조사 방법
제3장 주요 요약
제4장 시장 구도
제5장 시장 규모와 성장 예측
제6장 경쟁 구도
제7장 시장 기회와 향후 전망
JHS 26.06.11The North America Smart Meters Market size is expected to grow from USD 6.25 billion in 2025 to USD 6.63 billion in 2026 and is forecast to reach USD 8.92 billion by 2031 at 6.08% CAGR over 2026-2031.
Continued modernization of transmission and distribution assets, direct federal appropriations for advanced metering infrastructure, and widening conservation mandates keep the upgrade wave intact across electric, water, and gas utilities. Smart meter penetration has already surpassed 80%, so the next growth leg pivots from first-wave roll-outs to AMI 2.0 replacements that embed edge computing, voltage optimization, and bidirectional measurement of distributed energy resources. Utility demand is further buoyed by real-time billing accuracy, shrinking truck rolls, and the need for granular consumption data that underpins dynamic pricing programs and customer engagement portals. Semiconductor supply-chain pressures have moderated since late 2024, yet component risk remains a gating factor that utilities manage through multi-year procurement contracts, strengthened vendor diversification, and higher safety inventories, sustaining purchasing momentum in the North America Smart Meters market.
North America Smart Meters Market Trends and Insights
Regulatory Mandates for Nationwide Smart-Electric Meter Roll-outs
Obligatory installation rules have transformed advanced metering from a discretionary technology into grid infrastructure. Ontario's early directive, which has driven 90% time-of-use rate adoption, showed regulators across North America how tariff reform and smart-meter penetration can move in lockstep. California's Assembly Bill 2572 applies parallel pressure in the water sector by requiring smart water meters at every home by 2025. New York's Senate Bill S1550 adds a health-impact reporting layer, signaling expanded oversight while still keeping deployment engines running. Predictable compliance timelines give suppliers confidence to scale production capacity, locking in multi-year contracts that sustain volume for the North America Smart Meters market.
Utility-led Grid-Modernization Programs
Utilities are bundling AMI with distribution automation, voltage control, and outage management investments. The U.S. Department of Energy's Smart Grid Investment Grant funded 99 projects valued at USD 8 billion, embedding advanced meters as the sensor backbone of modern grids. Public Service Company of New Mexico alone earmarked USD 188 million for meter upgrades inside a broader USD 344 million modernization road map. Most firms now specify AMI 2.0 endpoints with extra processing power and memory, enabling on-board analytics that detect voltage anomalies and DER back-feed in real time, thus improving grid visibility while creating incremental revenue opportunities for analytics software providers.
High Upfront Meter & Installation Costs
Smart meters cost five to seven times more than legacy analog devices once field labor, communications modules, and back-office integration are included. San Jose Water's USD 100 million outlay for 230,000 units equates to roughly USD 435 per endpoint. BC Hydro's province-wide program required CAD 2 billion (USD 1.5 billion) but promises CAD 520 million (USD 390 million) in net present value by 2033. Rate cases often allow recovery through tariff adders, yet smaller cooperatives with limited borrowing power sometimes stretch deployments over eight to ten years, dampening near-term installation volumes and injecting episodic demand variance into the North America Smart Meters market.
Other drivers and restraints analyzed in the detailed report include:
- Federal and State Funding for Infrastructure Upgrades
- Demand for Real-time Consumption Data & Accurate Billing
- Cyber-security and Data-privacy Concerns
For complete list of drivers and restraints, kindly check the Table Of Contents.
Segment Analysis
Electricity meters generated 79.60% of 2025 revenue, underscoring their anchor role in the North America Smart Meters market. Mandatory replacement schedules and 111 million deployed endpoints across the United States ensure a steady AMI 2.0 refresh cycle. Utilities value voltage analytics, outage detection, and service disconnection features that help recoup theft losses and reduce O&M spending.
Water meters, though only 13.10% of 2025 revenue, are outpacing every other device category at a 7.20% CAGR. Conservation mandates, leak-reduction targets, and state-funded drought resilience programs drive growth, with utilities like San Francisco rolling out 180,000 units under a USD 56 million budget. American Water has already surpassed 1 million installations, reporting 38% leak-duration reductions and a double-digit cut in non-revenue water.
Gas meters comprise the remaining share. Their modest unit growth is buoyed by safety regulations that mandate remote shut-off and methane-leak detection. Several utilities bundle electric, gas, and water installations to maximize truck-roll efficiency, a practice that further increases total addressable volume for the North America Smart Meters market.
The North America Smart Meters Market Report is Segmented by Type (Electricity Meters, Water Meters, and Gas Meters), Communication Technology (RF Mesh, Power-Line Communication, Cellular, and Other Short-Range), End-User (Residential, Commercial, and Industrial), and Geography (United States, Canada, and Mexico). The Market Size and Forecasts are Provided in Terms of Value (USD).
List of Companies Covered in this Report:
- Landis+Gyr
- Itron
- Xylem (Sensus)
- Schneider Electric
- Honeywell International
- Siemens AG
- ABB Ltd
- Aclara (Hubbell)
- Kamstrup
- Badger Meter
- Neptune Technology Group
- EDMI
- Holley Technology
- Elster Group
- Silver Spring Networks (Itron)
- Trilliant
- Sagemcom
- Iskraemeco
- Hexing Electric
- EKM Metering
Additional Benefits:
- The market estimate (ME) sheet in Excel format
- 3 months of analyst support
TABLE OF CONTENTS
1 Introduction
- 1.1 Study Assumptions & Market Definition
- 1.2 Scope of the Study
2 Research Methodology
3 Executive Summary
4 Market Landscape
- 4.1 Market Overview
- 4.2 Market Drivers
- 4.2.1 Regulatory mandates for nationwide smart-electric meter roll-outs
- 4.2.2 Utility-led grid-modernization programs
- 4.2.3 Federal and state funding for infrastructure upgrades
- 4.2.4 Demand for real-time consumption data & accurate billing
- 4.2.5 Bi-directional metering to integrate distributed energy resources
- 4.2.6 Water-utility time-of-use tariffs amid drought management
- 4.3 Market Restraints
- 4.3.1 High upfront meter & installation costs
- 4.3.2 Cyber-security and data-privacy concerns
- 4.3.3 Semiconductor supply-chain volatility
- 4.3.4 Local pushback over RF-emission health fears
- 4.4 Supply-Chain Analysis
- 4.5 Regulatory Landscape
- 4.6 Technological Outlook
- 4.7 Porter's Five Forces
- 4.7.1 Bargaining Power of Suppliers
- 4.7.2 Bargaining Power of Consumers
- 4.7.3 Threat of New Entrants
- 4.7.4 Threat of Substitute Products & Services
- 4.7.5 Intensity of Competitive Rivalry
5 Market Size & Growth Forecasts
- 5.1 By Type
- 5.1.1 Electricity Meters
- 5.1.2 Water Meters
- 5.1.3 Gas Meters
- 5.2 By Communication Technology
- 5.2.1 RF Mesh
- 5.2.2 Power-Line Communication (PLC)
- 5.2.3 Cellular
- 5.2.4 Other Short-Range (Wi-Fi, Zigbee, BLE)
- 5.3 By End-User
- 5.3.1 Residential
- 5.3.2 Commercial
- 5.3.3 Industrial
- 5.4 By Geography
- 5.4.1 United States
- 5.4.2 Canada
- 5.4.3 Mexico
6 Competitive Landscape
- 6.1 Market Concentration
- 6.2 Strategic Moves (M&A, Partnerships, PPAs)
- 6.3 Market Share Analysis (Market Rank/Share for key companies)
- 6.4 Company Profiles (includes Global level Overview, Market level overview, Core Segments, Financials as available, Strategic Information, Products & Services, and Recent Developments)
- 6.4.1 Landis+Gyr
- 6.4.2 Itron
- 6.4.3 Xylem (Sensus)
- 6.4.4 Schneider Electric
- 6.4.5 Honeywell International
- 6.4.6 Siemens AG
- 6.4.7 ABB Ltd
- 6.4.8 Aclara (Hubbell)
- 6.4.9 Kamstrup
- 6.4.10 Badger Meter
- 6.4.11 Neptune Technology Group
- 6.4.12 EDMI
- 6.4.13 Holley Technology
- 6.4.14 Elster Group
- 6.4.15 Silver Spring Networks (Itron)
- 6.4.16 Trilliant
- 6.4.17 Sagemcom
- 6.4.18 Iskraemeco
- 6.4.19 Hexing Electric
- 6.4.20 EKM Metering
7 Market Opportunities & Future Outlook
- 7.1 White-space & Unmet-Need Assessment
