
|
시장보고서
상품코드
2043859
소나 시스템 : 시장 점유율 분석, 업계 동향 및 통계, 성장 예측(2026-2031년)Sonar Systems - Market Share Analysis, Industry Trends & Statistics, Growth Forecasts (2026 - 2031) |
||||||
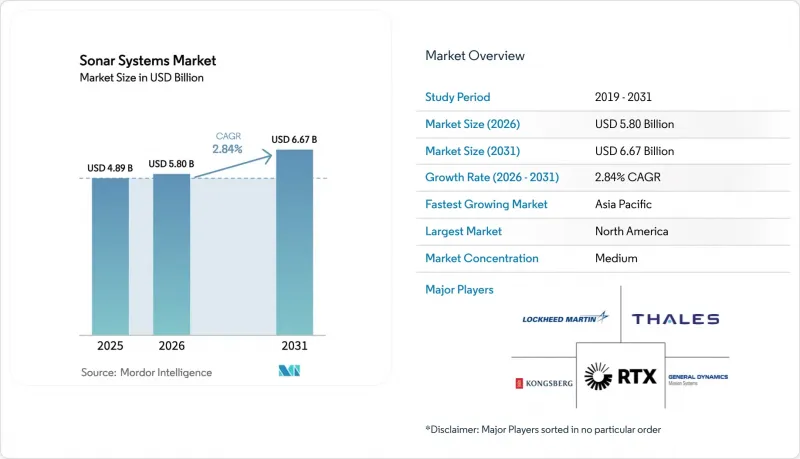
소나 시스템 시장 규모는 2025년 48억 9,000만 달러로 평가되었습니다. 2026년 58억 달러로 확대되어 2026년부터 2031년에 걸쳐 CAGR 2.84%를 나타내, 2031년에는 66억 7,000만 달러에 이를 것으로 예측됩니다.

이 낮은 표면상의 성장률 이면에는 구조적인 변화가 숨겨져 있습니다. 조달 예산이 대형 선체 탑재형 하드웨어에서 소프트웨어 정의 음향 어레이 및 자율 주행 차량으로 이동하고 있으며, 이는 보다 넓은 범위를 커버하고 라이프사이클 비용을 절감할 수 있기 때문입니다. 해군은 엣지 컴퓨팅을 통한 신호 처리에 자금을 투입하고 있으며, 민간 사업자들은 멀티 스태틱 AUV(자율 수중 로봇) 함대를 활용하여 검사 주기 단축과 선박 용선 비용 절감을 위해 노력하고 있습니다. 해상 풍력발전 시설 건설 증가, 국제해사기구(IMO)의 수중 소음 규제 강화, AI를 활용한 표적물 분류 기술의 발전으로 상업적 대상 시장은 계속 확대되고 있습니다. 한편, 사이버 보안 대책이 여전히 미흡하고, 광학 및 자기 센싱과 같은 대체 기술의 등장으로 경쟁 압력은 계속 증가하고 있으며, 벤더들은 오픈 아키텍처, 자체 개발한 AI 소프트웨어 스택 및 턴키 서비스 모델을 통해 타사와 차별화를 꾀하고 있습니다. 타사와의 차별화를 꾀할 수밖에 없는 상황입니다.
세계의 소나 시스템 시장 동향 및 인사이트
해군 함대 현대화 프로그램
냉전 시대의 어레이는 네트워크 중심 아키텍처에 통합된 모듈식 소프트웨어 정의 시스템으로 대체되고 있습니다. 미 해군은 2025 회계연도에 수중전 응용조사에 5,750만 달러, 음향감지 센서에 5,360만 달러를 배정하고 있는데, 이는 미 해군이 신조함보다 소나의 단계적 업그레이드를 우선순위에 두고 있음을 보여줍니다. AUKUS의 원자력 잠수함과 일본 해상자위대의 발주 확대는 아시아태평양 전체에서 라이프사이클 지원, 측면 어레이 및 훈련 인프라에 대한 수요를 더욱 증폭시키고 있습니다. 2026년 첫 실전 배치가 예정된 Mk 48 어뢰용 'Advanced Processor Build 6'과 같은 프로그램은 해군이 엣지단에서 AI 추론을 통합하여 레거시 플랫폼의 수명주기를 연장하고 위성 대역폭에 대한 의존도를 낮추기 위해 노력하고 있다는 것을 보여줍니다. 보여주고 있습니다. 더 많은 함대가 개조 경로를 선택함에 따라 개방형 아키텍처 펌웨어와 주권 컴퓨팅의 실적을 보유한 벤더는 그 발판을 더욱 견고하게 만들고 있습니다.
확대되는 해양 에너지 탐사
심해유전 사업자들은 날씨로 인한 가동 중단으로 인해 수상함정 운용이 어려워지자 합성개구부 소나나 사이드 스캔 소나를 탑재한 AUV(Autonomous Underwater Vehicle)를 이용한 순찰로 전환하고 있습니다. Equinor는 북해의 파이프라인 조사 기간을 14일에서 5일로 단축하여 2025년까지 선박 비용을 60% 절감하는 데 성공했습니다. 해상풍력 개발 사업자, 특히 유럽과 미국 사업자들은 건설을 시작하기 전에 거암지대 및 불발탄 매핑을 위해 고해상도 멀티빔 측량을 실시하도록 의무화하고 있습니다. 어업에서는 컨볼루션 신경망과 결합된 분할 빔식 에코 사운더를 도입하여 대상 어종과 혼획 어류를 실시간으로 구분하여 벌금을 피하는 데 기여하고 있습니다. 양식장 케이지에서는 유사한 어레이를 사용하여 생물량 밀도를 모니터링하고 그물망 파손을 감지하여 최적의 사료 사용과 환경 규제 준수를 보장합니다. 이러한 움직임이 맞물려 소나 시스템 시장은 전통적인 해군 분야라는 핵심을 넘어 확장되고 있습니다.
높은 초기 투자 및 라이프사이클 비용
호위함 1척 분량의 소나 시스템 한 세트는 2,000만 달러 이상이 소요되며, 25년간의 유지보수 비용으로 그 60%에 해당하는 비용이 추가로 필요합니다. 소규모 해군은 다목적 초계함의 자금 조달을 우선순위에 두고 업그레이드를 미루고 있으며, 그 결과 대잠 능력이 저하되고 있습니다. 상업용 멀티빔 장비의 가격은 50만 달러에서 100만 달러에 달하며, 연간 교정 비용은 정가의 10%-15% 정도입니다. 리스나 서비스 번들 모델은 도입 비용을 절감할 수 있지만, 운영자에게는 지속적인 비용 부담이 발생합니다. 소프트웨어 정의 어레이는 라이프사이클 비용을 30% 절감할 수 있을 것으로 기대되지만, 레거시 시스템으로는 대응할 수 없는 경우가 많으며, 초기 단계의 통합에 대한 노력이 필요합니다.
부문 분석
2025년 기준, 방산 분야가 소나 시스템 시장 규모의 69.87%를 차지했으며, 대잠전, 기뢰 감지, 항만 보안 임무에 대한 자금 배분이 지속적으로 우선순위를 차지하고 있어 앞으로도 가장 큰 부문이 될 것으로 예측됩니다. 상업 부문은 4.30%의 연평균 복합 성장률(CAGR)을 나타낼 것으로 예측됩니다. 이는 현재 해양 에너지 기업들이 고해상도 해저 데이터를 선택적 비용 항목이 아닌 업무상 필수 요건으로 취급하고 있기 때문입니다. 무인 순찰을 통해 해군과 대형 석유 회사는 승무원을 분쟁 해역에 노출시키지 않고도 24시간 365일 모니터링을 할 수 있어 두 고객 그룹 모두에서 이 기술의 보급을 촉진하고 있습니다.
AUV(Autonomous Underwater Vehicle)를 이용한 합성개구부 소나(Synthetic Aperture Sonar) 조사를 통해 Equinor는 2025년 파이프라인 1개당 검사에 소요되는 선박 가동일수를 6일 단축할 수 있게 되었으며, 이에 따라 동종업계도 2026년 조사 캠페인을 위해 계약 용량을 늘리고 있습니다. 어업 및 양식업에서는 실시간 어종 식별 기능을 갖춘 스플릿 빔 어레이를 활용하여 혼획으로 인한 처벌을 줄이고 있습니다. 민간 분야의 빠른 확장 속도에도 불구하고, 높은 연구개발 장벽과 수출 관리상의 장애물로 인해 2031년까지 방산 분야가 매출의 절대적인 주도권을 계속 유지할 것입니다.
패시브 어레이는 2025년 매출의 54.70%를 차지했으며, 이는 정숙성을 유지하면서 적을 감지하고자 하는 강력한 니즈를 반영합니다. 송신기와 수신기를 분리하고 미약한 디젤 전기 추진 선박의 반사파를 삼각측량하는 멀티 스태틱 아키텍처는 CAGR 5.10%를 나타낼 것으로 예측됩니다. 이러한 성장으로 멀티 스태틱 툴은 소나 시스템 시장에서 가장 빠르게 진화하는 기술 분야로 자리매김하고 있습니다.
MEDUSA UUV는 분산형 노드를 연동하여 수상함의 호위 없이도 요충지를 커버할 수 있으며, 그린워터와 브라운워터 작전 모두에서 채택을 확대할 것입니다. 능동형 소나는 대지뢰전이나 항만 방어에서 틈새 시장을 유지하고 있지만, 보다 엄격한 환경 심사를 통과해야 합니다. 이러한 기술 분화는 소나 시스템 시장 전망이 '만능형'이 아닌 임무 주도형이라는 점을 강조하고 있습니다.
지역별 분석
북미는 2025년 전 세계 매출의 36.98%를 차지했으며, 이는 미국의 잠수함 산업 기반에 대한 39억 달러의 자금 지원과 엣지컴퓨팅 지원 소나에 대한 지속적인 투자에 힘입은 것입니다. 대량 조달 주기와 단독 조달 계약으로 인해 이 지역은 구조적인 규모의 우위를 가지고 있으며, 2031년까지 소나 시스템 시장이 미국에 뿌리를 내릴 것이 확실시되고 있습니다.
아시아태평양은 호주의 AUKUS에 따른 원자력 잠수함 조달, 일본의 선체 탑재형 소나 배치 확대, 한국의 대지뢰 드론 투자로 인해 4.75%의 가장 높은 CAGR을 나타낼 것으로 예측됩니다. 각 지역 정부는 에너지 안보 확보와 배타적 경제수역의 효과적인 집행을 위해 해저 상황 파악이 필수적이라고 생각하고 있습니다. 아시아태평양의 소나 시스템 시장 규모는 방위 분야와 해양 에너지 분야의 동시 성장에 의해 주도되고 있습니다.
유럽에서는 영국과 프랑스가 바라쿠다급 잠수함의 측면 어레이를 업그레이드하는 한편, NATO의 소규모 회원국은 단계적으로 업그레이드를 진행하고 있으며, 꾸준한 업데이트 수요가 유지되고 있습니다. 노르웨이의 파이프라인 보호에 대한 지출은 해저 모니터링에 대한 투자로의 전환을 강조하고 있습니다. 중동에서는 항만 당국이 해수담수화 시설 취수구 주변에 주변 어레이를 설치하고 있으며, 브라질의 해양 개발 확대는 남미에서 완만한 수요 증가를 촉진하고 있습니다. 이들 지역을 전체적으로 보면, 성장의 핫스팟은 해양 주권과 에너지 공급의 탄력성을 중심으로 모자이크 형태로 전개되는 양상을 보입니다.
기타 혜택 :
- 엑셀 형식 시장 예측(ME) 시트
- 3개월간 애널리스트 지원
자주 묻는 질문
목차
제1장 서론
제2장 조사 방법
제3장 주요 요약
제4장 시장 구도
제5장 시장 규모와 성장 예측
제6장 경쟁 구도
제7장 시장 기회와 향후 전망
KTH 26.05.29The sonar systems market size is expected to grow from USD 4.89 billion in 2025 to USD 5.80 billion in 2026 and is forecasted to reach USD 6.67 billion by 2031 at a 2.84% CAGR over 2026-2031.
This modest headline growth conceals a structural shift, as procurement budgets shift from large, hull-mounted hardware toward software-defined acoustic arrays and autonomous vehicles that deliver more exhaustive coverage at lower lifecycle costs. Navies are steering funds toward edge-compute signal processing, while commercial operators use multi-static AUV fleets to shorten inspection cycles and cut vessel charter costs. Increasing offshore wind construction, stricter International Maritime Organization underwater-noise rules, and AI-enabled target classification continue to broaden the commercial addressable base. At the same time, persistent cyber-hardening gaps and the rise of optical or magnetic sensing alternatives keep competitive pressure high, forcing vendors to differentiate themselves through open architectures, sovereign AI software stacks, and turnkey service models.
Global Sonar Systems Market Trends and Insights
Naval Fleet Modernization Programs
Cold-War era arrays are being replaced with modular, software-defined systems that slot into network-centric architectures. The US Navy allocated USD 57.5 million to Undersea Warfare Applied Research and USD 53.6 million to Acoustic Search Sensors in FY 2025, indicating a priority for incremental sonar upgrades over new hulls. AUKUS nuclear-powered submarines and Japan's expanded Maritime Self-Defense Force orders further amplify demand for through-life support, flank arrays, and training infrastructure across the Asia-Pacific. Programs such as the Mk 48 torpedo Advanced Processor Build 6, slated for its first operational use in 2026, demonstrate how navies are embedding AI inference at the edge to extend the life cycles of legacy platforms and reduce their dependency on satellite bandwidth. As more fleets opt for retrofit paths, vendors with open-architecture firmware and sovereign-compute credentials strengthen their foothold.
Expanding Offshore Energy Exploration
Deepwater oil operators are shifting to AUV patrols equipped with synthetic-aperture and side-scan sonar because weather downtime hinders surface vessels. Equinor reduced pipeline survey time in the North Sea from 14 days to 5 days, resulting in a 60% decrease in vessel costs by 2025. Offshore wind developers, especially in Europe and the United States, mandate high-resolution multibeam surveys to map boulder fields and unexploded ordnance before construction begins. Fisheries deploy split-beam echosounders coupled with convolutional neural networks to separate quota species from bycatch in real time, helping avoid fines. Aquaculture cages utilize similar arrays to monitor biomass density and detect net tears, ensuring optimal feed usage and environmental compliance. Together, these moves expand the sonar systems market beyond its historical naval core.
High Capital and Lifecycle Costs
A single frigate sonar suite costs more than USD 20 million and requires another 60% of that figure for support over 25 years. Smaller navies defer upgrades to fund multi-role patrol vessels, thereby reducing their anti-submarine capacity. Commercial multibeam rigs range from USD 500,000 to USD 1 million, with annual calibration consuming 10%-15% of the list price. Leasing and service-bundle models lower entry costs but shift operators into recurring fees. Software-defined arrays promise 30% lifecycle savings, yet they require an upfront integration commitment that legacy systems often cannot support.
Other drivers and restraints analyzed in the detailed report include:
- Protecting Critical Subsea Energy Infrastructure
- Surge in Unmanned Underwater Vehicles (UUVs)
- Spectrum-Management and Licensing Hurdles
For complete list of drivers and restraints, kindly check the Table Of Contents.
Segment Analysis
Defense accounted for 69.87% of the sonar systems market size in 2025 and is expected to remain the largest segment, as anti-submarine warfare, mine detection, and port security missions continue to receive funding priority. The commercial segment is projected to register a 4.30% CAGR because offshore energy companies now treat high-resolution seabed data as an operational necessity rather than an optional cost line. Unmanned patrols enable navies and oil majors to achieve 24/7 coverage without exposing crews to contested waters, thereby supporting the broader adoption of this technology across both customer groups.
AUV-based synthetic-aperture sonar surveys saved Equinor six ship days per pipeline inspection in 2025, prompting similar operators to add contract capacity for 2026 campaigns. Fisheries and aquaculture use split-beam arrays with real-time species recognition to cut bycatch penalties. Despite the faster expansion on the civil side, high R&D barriers and export-control hurdles will keep defense in control of absolute revenue through 2031.
Passive arrays delivered 54.70% of 2025 revenue, reflecting the enduring need to detect adversaries while remaining silent. Multi-static architectures, where separated transmitters and receivers triangulate faint diesel-electric returns, are forecast to grow at a 5.10% CAGR. This uptick positions multi-static tools as the fastest-advancing technology segment in the sonar systems market.
MEDUSA UUVs will coordinate distributed nodes to cover chokepoints without a surface escort, amplifying adoption in both green- and brown-water operations. Active sonar keeps its niche in mine countermeasures and harbor defense but must navigate stricter environmental reviews. The technology split underscores a mission-driven rather than one-size-fits-all future for the sonar systems market.
The Sonar Systems Market Report is Segmented by Application (Defense, and Commercial), Technology (Active, Passive, and Multi-Static), Installation Platform (Ship, Submarine, Airborne, and Unmanned), Mounting (Hull, Towed Array, Dipping, and Seabed), Frequency Band (Low, Mid, and High), and Geography (North America, Europe, Asia-Pacific and More). The Market Forecasts are Provided in Terms of Value (USD).
Geography Analysis
North America generated 36.98% of global revenue in 2025, underpinned by USD 3.9 billion in US Submarine Industrial Base funding and sustained investment in edge-compute sonar upgrades. High-volume procurement cycles and sole-source contracts give the region structural scale advantages, ensuring that the sonar systems market remains anchored in the United States through 2031.
The Asia-Pacific region is projected to register the fastest 4.75% CAGR as Australia procures nuclear-powered submarines under AUKUS, Japan expands hull-mounted deployments, and South Korea invests in mine countermeasure drones. Regional governments view seabed awareness as a prerequisite for ensuring energy security and effective enforcement of the exclusive economic zone. The sonar systems market size in the Asia-Pacific region is driven by simultaneous growth in defense and offshore energy.
Europe maintains steady replacement demand, with the UK and France upgrading their Barracuda-class flank arrays, while smaller NATO members stagger their upgrades. Norway's pipeline protection spend highlights a shift toward seabed monitoring investments. In the Middle East, port authorities are installing perimeter arrays around desalination intakes, and Brazil's offshore expansion is fueling South America's modest uptick. Collectively, these geographies form a mosaic where growth hotspots revolve around maritime sovereignty and energy supply resilience.
- Thales Group
- RTX Corporation
- L3Harris Technologies, Inc.
- Kongsberg Gruppen ASA
- Northrop Grumman Corporation
- General Dynamics Mission Systems, Inc.
- Ultra Electronics Holdings
- TKMS GmbH
- Teledyne Technologies Incorporated
- FURUNO ELECTRIC CO., LTD.
- Navico Group (Brunswick Corporation)
- ASELSAN A.S.
- GeoSpectrum Technologies Inc.
- Western Marine Electronics, Inc.
- EdgeTech
- Hanwha Systems Co., Ltd.
Additional Benefits:
- The market estimate (ME) sheet in Excel format
- 3 months of analyst support
TABLE OF CONTENTS
1 INTRODUCTION
- 1.1 Study Assumptions and Market Definition
- 1.2 Scope of the Study
2 RESEARCH METHODOLOGY
3 EXECUTIVE SUMMARY
4 MARKET LANDSCAPE
- 4.1 Market Overview
- 4.2 Market Drivers
- 4.2.1 Naval fleet modernization programs
- 4.2.2 Expanding offshore energy exploration
- 4.2.3 Protecting critical subsea energy infrastructure
- 4.2.4 Surge in unmanned underwater vehicles (UUVs)
- 4.2.5 Integrating AI for signal processing
- 4.2.6 Mandatory IMO-2028 under-water noise limits
- 4.3 Market Restraints
- 4.3.1 High capital and lifecycle costs
- 4.3.2 Spectrum-management and licensing hurdles
- 4.3.3 Rising efficacy of non-acoustic detection
- 4.3.4 Cyber-hardening gaps in legacy platforms
- 4.4 Value Chain Analysis
- 4.5 Regulatory and Technological Outlook
- 4.6 Porter's Five Forces Analysis
- 4.6.1 Bargaining Power of Suppliers
- 4.6.2 Bargaining Power of Buyers
- 4.6.3 Threat of New Entrants
- 4.6.4 Threat of Substitute Products
- 4.6.5 Intensity of Competitive Rivalry
5 MARKET SIZE AND GROWTH FORECASTS (VALUE)
- 5.1 By Application
- 5.1.1 Defense
- 5.1.1.1 Anti-Submarine Warfare (ASW)
- 5.1.1.2 Mine Detection and Countermeasures
- 5.1.1.3 Port Secuirty
- 5.1.1.4 Others
- 5.1.2 Commercial
- 5.1.2.1 Offshore Oil and Gas
- 5.1.2.2 Hydrographic Survey and Research
- 5.1.2.3 Fisheries and Aquaculture
- 5.1.1 Defense
- 5.2 By Technology
- 5.2.1 Active Sonar
- 5.2.2 Passive Sonar
- 5.2.3 Multi-static Sonar
- 5.3 By Installation Platform
- 5.3.1 Ship-mounted
- 5.3.2 Submarine-mounted
- 5.3.3 Airborne
- 5.3.4 Unmanned Platforms (UUV/USV)
- 5.4 By Mounting
- 5.4.1 Hull-Mounted
- 5.4.2 Towed Array
- 5.4.3 Dipping Sonar
- 5.4.4 Seabed-Mounted
- 5.5 By Frequency Band
- 5.5.1 Low-Frequency
- 5.5.2 Mid-Frequency
- 5.5.3 High-Frequency
- 5.6 By Geography
- 5.6.1 North America
- 5.6.1.1 United States
- 5.6.1.2 Canada
- 5.6.1.3 Mexico
- 5.6.2 South America
- 5.6.2.1 Brazil
- 5.6.2.2 Rest of South America
- 5.6.3 Europe
- 5.6.3.1 United Kingdom
- 5.6.3.2 France
- 5.6.3.3 Germany
- 5.6.3.4 Italy
- 5.6.3.5 Russia
- 5.6.3.6 Rest of Europe
- 5.6.4 Asia-Pacific
- 5.6.4.1 China
- 5.6.4.2 Japan
- 5.6.4.3 South Korea
- 5.6.4.4 India
- 5.6.4.5 Australia
- 5.6.4.6 Rest of Asia-Pacific
- 5.6.5 Middle East and Africa
- 5.6.5.1 Middle East
- 5.6.5.1.1 Saudi Arabia
- 5.6.5.1.2 United Arab Emirates
- 5.6.5.1.3 Turkey
- 5.6.5.1.4 Rest of Middle East
- 5.6.5.2 Africa
- 5.6.5.2.1 South Africa
- 5.6.5.2.2 Rest of Africa
- 5.6.5.1 Middle East
- 5.6.1 North America
6 COMPETITIVE LANDSCAPE
- 6.1 Market Concentration
- 6.2 Strategic Moves
- 6.3 Market Share Analysis
- 6.4 Company Profiles (includes Global level Overview, Market level overview, Core Segments, Financials as available, Strategic Information, Market Rank/Share for key companies, Products and Services, and Recent Developments)
- 6.4.1 Thales Group
- 6.4.2 RTX Corporation
- 6.4.3 L3Harris Technologies, Inc.
- 6.4.4 Kongsberg Gruppen ASA
- 6.4.5 Northrop Grumman Corporation
- 6.4.6 General Dynamics Mission Systems, Inc.
- 6.4.7 Ultra Electronics Holdings
- 6.4.8 TKMS GmbH
- 6.4.9 Teledyne Technologies Incorporated
- 6.4.10 FURUNO ELECTRIC CO., LTD.
- 6.4.11 Navico Group (Brunswick Corporation)
- 6.4.12 ASELSAN A.S.
- 6.4.13 GeoSpectrum Technologies Inc.
- 6.4.14 Western Marine Electronics, Inc.
- 6.4.15 EdgeTech
- 6.4.16 Hanwha Systems Co., Ltd.
7 MARKET OPPORTUNITIES AND FUTURE OUTLOOK
- 7.1 White-Space and Unmet-Need Assessment

