
|
시장보고서
상품코드
2043869
프로젝션 매핑 : 시장 점유율 분석, 업계 동향 및 통계, 성장 예측(2026-2031년)Projection Mapping - Market Share Analysis, Industry Trends & Statistics, Growth Forecasts (2026 - 2031) |
||||||
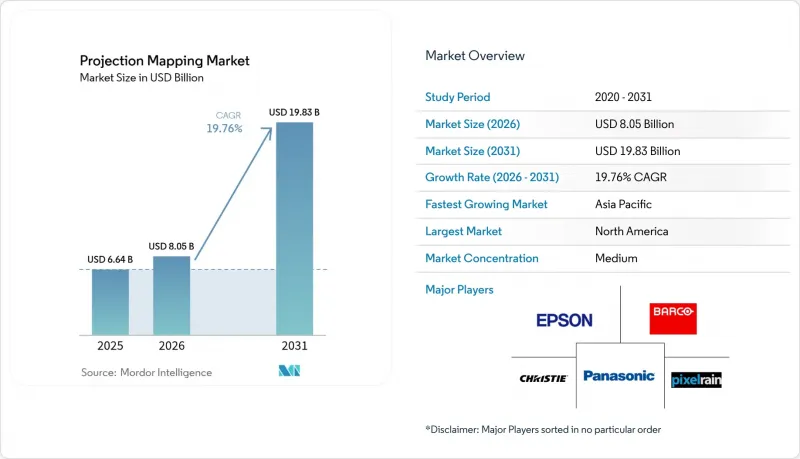
프로젝션 매핑 시장 규모는 2025년 66억 4,000만 달러로 평가되었습니다. 2026년 80억 5,000만 달러에서 2031년까지 198억 3,000만 달러로 확대되며 2026년부터 2031년까지 연평균 복합 성장률(CAGR)은 19.76%를 나타낼 전망입니다.

고휘도 레이저 프로젝터의 대중화, 루멘당 비용 감소, 실시간 생성형 AI 콘텐츠 워크플로우로 인해 공공 랜드마크, 테마파크, 소매 플래그십 스토어에 도입이 가속화되고 있습니다. 일본, 사우디아라비아, 아랍에미리트(UAE)의 지자체 스마트시티 프로그램은 예측 가능한 관광 수익과 카메라 기반 자동 캘리브레이션을 통한 현장 작업의 감소로 인해 프로젝션 매핑을 영구적인 인프라로 재인식하고 있습니다. 각 브랜드는 소셜 미디어 확산률이 15대 1을 넘는 몰입형 파사드 프로젝션에 광고 예산을 투입하고 있으며, 정적인 LED 디스플레이보다 스토리의 깊이와 기억에 남는다는 점에서 더 나은 결과를 가져오고 있습니다. 하드웨어 공급업체들은 현재 가동 시간과 에너지 소비를 모니터링하는 클라우드 콘텐츠 플랫폼을 번들로 제공하여 지속적인 서비스 수익을 창출하고 프로젝터 다운타임을 최대 50%까지 줄일 수 있도록 하고 있습니다.
세계의 프로젝션 매핑 시장 동향 및 인사이트
몰입형 광고 및 라이브 이벤트 체험
브랜드들은 정적인 광고판에서 우수한 인게이지먼트 지표와 많은 양의 사용자 생성 소셜 콘텐츠를 생성하는 파사드 테이크오버(facade takeover)로 지출을 전환하고 있습니다. 코카콜라의 '피카딜리 라이트' 캠페인과 아디다스의 '옥스포드 스트리트 랩'은 복잡한 표면을 가로지르는 스토리텔링이 영화와 같은 깊이를 제공하면서 LED의 노출 단가에 상응하는 효과를 발휘할 수 있다는 것을 증명했습니다. 테마파크도 비슷한 접근 방식을 채택하고 있습니다. 유니버설 올랜도 리조트의 'CineSational' 쇼는 관람객의 평균 체류시간을 22분 연장시켜 식음료 매출의 직접적인 증가로 이어졌습니다. 경기장 통로에는 동선 공간을 스폰서 획득이 가능한 미디어로 바꾸는 인터랙티브 프로젝션이 도입되는 한편, 일본의 무료 입장 페스티벌에서는 스폰서 주도형 수익화 모델이 입증된 바 있습니다. 상설형 장비는 이벤트 당 설치 비용이 절감되어 다년 주기로 ROI를 향상시킬 수 있습니다.
고휘도 레이저 프로젝터 소개
2만 5,000루멘 이상의 RGB 레이저 엔진은 2만 시간의 수명을 자랑하며, 유지보수 빈도를 크게 줄여 무인 옥상 설치가 가능합니다. 파나소닉의 PT-RQ50K 시리즈는 도쿄도청사의 1만 3,905평방미터를 커버하며, 현장 직원 없이 매일 밤 가동되고 있습니다. 크리스티 디지털은 기존 램프식 유닛으로는 주간 시인성이 불가능했던 아레나에 4만 5,000루멘의 모델을 도입했습니다. 레이저 제품의 가격 프리미엄은 1.8배까지 축소되어 5년 단위 총소유비용(TCO)은 현재 레이저 방식이 유리합니다. 중동의 메가 프로젝트에서는 10년간의 서비스 예산을 억제하기 위해 레이저 제품만 조달하도록 지정하고 있습니다.
높은 초기 도입 및 콘텐츠 비용
2,500평방미터의 파사드에 설치하는 영구적인 공공시설용 시스템은 80만-150만 달러가 필요하며, 도입은 지자체, 포춘지 선정 500대 기업, 일류 미술관 등으로 한정되어 있습니다. 렌탈 도입은 비용을 절감할 수 있지만, 70-80%의 유휴시간이 발생하여 차량 보유사의 수익률을 압박하고 있습니다. 콘텐츠 제작은 여전히 노동집약적이며, 10분짜리 쇼 한 편당 연간 4만-8만 달러의 제작비가 소요될 수 있습니다. EaaS(Equipment-as-a-Service)나 관광세 채권과 같은 자금조달 모델은 북미와 서유럽에 국한되어 있습니다. 표준화된 ROI(투자대비효과) 벤치마크의 부재는 가격에 민감한 지역에서의 예산 승인을 더욱 지연시키고 있습니다.
부문 분석
2025년 매출액 중 하드웨어가 61.83%를 차지했습니다. 이는 프로젝터, 렌즈, 미디어 서버가 자본 집약적인 성격을 가지고 있다는 것을 반영합니다. 한편, 소프트웨어는 CAGR 21.11%로 성장하고 있습니다. 이는 클라우드 플랫폼이 현장의 인건비를 절감하고 재생목록을 실시간으로 업데이트할 수 있기 때문입니다. 구독형 라이선싱은 일회성 판매를 예측 가능한 지속적인 수익으로 바꾸고, 원격 진단은 다운타임을 크게 줄입니다. Disguise, Dataton 및 Panasonic의 AcroSign은 현재 밝기 드리프트 및 전력 소비를 모니터링하는 분석 대시보드를 번들로 제공하여 공연장이 ISO 50001 보고 요건을 충족하도록 돕고 있습니다. 경쟁사 클라우드 제품군은 관중 히트맵 기능을 통합하여 스폰서를 위한 수익 창출이 가능한 데이터 패키지를 제공합니다. 현재 대부분의 프로젝터 OEM이 캘리브레이션 툴을 사전 탑재하고 있기 때문에 소프트웨어 잠금으로 인해 가격 결정권이 플랫폼 소유자에게로 이동하고 있습니다.
예측 기간 동안 많은 중규모 박물관은 프로젝터를 완전히 소유하는 것을 피하고 하드웨어를 임대하는 대신 영구적인 클라우드 소프트웨어 라이선스에 투자할 것입니다. 이러한 전환으로 프로젝션 매핑 시장에서 소프트웨어의 점유율은 디지털 사이니지에서 마지막으로 볼 수 있었던 수준까지 상승하여 이전에 방송용 그래픽에서 관찰된 SaaS로의 전환을 반영하게 될 것입니다. 생성형 AI를 내장한 플랫폼은 고가의 요금을 부과할 것으로 예상되며, 소프트웨어와 하드웨어 간의 수익 격차는 더욱 확대될 것입니다.
2025년 지출 중 3D 설치가 55.72%를 차지했으며, 관객들은 이제 스마트폰으로 재현할 수 없는 다감각적 몰입 경험을 원하고 있습니다. 프로젝션 맵핑에 햅틱, 향기 확산, 동기화된 드론을 결합한 시설에서는 야간 방문객에게 30-50달러의 추가 요금을 상시 징수하고 있습니다. CAGR 20.82%로 성장하고 있는 이러한 4D 포맷은 방문객의 체류시간을 연장하고, 소매 및 식음료 부수적 지출을 촉진합니다. 박물관에서는 비용 중심의 교육용 전시물에 2D 오버레이를 활용하고 있지만, AI 깊이 추정 플러그인을 통해 기존 2D 라이브러리를 준 3D 콘텐츠로 변환하여 자산의 수명을 연장하고 있습니다.
몰입형 어트랙션에서는 가벼운 녹화를 자제하기 때문에 운영자는 지적 재산을 보호하고 인터넷에 무단으로 유출되는 것을 최소화하고 있습니다. 이러한 독점성으로 인해 평균 티켓 단가가 높게 유지되고 있으며, 2031년까지 프로젝션 매핑 시장 규모에서 4D가 점유율을 확대할 것으로 예측됩니다. 역사지구의 안전 규정에 따라 불꽃놀이의 사용은 제한되어 있지만, 바람 분사나 향기 등 대부분의 4D 효과는 적절하게 문서화되어 있다면 규정을 준수하고 허가를 받기도 쉽습니다.
지역별 분석
일본이 도시 정책에 프로젝션 매핑을 제도화하면서 아시아태평양이 CAGR 21.66%로 성장을 주도하고 있습니다. 또한, 중동에서는 소버린 프로그램을 통해 파이버 백홀과 GPU 엣지 노드를 결합한 대규모 설치에 자금이 투입되고 있습니다. 북미는 2025년에도 여전히 가장 큰 수익원이지만, 새로운 하드웨어 도입에서 콘텐츠 업데이트 주기로 전환하고 있으며, 성장률은 한 자릿수 중반으로 안정적일 것으로 예측됩니다.
유럽에서는 문화유산 관광을 기반으로 꾸준한 도입이 진행되고 있지만, EU 지침 2024/1619에 의해 밝기 상한과 가동 시간 제한이 부과되어 허가 취득까지의 기간이 길어지고 있습니다. 그럼에도 불구하고, 바르셀로나나 암스테르담의 지자체 시범 사업은 적응형 조광 알고리즘을 사용하여 규제를 준수하면서 방문객의 흐름을 유지할 수 있다는 것을 입증했습니다.
인도, 한국, 동남아시아에서는 프로젝터 가격의 하락과 문화유산 관광에 대한 노력이 결합되어 새로운 기회를 창출하고 있습니다. 남미와 아프리카는 예산의 제약과 통합업체 부족으로 인해 뒤쳐져 있지만, 브라질의 월드컵 관련 인프라, 이집트의 고고학 전시 등은 자금 조달 수단이 성숙해지면 향후 보급이 확대될 것임을 시사합니다.
기타 혜택 :
- 엑셀 형식 시장 예측(ME) 시트
- 3개월간 애널리스트 지원
자주 묻는 질문
목차
제1장 서론
제2장 조사 방법
제3장 주요 요약
제4장 시장 구도
제5장 시장 규모와 성장 예측
제6장 경쟁 구도
제7장 시장 기회와 향후 전망
KTH 26.05.29The projection mapping market size is projected to expand from USD 6.64 billion in 2025 and USD 8.05 billion in 2026 to USD 19.83 billion by 2031, registering a CAGR of 19.76% between 2026 to 2031.
Widespread adoption of high-brightness laser projectors, falling cost-per-lumen metrics, and real-time generative-AI content workflows are accelerating deployments across civic landmarks, theme parks, and retail flagships. Municipal smart-city programs in Japan, Saudi Arabia, and the UAE are reclassifying projection mapping as permanent infrastructure, assured of predictable tourism dividends and lower on-site labor enabled by camera-based auto-calibration. Brands are reallocating advertising budgets toward immersive facade takeovers that deliver social-media amplification ratios exceeding 15:1, outpacing static LED in narrative depth and memorability. Hardware vendors now bundle cloud content platforms that monitor uptime and energy consumption, creating recurring service revenue and reducing projector downtime by up to 50%.
Global Projection Mapping Market Trends and Insights
Immersive Advertising And Live-Event Experiences
Brands are shifting spend from static billboards to facade takeovers that generate superior engagement metrics and large volumes of user-generated social content. Coca-Cola's Piccadilly Lights activation and Adidas's Oxford Street wrap proved that storytelling across complex surfaces matches LED cost-per-impression while delivering cinematic depth. Theme parks duplicate the approach; Universal Orlando Resort's CineSational show extended average guest dwell time by 22 minutes, directly lifting food-and-beverage sales. Stadium corridors now feature interactive projections that convert circulation space into sponsorable media, while free-admission festivals in Japan demonstrate sponsorship-led monetization models. Permanent installations benefit from lower per-event setup costs, improving ROI over multiyear cycles.
High-Brightness Laser Projectors Adoption
RGB laser engines exceeding 25,000 lumens provide 20,000-hour lifespans, slashing maintenance visits and enabling unmanned rooftop arrays. Panasonic's PT-RQ50K series covers 13,905 square meters on the Tokyo Metropolitan Government Building and operates nightly without on-site staff. Christie Digital deploys 45,000-lumen models in arenas where daylight readability was once impossible with lamp-based units. The laser price premium has narrowed to 1.8X, and total cost of ownership now favors laser in five-year models. Middle East megaprojects specify laser-only procurement to contain ten-year service budgets.
High Up-Front Installation And Content Costs
A permanent civic installation on a 2,500-square-meter facade demands USD 0.8-1.5 million, restricting adoption to municipalities, Fortune 500 brands, and tier-1 museums. Rental deployments cost less but suffer 70-80% idle time, eroding fleet margins. Content creation stays labor-intensive; a 10-minute show can incur USD 40,000-80,000 in creative fees each year. Financing models such as equipment-as-a-service and tourism-tax bonds remain confined to North America and Western Europe. Lack of standardized ROI benchmarks further slows budget approvals in price-sensitive regions.
Other drivers and restraints analyzed in the detailed report include:
- Smart-City Landmark Illumination Programs
- Real-Time Generative-AI Content Workflows
- Complex Site-Specific Calibration Delays
For complete list of drivers and restraints, kindly check the Table Of Contents.
Segment Analysis
Hardware accounted for 61.83% of 2025 revenue, reflecting the capital-intensive nature of projectors, lenses, and media servers. Software, however, is rising at a 21.11% CAGR because cloud platforms cut on-site labor and enable real-time playlist updates. Subscription licensing converts one-time sales into predictable annuities while remote diagnostics slash downtime. Disguise, Dataton, and Panasonic's AcroSign now ship bundled analytics dashboards that monitor brightness drift and power draw, helping venues meet ISO 50001 reporting requirements. Competing cloud suites integrate audience heat-mapping, offering venues monetizable data packages for sponsors. As most projector OEMs now preload calibration tools, software lock-in is shifting pricing power toward platform owners.
Over the forecast window, many mid-sized museums will forgo outright projector ownership, instead renting hardware while investing in perpetual cloud software seats. That pivot will raise software's share of the projection mapping market to levels last seen in digital signage, mirroring the SaaS transition previously observed in broadcast graphics. Platforms embedding generative AI are expected to command premium fees, further widening the revenue gap between code and metal.
3D installations held 55.72% of 2025 spending, yet audiences now seek multisensory immersion that smartphones cannot replicate. Venues bundling haptics, fragrance diffusion, and synchronized drones with projection mapping routinely charge night-time visitor premiums of USD 30-50. Such 4D formats, growing at a 20.82% CAGR, bolster guest stay times and ancillary spend on retail and food. Museums leverage 2D overlays for cost-sensitive educational exhibits, but AI depth-estimation plugins are turning legacy 2D libraries into quasi-3D content, extending the life of assets.
Because immersive attractions discourage casual recording, operators protect intellectual property and minimize free online leaks. That exclusivity sustains higher average ticket values, ensuring 4D will capture incremental share of the projection mapping market size by 2031. Although safety regulations in heritage districts limit pyrotechnics, most 4D effects, such as wind jets and scent, comply when properly documented, easingan permitting.
The Projection Mapping Market Report is Segmented by Offering (Hardware, and Software), Dimension (2D, 3D, and More), Brightness Class (Less Than 10, 000 Lm and More), Projection Technology (DLP, LCD, and More), Mapping Surface (Building Facades, Indoor Walls and Floors, and More), Application (Large Venues and Facades, Events and Festivals, and More), and Geography. The Market Forecasts are Provided in Terms of Value (USD).
Geography Analysis
Asia-Pacific leads growth with a 21.66% CAGR as Japan institutionalizes projection mapping within urban policy, and the Middle East funds mega-installations through sovereign programs that bundle fiber backhaul and GPU edge nodes. North America, while still the largest revenue contributor in 2025, is transitioning from new hardware rollouts toward content refresh cycles, stabilizing growth at mid-single-digit rates.
Europe maintains steady adoption anchored in heritage tourism, yet EU Directive 2024/1619 imposes brightness caps and operating-hour limits that lengthen permitting timelines. Municipal pilots in Barcelona and Amsterdam nonetheless demonstrate that adaptive-dimming algorithms can comply with regulations while maintaining visitor flow.
Emerging opportunities arise in India, South Korea, and Southeast Asia, where declining projector prices intersect with heritage-tourism initiatives. South America and Africa lag due to budget constraints and a scarcity of integrators, though World Cup legacy infrastructure in Brazil and archaeological showcases in Egypt hint at future uptake once financing tools mature.
- Panasonic Corporation
- Seiko Epson Corporation
- Barco NV
- Christie Digital Systems USA, Inc.
- BenQ Corporation (Qisda)
- ViewSonic Corporation
- Vivitek (Delta Electronics)
- NEC Display Solutions (Sharp)
- Disguise Technologies Limited
- Dataton AB
- HeavyM (Digital Essence SAS)
- Green Hippo Ltd
- Resolume BV
- Blackmagic Design Pty Ltd
- Avolites Ltd
- GarageCube SA (MadMapper)
- Pixel Rain Digital
- Digital Projection Ltd
- Optoma Europe Limited (Coretronic)
- Sony Corporation
- LG Electronics Inc.
- Lightform Inc.
- Lumitrix s.r.o.
- Vioso GmbH
Additional Benefits:
- The market estimate (ME) sheet in Excel format
- 3 months of analyst support
TABLE OF CONTENTS
1 INTRODUCTION
- 1.1 Study Assumptions and Market Definition
- 1.2 Scope of the Study
2 RESEARCH METHODOLOGY
3 EXECUTIVE SUMMARY
4 MARKET LANDSCAPE
- 4.1 Market Overview
- 4.2 Market Drivers
- 4.2.1 Immersive Advertising and Live-Event Experiences
- 4.2.2 High-Brightness Laser Projectors Adoption
- 4.2.3 Smart-City Landmark Illumination Programs
- 4.2.4 Declining Cost-Per-Lumen from RGB Laser Engines
- 4.2.5 Real-Time Generative-AI Content Workflows
- 4.2.6 XR Stage Demand for Complementary Mapping
- 4.3 Market Restraints
- 4.3.1 High Up-Front Installation and Content Costs
- 4.3.2 Complex Site-Specific Calibration Delays
- 4.3.3 Light-Pollution / Heritage-Facade Regulation
- 4.3.4 Laser-Diode Supply-Chain Volatility
- 4.4 Value Chain Analysis
- 4.5 Technological Outlook
- 4.6 Porter's Five Forces
- 4.6.1 Threat of New Entrants
- 4.6.2 Bargaining Power of Buyers
- 4.6.3 Bargaining Power of Suppliers
- 4.6.4 Threat of Substitutes
- 4.6.5 Degree of Competition
- 4.7 Impact of Macroeconomic Factors
5 MARKET SIZE AND GROWTH FORECASTS (VALUE)
- 5.1 By Offering
- 5.1.1 Hardware
- 5.1.2 Software
- 5.2 By Dimension
- 5.2.1 2D
- 5.2.2 3D
- 5.2.3 4D / Immersive
- 5.3 By Brightness Class (ANSI lm)
- 5.3.1 Less Than 10,000 lm
- 5.3.2 10,000 - 25,000 lm
- 5.3.3 Greater Than 25,000 lm
- 5.4 By Projection Technology
- 5.4.1 DLP
- 5.4.2 LCD
- 5.4.3 LCoS and Others
- 5.5 By Mapping Surface
- 5.5.1 Building Facades
- 5.5.2 Indoor Walls and Floors
- 5.5.3 Objects and Products
- 5.5.4 Water Screens and Natural Terrain
- 5.6 By Application
- 5.6.1 Large Venues and Facades
- 5.6.2 Events and Festivals
- 5.6.3 Theme Parks and Attractions
- 5.6.4 Sports Arenas and Stadiums
- 5.6.5 Cultural and Heritage Sites
- 5.6.6 Commercial Spaces (Retail, Corporate, Education)
- 5.6.7 Other Application
- 5.7 By Geography
- 5.7.1 North America
- 5.7.1.1 United States
- 5.7.1.2 Canada
- 5.7.1.3 Mexico
- 5.7.2 South America
- 5.7.2.1 Brazil
- 5.7.2.2 Argentina
- 5.7.2.3 Rest of South America
- 5.7.3 Europe
- 5.7.3.1 Germany
- 5.7.3.2 France
- 5.7.3.3 United Kingdom
- 5.7.3.4 Italy
- 5.7.3.5 Rest of Europe
- 5.7.4 Asia-Pacific
- 5.7.4.1 China
- 5.7.4.2 Japan
- 5.7.4.3 South Korea
- 5.7.4.4 India
- 5.7.4.5 Rest of Asia-Pacific
- 5.7.5 Middle East
- 5.7.5.1 Saudi Arabia
- 5.7.5.2 United Arab Emirates
- 5.7.5.3 Rest of Middle East
- 5.7.6 Africa
- 5.7.6.1 South Africa
- 5.7.6.2 Egypt
- 5.7.6.3 Rest of Africa
- 5.7.1 North America
6 COMPETITIVE LANDSCAPE
- 6.1 Market Concentration
- 6.2 Strategic Moves
- 6.3 Market Share Analysis
- 6.4 Company Profiles (includes Global-Level Overview, Market-Level Overview, Core Segments, Financials as available, Strategic Information, Market Rank / Share for Key Companies, Products and Services, and Recent Developments)
- 6.4.1 Panasonic Corporation
- 6.4.2 Seiko Epson Corporation
- 6.4.3 Barco NV
- 6.4.4 Christie Digital Systems USA, Inc.
- 6.4.5 BenQ Corporation (Qisda)
- 6.4.6 ViewSonic Corporation
- 6.4.7 Vivitek (Delta Electronics)
- 6.4.8 NEC Display Solutions (Sharp)
- 6.4.9 Disguise Technologies Limited
- 6.4.10 Dataton AB
- 6.4.11 HeavyM (Digital Essence SAS)
- 6.4.12 Green Hippo Ltd
- 6.4.13 Resolume BV
- 6.4.14 Blackmagic Design Pty Ltd
- 6.4.15 Avolites Ltd
- 6.4.16 GarageCube SA (MadMapper)
- 6.4.17 Pixel Rain Digital
- 6.4.18 Digital Projection Ltd
- 6.4.19 Optoma Europe Limited (Coretronic)
- 6.4.20 Sony Corporation
- 6.4.21 LG Electronics Inc.
- 6.4.22 Lightform Inc.
- 6.4.23 Lumitrix s.r.o.
- 6.4.24 Vioso GmbH
7 MARKET OPPORTUNITIES AND FUTURE OUTLOOK
- 7.1 White-Space and Unmet-Need Assessment

