
|
시장보고서
상품코드
2043879
전기 삼륜차 : 시장 점유율 분석, 업계 동향 및 통계, 성장 예측(2026-2031년)Electric Three-Wheeler - Market Share Analysis, Industry Trends & Statistics, Growth Forecasts (2026 - 2031) |
||||||
전기 삼륜차 시장 규모는 2025년에 36억 5,000만 달러로 평가되었습니다. 2026년 42억 달러에서 2031년까지 84억 7,000만 달러에 이를 것으로 예상되며, 예측 기간(2026-2031년) CAGR은 15.08%를 나타낼 전망입니다.

정책의 급속한 조정, 총소유비용(TCO)의 획기적인 비용 대비 비용 달성, 자금 조달 메커니즘의 다양화 등이 여객 및 화물 운송의 두 가지 이용 사례에서 수요를 주도하고 있습니다. 인도의 'PM E-DRIVE'와 제안된 'FAME-III' 프로그램, 미국의 '인플레이션 억제법'에 따른 상업용 크레딧, EU의 'Fit-for-55' 패키지가 결합되어 이미 활용도가 높은 차량군에서 이미 존재하는 가격 경쟁력을 더욱 강화합니다. 공급 측면에서는 2024년 리튬 이온 배터리 팩의 가격이 전년 대비 12% 하락하고 납축전지 시스템과의 비용 차이가 줄어들면서 기술 전환이 가속화되었습니다. 인프라 혁신도 결정적인 역할을 하고 있습니다. 2025년 10월, 인도의 배터리 교체 네트워크인 Battery Smart는 1,400개 스테이션에서 5,000만 번의 배터리 교체를 완료하여 상업용 운전자의 다운타임을 몇 시간에서 단 몇 분으로 줄였습니다.
세계의 전기 삼륜차 시장 동향 및 인사이트
구매 인센티브 확대가 시장 가속화 견인
조정된 보조금 제도로 인해 도입 비용이 크게 절감되었습니다. 인도는 FAME-III 제안에 따라 전기 삼륜차에 4,100 루피(4억 9,200만 달러)를 책정하고, 수요의 급격한 감소를 막기 위해 단계적 감축을 설계했습니다. 미국이나 EU에서도 비슷한 분위기가 형성되고 있으며, 공장 생산능력 투자를 뒷받침하는 예측 가능한 정책 전망이 형성되고 있습니다. 과거 사례에 따르면, 이전 인센티브 시행 기간 동안 판매량이 최대 10배까지 증가한 것으로 나타났습니다. 이를 통해 확실성을 높이고, 자금 조달 비용을 낮추며, 각 지역의 전기 삼륜차 시장을 안정화시켰습니다.
전자상거래의 라스트 마일 혁신으로 수요 패턴 재편될 것
택배 취급량이 급증함에 따라 물류 사업자들은 전기삼륜차 시장에서 이륜차에서 적재량이 큰 삼륜차로 전환을 추진하고 있습니다. 상업용 사용자는 내연기관차 대비 최대 2.5배 낮은 운영 비용을 실현하여 신흥 시장 성장 촉진요인의 수입을 직접적으로 증가시키고 있습니다. 유럽과 미국 소매업체들도 전기 사륜차 시범 도입을 추진하고 있어 아시아 외의 도시로의 파급력을 시사하고 있습니다. 한편, 교체형 배터리는 다운타임을 2분 미만으로 단축시켜 자산 활용도를 더욱 높여줍니다.
3륜차 전용 충전 인프라 부족
인도에는 1만 1,000개의 공공 충전기가 운영되고 있지만, 이는 2030년까지 전기 삼륜차 시장에 필요한 130만 대의 1%에 불과합니다. 고장률이 17%를 넘어서는 것은 사용자의 신뢰를 떨어뜨리고 있으며, 영국과 같은 성숙한 지역에서도 '충전 사막'이 나타나고 있습니다. 배터리 교체 거점이 부분적인 해결책을 제공하고 있지만, 그 확장을 위해서는 표준화와 특혜를 동반한 자금 유입이 필수적입니다.
부문 분석
2025년 기준, 승용 삼륜차가 전기 삼륜차 시장의 81.65%를 차지했으며, 이는 남아시아 대도시에 뿌리내린 공유 모빌리티 문화에 힘입은 바 큽니다. 그러나 라스트 마일 물류의 급격한 성장을 반영하여 화물 운송용 삼륜차가 CAGR 18.60%로 가장 빠른 성장세를 보이고 있습니다. 따라서 화물 운송으로 인한 전기 삼륜차 시장 규모는 2031년까지 빠르게 확대될 것으로 예측됩니다.
이용률 증가는 총소유비용(TCO)의 이점을 확대하고, 다운타임을 크게 줄일 수 있는 '금융+스왑' 패키지를 도입하도록 유도하고 있습니다. 케냐와 같은 시장에서는 운전자의 수익이 이미 내연기관차와 동등한 수준을 넘어서고 있어 상업적 매력이 입증되고 있습니다. 여객 운송 서비스는 승차공유 앱의 경쟁 압력으로 성장세가 둔화되고 있지만, 여전히 안정적인 판매량을 유지할 것으로 예측됩니다.
납축전지 팩은 낮은 도입 비용으로 인해 2025년 63.90%의 점유율을 차지했지만, 2031년까지 20.75%의 연평균 복합 성장률(CAGR)로 리튬이온 시스템이 추월할 것으로 예측됩니다. 가격 하락과 에너지 밀도 기준의 향상이라는 두 가지 요인이 겹치면서 전기 삼륜차 시장에서 리튬 이온 배터리의 점유율이 상승하고 있습니다. CATL의 배터리 비용 절감(2023년 중반 kWh당 110달러에서 2024년 중반 56달러로)은 기술 경제의 근본적인 전환을 의미하며, 리튬 이온 배터리의 보급을 가속화하고 있습니다.
보다 안전한 열 특성을 가진 LFP(리튬인산철 인산철)계 배터리는 예측 가능한 가동 주기를 원하는 지자체 및 택배 차량군에 보급이 확대되고 있습니다. 한편, 고급 승용차 제조업체들은 몬트라 슈퍼 오토의 203km의 항속거리에서 알 수 있듯이 항속거리를 200km 이상으로 연장하는 고에너지 밀도 니켈리치 팩을 선호하고 있습니다.
지역별 분석
2025년 아시아태평양은 전기 삼륜차 시장에서 72.10%의 점유율을 차지하며 시장을 장악했습니다. 인도에서만 2023년 58만 대를 판매하며 FAME-II 보조금에 힘입어 전년 대비 65% 급증했습니다. 중국 공급업체들은 국내 EV 공급과잉을 배경으로 잉여 생산능력을 동남아시아로 전환하고 있으며, 그 예로 Yadea의 1억 5,000만 달러 규모의 인도네시아 공장을 들 수 있습니다. 태국이 2030년까지 65만 대의 이륜차를 지원하는 1,450개의 배터리 교환소 설치를 목표로 하고 있는 것은 정부 주도의 인프라 구축에 대한 추진력을 뒷받침하고 있습니다.
중동 및 아프리카는 CAGR 19.55%로 가장 빠르게 성장하는 지역입니다. UAE에서는 2050년 넷제로 목표를 배경으로 보급률이 2021년 0.7%에서 2023년 13%로 급상승했습니다. 아프리카 시장에서는 이륜차와 삼륜차가 주요 수입원으로 채택되고 있으며, 르완다에서는 태양광 발전을 이용한 배터리 교환 스테이션을 활용하여 전력망의 병목현상을 극복하고 있습니다. 유럽과 북미에서는 보다 완만한 보급이 이루어지고 있습니다. 초소형 전기차 수입에는 관세 인상이 부과되고 있으며, 미국 차량용 'Eli ZERO'와 같은 모델의 경우 가격이 두 배로 오를 수 있습니다. 그럼에도 불구하고, 도심 내 화물 운송과 저속 주행 구역의 설치로 인해 소형 삼륜차를 위한 틈새 시장이 열리면서 북미에서 11.41%의 연평균 복합 성장률(CAGR)을 유지하고 있습니다.
기타 혜택 :
- 엑셀 형식 시장 예측(ME) 시트
- 3개월간 애널리스트 지원
자주 묻는 질문
목차
제1장 서론
제2장 조사 방법
제3장 주요 요약
제4장 시장 구도
제5장 시장 규모 및 성장 예측(금액 및 수량)
제6장 경쟁 구도
제7장 시장 기회와 향후 전망
KTH 26.05.29The electric three-wheeler market size was valued at USD 3.65 billion in 2025 and estimated to grow from USD 4.2 billion in 2026 to reach USD 8.47 billion by 2031, at a CAGR of 15.08% during the forecast period (2026-2031).
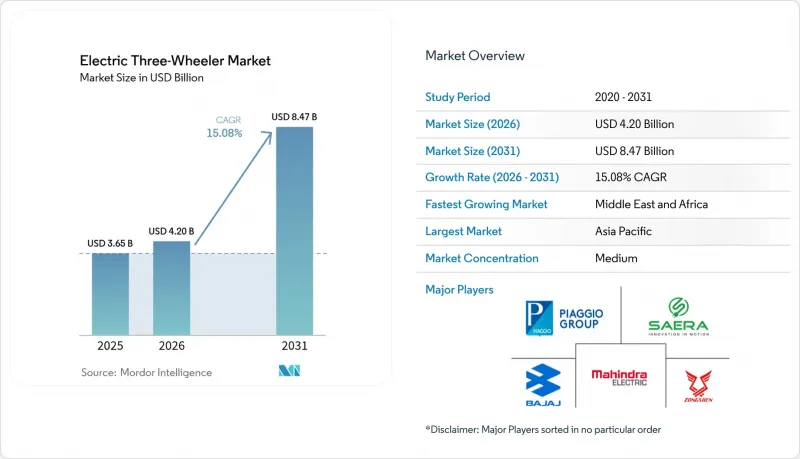
Rapid policy convergence, breakthrough total-cost-of-ownership parity, and a deepening pool of financing mechanisms are pulling demand forward in both passenger and goods carrier use cases. India's PM E-DRIVE and the proposed FAME-III programme, the United States Inflation Reduction Act commercial credits, and the EU Fit-for-55 package together sharpen the pricing edge that already exists in high-utilisation fleets. On the supply side, lithium-ion pack prices fell 12% year-over-year in 2024, narrowing the cost delta with lead-acid systems and accelerating the technology transition. Infrastructure innovation also plays a defining role: as of October 2025, Battery Smart, an Indian battery swapping network, has completed 50 million battery swaps at its 1,400 stations, reducing downtime for commercial drivers from hours to mere minutes.
Global Electric Three-Wheeler Market Trends and Insights
Extended Purchase Incentives Drive Market Acceleration
Coordinated subsidy regimes cut acquisition costs sharply. India earmarked INR 4,100 crore (USD 492 million) for electric three-wheelers under the FAME-III proposal, with phased reductions designed to prevent abrupt demand cliffs. Similar momentum builds in the US and EU, creating predictable policy horizons that support factory capacity investment. Historical evidence shows a multiplier of up to 10 times on sales during earlier incentive rounds. The resulting certainty lowers financing costs and steadies the electric three-wheeler market across regions.
E-commerce Last-mile Transformation Reshapes Demand Patterns
Surging parcel volumes are driving logistics operators to shift from two-wheelers to higher-payload three-wheelers in the Electric Three-Wheeler Market. Commercial users realise operating costs up to 2.5x lower than internal-combustion alternatives, directly boosting driver income in emerging markets. Western retailers are also testing electric quadricycles, signalling spill-over into non-Asian cities, while swap-ready batteries further enhance asset utilisation by cutting downtime to under two minutes.
Sparse Dedicated 3-W Charging Infrastructure
India operates 11,000 public chargers, barely 1% of the 1.3 million units required by 2030 in the Electric Three-Wheeler Market. Fault rates exceeding 17% dent user trust, and "charging deserts" appear even in mature regions such as Great Britain. Swap hubs provide a partial remedy, yet scale-up depends on standardisation and concessional capital flows.
Other drivers and restraints analyzed in the detailed report include:
- Rapid TCO Parity Achievement Accelerates Adoption
- Rising Li-ion Energy Density Enables Performance Breakthroughs
- Li-ion Price Volatility Creates Working-Capital queeze
For complete list of drivers and restraints, kindly check the Table Of Contents.
Segment Analysis
Passenger carriers commanded 81.65% of the electric three-wheeler market in 2025, underpinned by an entrenched shared-mobility culture in South-Asian megacities. Yet, goods carriers generate the fastest expansion at an 18.60% CAGR, reflecting the boom in last-mile logistics. The electric three-wheeler market size attributable to goods movement will thus widen rapidly through 2031.
Higher utilisation rates amplify total-cost-of-ownership benefits, encouraging fleet operators to adopt finance-plus-swap bundles that slash downtime. Rider earnings in markets such as Kenya already exceed combustion equivalents, confirming the commercial appeal. Passenger services will still post steady unit volumes, although competitive pressure from ride-hailing apps tempers their growth trajectory.
Lead-acid packs held a 63.90% share in 2025 thanks to their low entry cost, but lithium-ion systems will outpace with a 20.75% CAGR to 2031. The electric three-wheeler market share of lithium-ion batteries rises as price declines intersect with rising energy-density benchmarks. CATL's battery cost reduction from USD 110 per kWh in mid-2023 to USD 56 by mid-2024 represents a fundamental shift in technology economics that accelerates lithium-ion adoption.
LFP chemistries, offering safer thermal characteristics, gain traction in municipal and courier fleets seeking predictable duty cycles. Premium passenger operators favour high-energy nickel-rich packs that extend range above 200 km, as demonstrated by Montra Super Auto's 203 km rating.
The Electric Three-Wheeler Market Report is Segmented by End Use (Passenger Carrier and Goods Carrier), Battery Type (Lithium-Ion and Lead Acid), Power Output (Less Than 2kW, 2 -4 KW, 4 - 6 KW, and Above 6 KW), Charging Model (Fixed (Plug-In) Charging and Battery Swapping), and Geography. The Market Forecasts are Provided in Terms of Value (USD) and Volume (Units).
Geography Analysis
Asia-Pacific dominated the electric three-wheeler market with a 72.10% share in 2025. India alone sold 580,000 units in 2023, a 65% year-over-year surge on the back of FAME-II grants. Chinese suppliers, buoyed by domestic EV oversupply, channel surplus capacity into Southeast Asia, including a USD 150 million Indonesian plant by Yadea. Thailand's target of 1,450 swap stations supporting 650,000 two-wheelers by 2030 underscores state-backed infrastructure momentum.
The Middle East and Africa is the fastest-growing region at 19.55% CAGR. The UAE's penetration jumped from 0.7% in 2021 to 13% in 2023 amid 2050 net-zero goals. African markets adopt two- and three-wheelers as primary income generators; Rwanda leverages solar-powered swap hubs to overcome grid bottlenecks. Europe and North America record more measured uptake. Micro-EV imports face rising tariffs, potentially doubling prices for models such as the Eli ZERO in United States fleets. Nevertheless, urban freight initiatives and low-speed zones open niches for compact three-wheelers, sustaining 11.41% CAGR in North America.
- Mahindra Electric Mobility Ltd
- Bajaj Auto Ltd
- Piaggio & C. SpA
- YC Electric Vehicle Pvt Ltd
- Saera Electric Auto Pvt Ltd
- Kinetic Green Energy & Power Solutions Ltd
- Terra Motors Corp
- Lohia Auto Industries
- Omega Seiki Mobility
- ATUL Auto Ltd
- Euler Motors
- Altigreen Propulsion Labs
- Biliti Electric Inc
- Olectra Greentech Ltd
- TVS Motor Company Ltd
- Bodo Vehicle Group Co Ltd
- E-Tuk Factory BV
- Goenka Electric Motor Vehicles Pvt Ltd
- Chongqing Zongshen Vehicle Co Ltd
Additional Benefits:
- The market estimate (ME) sheet in Excel format
- 3 months of analyst support
TABLE OF CONTENTS
1 Introduction
- 1.1 Study Assumptions & Market Definition
- 1.2 Scope of the Study
2 Research Methodology
3 Executive Summary
4 Market Landscape
- 4.1 Market Overview
- 4.2 Market Drivers
- 4.2.1 Extended purchase incentives
- 4.2.2 E-commerce last-mile boom
- 4.2.3 Rapid TCO parity
- 4.2.4 Rising Li-ion energy density and price fall
- 4.2.5 Fin-tech micro-leasing platforms
- 4.2.6 Battery-swap corridor build-outs
- 4.3 Market Restraints
- 4.3.1 Sparse dedicated 3-W charging infrastructure
- 4.3.2 Li-ion price volatility & working-capital squeeze
- 4.3.3 Fragmented retrofit & homologation rules
- 4.3.4 Heightened safety-recall reputation risk
- 4.4 Value / Supply-Chain Analysis
- 4.5 Regulatory Landscape
- 4.6 Technological Outlook
- 4.7 Porter's Five Forces
- 4.7.1 Threat of New Entrants
- 4.7.2 Bargaining Power of Buyers
- 4.7.3 Bargaining Power of Suppliers
- 4.7.4 Threat of Substitutes
- 4.7.5 Intensity of Competitive Rivalry
5 Market Size & Growth Forecasts (Value and Volume)
- 5.1 By End Use
- 5.1.1 Passenger Carrier
- 5.1.2 Goods Carrier
- 5.2 By Battery Type
- 5.2.1 Lithium-ion
- 5.2.2 Lead Acid
- 5.3 By Power Output (kW)
- 5.3.1 Less than 2 kW
- 5.3.2 2 - 4 kW
- 5.3.3 4 - 6 kW
- 5.3.4 Above 6 kW
- 5.4 By Charging Model
- 5.4.1 Fixed (Plug-in) Charging
- 5.4.2 Battery Swapping
- 5.5 By Geography
- 5.5.1 North America
- 5.5.1.1 United States
- 5.5.1.2 Canada
- 5.5.1.3 Rest of North America
- 5.5.2 South America
- 5.5.2.1 Brazil
- 5.5.2.2 Argentina
- 5.5.2.3 Rest of South America
- 5.5.3 Europe
- 5.5.3.1 Germany
- 5.5.3.2 United Kingdom
- 5.5.3.3 France
- 5.5.3.4 Italy
- 5.5.3.5 Spain
- 5.5.3.6 Russia
- 5.5.3.7 Rest of Europe
- 5.5.4 Asia-Pacific
- 5.5.4.1 China
- 5.5.4.2 India
- 5.5.4.3 Japan
- 5.5.4.4 South Korea
- 5.5.4.5 ASEAN (Indonesia, Thailand, Vietnam, Philippines, Malaysia)
- 5.5.4.6 Rest of Asia-Pacific
- 5.5.5 Middle East & Africa
- 5.5.5.1 Middle East
- 5.5.5.1.1 GCC (Saudi Arabia, UAE, Qatar, Oman, Kuwait, Bahrain)
- 5.5.5.1.2 Turkey
- 5.5.5.1.3 Rest of Middle East
- 5.5.5.2 Africa
- 5.5.5.2.1 South Africa
- 5.5.5.2.2 Nigeria
- 5.5.5.2.3 Kenya
- 5.5.5.2.4 Rest of Africa
- 5.5.5.1 Middle East
- 5.5.1 North America
6 Competitive Landscape
- 6.1 Market Concentration
- 6.2 Strategic Moves
- 6.3 Market Share Analysis
- 6.4 Company Profiles (includes Global Level Overview, Market Level Overview, Core Segments, Financials as Available, Strategic Information, Market Rank/Share for Key Companies, Products and Services, SWOT Analysis, and Recent Developments)
- 6.4.1 Mahindra Electric Mobility Ltd
- 6.4.2 Bajaj Auto Ltd
- 6.4.3 Piaggio & C. SpA
- 6.4.4 YC Electric Vehicle Pvt Ltd
- 6.4.5 Saera Electric Auto Pvt Ltd
- 6.4.6 Kinetic Green Energy & Power Solutions Ltd
- 6.4.7 Terra Motors Corp
- 6.4.8 Lohia Auto Industries
- 6.4.9 Omega Seiki Mobility
- 6.4.10 ATUL Auto Ltd
- 6.4.11 Euler Motors
- 6.4.12 Altigreen Propulsion Labs
- 6.4.13 Biliti Electric Inc
- 6.4.14 Olectra Greentech Ltd
- 6.4.15 TVS Motor Company Ltd
- 6.4.16 Bodo Vehicle Group Co Ltd
- 6.4.17 E-Tuk Factory BV
- 6.4.18 Goenka Electric Motor Vehicles Pvt Ltd
- 6.4.19 Chongqing Zongshen Vehicle Co Ltd
7 Market Opportunities & Future Outlook
- 7.1 White-space & Unmet-Need Assessment
