|
시장보고서
상품코드
2043892
타워 크레인 : 시장 점유율 분석, 업계 동향 및 통계, 성장 예측(2026-2031년)Tower Cranes - Market Share Analysis, Industry Trends & Statistics, Growth Forecasts (2026 - 2031) |
||||||
 Mordor Intelligence
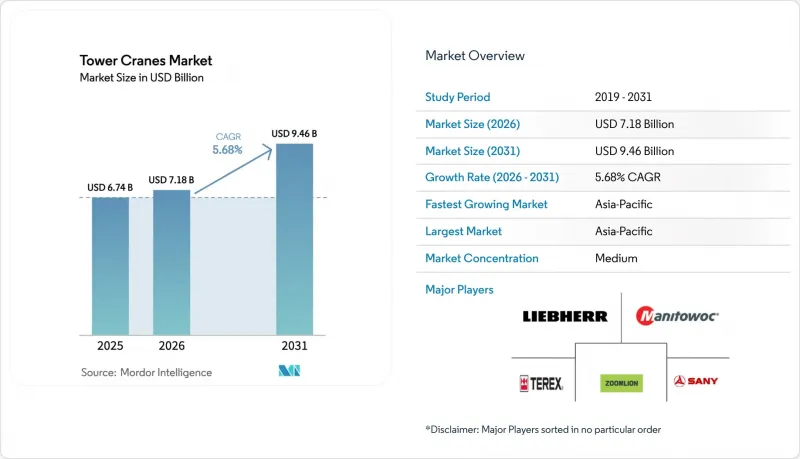
타워 크레인 시장 규모는 2025년에 67억 4,000만 달러로 평가되었습니다. 2026년 71억 8,000만 달러에서 2031년까지 94억 6,000만 달러에 이를 것으로 예상되며, 예측 기간(2026-2031년) CAGR은 5.68%를 나타낼 전망입니다.
아시아태평양의 도시철도의 견고한 정비, 걸프 지역의 야심찬 거대 프로젝트, EU의 무공해 규제 강화는 단기적인 수요의 기반이 되고 있습니다. 그러나 수요 구조는 변화하고 있습니다. 중국 내 초고층 빌딩의 완공 속도가 둔화되는 한편, 정체된 프로젝트가 증가함에 따라 국내 크레인 그룹은 해외에서 일감을 찾아야 하는 상황에 처했습니다. 렌탈 시장의 침투, 디지털 트윈의 도입, 전기화 의무화 움직임은 전통적인 소유 모델이 적응할 수 있는 속도보다 더 빠른 속도로 조달 트렌드를 형성하고 있습니다. 경쟁 우위는 점점 더 예측 유지 보수 소프트웨어, 배터리 하이브리드 동력 장치 및 모듈 식 건설 일정에 대응할 수있는 중간 용량 크레인의 투입 능력에 점점 더 의존하고 있습니다.
세계의 타워 크레인 시장 동향 및 인사이트
급속한 도시화와 초고층 건축 붐
초고층건축 및 도시주거환경위원회(CTBUH)의 집계에 따르면, 2025년까지 전 세계적으로 200미터가 넘는 건물이 2,583개가 완공되었고, 같은 해에 141개가 새로 추가되었습니다. 이들 준공 건수의 65%를 중국이 차지했지만, 259건의 프로젝트가 정체되어 있어 착공과 실제 크레인 가동률 사이에 괴리가 발생하고 있는 것으로 나타났습니다. 평균 준공 기간이 5.8년으로 늘어나면서 임대 기간이 길어지고, 유지보수 네트워크가 잘 갖춰진 기업으로의 가치 전환이 이루어지고 있습니다. 초고층 빌딩 건설 활동은 걸프 지역으로 옮겨가고 있으며, 1,000m 높이의 제다 타워와 725m 높이의 부르즈 아지즈가 수년에 걸친 프로젝트의 주축이 되고 있습니다. 울프크란(Wolffkran)과 같이 리야드나 두바이에 서비스 기지를 설립한 OEM 업체들은 이러한 전환을 포착할 수 있는 좋은 위치에 있습니다. 반면, 국내 고층 빌딩 건설 사이클에 지나치게 의존했던 중국 브랜드는 해외에서 가동률 하락에 직면하고 있습니다.
아시아 및 GCC의 인프라 부양책
중국의 일대일로 이니셔티브는 2024년 707억 달러 규모의 건설 계약을 수주했으며, 중동은 390억 달러로 아프리카를 제치고 가장 큰 수주 지역으로 부상했습니다. 인도의 지하철망은 945km에 달하며, 939km가 건설 중이고, 고속도로 계획은 하루 평균 34km의 건설이 진행되고 있습니다. NEOM과 The Line을 필두로 한 사우디의 '비전 2030' 계획이 실현되면 약 2만 대의 타워 크레인이 필요할 것으로 보입니다. 대규모의 중복된 인프라 계획은 수년간 수요를 보장하고 있지만, 자금 조달 지연에서 인력 부족에 이르기까지 실행 리스크가 표면적인 수치를 억제하고 있습니다.
철강 가격 및 공급망 변동
미국 노동 통계국 데이터에 따르면, 크레인 부품 생산자 물가지수는 2024년 12월부터 2025년 3월까지 10% 상승했습니다. 2026년 발효 예정인 섹션 232 관세의 연장으로 인해 수입 이동식 크레인의 철강재 부분에 대해 약 50%의 관세가 부과되어 타워 크레인에 대한 연쇄적인 비용 압박이 우려되고 있습니다. 한편, 유럽 제조업체들은 미국 평균의 몇 배에 달하는 전력 비용에 직면하고 있으며, 전기 모델이라 할지라도 수익률이 압박을 받고 있습니다. 중국 OEM 업체들은 관세를 피하기 위해 사우디와 UAE에서 현지 조립을 진행하고 있지만, 지리적 분산으로 인해 재고 보유 비용이 증가하고 부품 물류의 복잡성이 증가하고 있습니다.
부문 분석
플랫탑 디자인은 2025년 매출의 46.37%를 차지했습니다. 칼라리스 마스트 구조로 인해 여러 개의 유닛이 서로 간섭하지 않고 지브를 겹칠 수 있어 고층 건물이 밀집된 지역에서 중요한 이점이 있습니다. 자립형 타워 크레인 시장은 CAGR 7.52%를 나타낼 것으로 예측되며, 유럽과 북미의 주택 건설업체들이 외부 조립 크레인을 필요로 하지 않는 1일 설치 방식을 채택함에 따라 다른 모든 유형을 능가하는 성장률을 나타낼 것으로 예측됩니다.
Manitowoc의 Potan Hup 40-30(4톤, 30미터 지브)과 같은 자립형 크레인은 설치 시작부터 하역 시작까지의 시간을 수일에서 수 시간으로 단축하여 인건비 및 도로 폐쇄 허가 취득을 줄일 수 있습니다. 한편, SANY의 STT3330 플랫 탑은 3,300 톤 미터, 후크 높이가 330 미터에 도달하여 용량 상한선이 계속 상승하고 있음을 보여줍니다. 러핑 지브식 크레인은 공항 주변의 엄격한 상공 사용 제한 구역에서의 작업에 대응하고 있습니다. 동시에 초고층 건축의 틈새 시장에서는 건물 내 승강식 크레인이 여전히 필수적이지만, 그 수주 동향은 현재 걸프만 국가 프로젝트에 집중되어 있습니다.
2025년에는 6-10톤급 크레인이 매출의 37.25%를 차지하며 타워 크레인 시장에서 가장 큰 점유율을 차지했습니다. 조립식 외벽과 모듈러 포드의 리프팅 작업은 이 무게 범위를 거의 초과하지 않기 때문에 CAGR은 6.88%로 예측됩니다. 11-16톤급 타워 크레인 시장 규모도 모듈화 추세의 수혜를 받고 있지만, 더 무거운 화물을 취급하려면 허가를 받기까지 리드타임이 길어지기 때문에 성장 속도는 완만합니다.
리프헬의 550 EC-B 12 Fiber(12톤, 70m 지브)는 4톤의 선단 하중으로 미드레인지의 최적 밸런스를 실현하고 있으며, 볼프크란의 7534.16은 설치 면적을 확대하지 않고도 16톤까지 대응합니다. 25톤 이상이 되면 가동이 간헐적이고 프로젝트 특화형으로 전환됩니다. SANY의 STT2400(2,400톤급)은 스카이라인을 특징짓는 주요 프로젝트와 산업용 중량물 운반 작업에서만 수익을 낼 수 있습니다. 하위 모델로는 5톤 미만의 자체 조립식 크레인이 유럽의 타운하우스 개보수 공사에서 증가하는 추세이지만, 아시아에서는 여전히 미미한 존재입니다. 아시아에서는 노동자 친화적인 규제와 높은 부지 밀도로 인해 대형 공유 유닛이 여전히 선호되고 있기 때문입니다.
지역별 분석
아시아태평양은 중국의 55개 도시에 걸친 10,287km에 달하는 지하철망과 인도의 복선전철 및 지하철 건설 붐으로 인해 가장 많은 크레인 수요를 담당하고 있습니다. 그러나 중국공급과잉으로 인해 2024년에는 임대료가 20% 하락했으며, 업체들은 필리핀, 베트남 및 걸프만 국가들의 프로젝트로 장비를 재배치할 수밖에 없는 상황입니다. 초고층 빌딩의 준공은 둔화되는 반면 착공은 계속되고 있어, 건설 활동의 표면적인 활황과 실제 타워 크레인 가동 시간 사이에 괴리가 발생하고 있습니다. 중동은 잉여 설비를 흡수하고 있으며, 사우디아라비아의 '비전 2030' 회랑과 UAE의 끊임없이 확장되는 두바이 스카이라인이 그 속도를 주도하고 있습니다. 볼프크란의 리야드 합작법인은 이미 90대의 입찰을 진행했으며, 이는 이 지역의 서비스 네트워크의 우위를 반영하고 있습니다. 실행 리스크는 여전히 남아있습니다. 제다 타워는 몇 년 동안 중단되었습니다가 2024년에야 겨우 재가동되어, 일정의 가변성을 강조하고 있습니다.
유럽의 전망은 규제가 가장 큰 과제입니다. EU의 기계류 규정 2023/1230 및 건설 제품 규정 2024/3110에 따라 수입업체는 디지털 여권 및 수명주기 관련 의무가 부과되어 컴플라이언스 비용이 8-12% 절감될 것으로 예측됩니다. 독일, 프랑스, 영국이 수요의 중심이지만, 2024년 EU 건설시장은 2.1% 축소되어 전망이 둔화되었습니다. 북해 해상 풍력 발전용 기초 공사는 전체 건설 산업의 침체에도 불구하고 특수 타워형 및 래퍼형 크레인에 대한 수요를 지탱하고 있습니다. 북미에서는 철강 관세로 인해 이동식 크레인 비용이 최대 45%까지 상승하고 있으며, 이는 간접적으로 다년간의 고층 빌딩 프로젝트에서 건설업체들이 타워 크레인 모델로 전환하도록 유도하고 있습니다. 장비 렌탈 수입은 역대 최고치를 기록했지만, 기업이 소유를 중요시하지 않아 보유 대수는 감소했습니다. '인프라 투자 및 고용법'의 자금이 주택시장 둔화를 완화하고, 교량 및 철도 프로젝트가 지속적으로 진행되고 있습니다.
남미의 성장은 2026년까지 200만 채의 주택 건설을 목표로 하는 브라질의 '성장 가속화 프로그램'의 부활과 상파울루의 여러 노선 지하철 연장 계획에 달려있습니다. 그러나 환율 변동과 숙련된 노동력 공급의 불균형으로 인해 전망이 불투명합니다. 아프리카는 여전히 개발 중이며, 남아공과 나이지리아의 광산 갱도 및 일부 초고층 빌딩 프로젝트가 주요한 밝은 재료가 되고 있습니다.
기타 혜택 :
- 엑셀 형식 시장 예측(ME) 시트
- 3개월간 애널리스트 지원
자주 묻는 질문
목차
제1장 서론
제2장 조사 방법
제3장 주요 요약
제4장 시장 구도
제5장 시장 규모와 성장 예측(금액 및 수량)
제6장 경쟁 구도
제7장 시장 기회와 향후 전망
KTH 26.05.29The tower cranes market size was valued at USD 6.74 billion in 2025 and is estimated to grow from USD 7.18 billion in 2026 to reach USD 9.46 billion by 2031, at a CAGR of 5.68% during the forecast period (2026-2031).
Robust urban rail build-outs in the Asia-Pacific, ambitious giga-projects across the Gulf, and tightening EU zero-emission rules anchor near-term demand. Yet the volume picture is shifting: Chinese super-tall completions slowed while stalled projects climbed, pushing domestic fleets to seek work abroad. Rental penetration, digital-twin deployment, and electrification mandates are now shaping procurement faster than traditional ownership models can adapt. Competitive advantage increasingly rests on predictive-maintenance software, battery-hybrid power units, and the ability to mobilize mid-capacity cranes for modular construction schedules.
Global Tower Cranes Market Trends and Insights
Rapid Urbanization and Super-Tall Construction Boom
The Council on Tall Buildings and Urban Habitat tallied 2,583 buildings above 200 m completed globally by 2025, with 141 new additions that year. China accounted for 65% of these completions, yet 259 other projects stalled, exposing a decoupling of groundbreaks from actual crane utilization. Average completion times stretched to 5.8 years, lengthening rental tenures and shifting value toward firms with deep maintenance networks. High-rise activity is migrating to the Gulf, where the resumed 1,000 m Jeddah Tower and 725 m Burj Azizi anchor multiyear pipelines. OEMs with established Riyadh or Dubai service hubs, such as Wolffkran, are positioned to capture this pivot. In contrast, Chinese brands that over-indexed on domestic tall-building cycles face utilisation gaps abroad.
Infrastructure Stimulus Programs in Asia and GCC
China's Belt and Road Initiative booked USD 70.7 billion of construction contracts in 2024, with the Middle East replacing Africa as the top recipient at USD 39 billion. India's metro footprint reached 945 km in service, with another 939 km underway, while its highway program averages 34 km of construction per day. Saudi Arabia's Vision 2030 slate, led by NEOM and The Line, could need roughly 20,000 tower cranes if plans materialize. Large, overlapping infrastructure schemes lock in multiyear demand, although execution risks, ranging from funding delays to labor shortages, temper the headline numbers.
Steel Price and Supply-Chain Volatility
U.S. Bureau of Labor Statistics data show the crane-parts producer-price index jumping 10% between December 2024 and March 2025. Section 232 tariff extensions set to take effect in 2026 will apply a roughly 50% tax on the steel content of imported mobile cranes, raising concerns about cascading cost pressure on tower units. European fabricators, meanwhile, face electricity costs several multiples of U.S. averages, squeezing margins even on electric-drive models. Chinese OEMs respond by localizing assembly in Saudi Arabia and the UAE to dodge tariffs, but geographic dispersion increases inventory carrying costs and parts logistics complexity.
Other drivers and restraints analyzed in the detailed report include:
- Shift to Rental Model Among Contractors
- Digital-Twin, IoT, and Remote Operation Adoption
- Stricter EU/OSHA Safety Compliance Costs
For complete list of drivers and restraints, kindly check the Table Of Contents.
Segment Analysis
Flat-top designs delivered 46.37% of 2025 revenue. Their collar-free mast segments allow multiple units to overlap jibs without interference, a key benefit in dense high-rise clusters. The tower crane market for self-erecting models is projected to grow at a 7.52% CAGR, outpacing all other types as European and North American residential contractors adopt single-day set-ups that bypass external erection cranes.
Self-erectors such as Manitowoc's Potain Hup 40-30 (4 t, 30 m jib) compress start-to-lift timelines from days to hours, saving labor and street-closure permits. Meanwhile, SANY's STT3330 flat-top reaches 3,300 t-m and 330 m hook height, underscoring that capacity ceilings continue to rise. Luffing-jib units defend tight air rights corridors near airports. At the same time, climbable in-building cranes remain indispensable for the mega-tall niche, though their order flow now centres on Gulf state projects.
Cranes rated 6-10 ton captured 37.25% of revenue in 2025, the most significant slice of the tower cranes market. Prefabricated facade and modular pod lifts rarely exceed this window, explaining a 6.88% forecast CAGR. The tower crane market size for the 11-16 ton bracket also benefits from modular trends, but grows more slowly as heavier picks require more extended permit lead times.
Liebherr's 550 EC-B 12 Fiber (12 t, 70 m jib) hits the mid-range sweet spot with four-ton tip loads, while Wolffkran's 7534.16 pushes to 16 t without enlarging the ground footprint. Above 25 t, utilization turns episodic and project-specific-SANY's STT2400 (2,400 t-m) only pays off on skyline-defining cores or industrial heavy-lift jobs. At the low end, sub-5 t self-erectors are growing in Europe's townhouse renovations but remain marginal in Asia, where labor-friendly regulations and higher site densities still favor larger, shared units.
The Tower Cranes Market Report is Segmented by Crane Type (Hammerhead and More), Lifting Capacity (Up To 5 Ton and More), Design (Top-Slewing and Bottom-Slewing), Application (Residential Buildings and More), End User (Construction Companies, Rental Companies, and More), and Geography (North America, South America, Europe, and More). The Market Forecasts are Provided in Terms of Both Value (USD) and Volume (Units).
Geography Analysis
Asia-Pacific shoulders the highest crane volumes due to China's 10,287 km operational metro grid across 55 cities and India's twin-track rail and metro boom. Yet oversupply in China drove a 20% erosion in rental rates in 2024, compelling fleets to redeploy into the Philippines, Vietnam, and Gulf projects. Super-tall completions slowed even as starts linger, decoupling headline construction activity from actual tower-crane hours. The Middle East soaks up excess capacity, with Saudi Arabia's Vision 2030 corridor and the UAE's ever-expanding Dubai skyline setting the pace. Wolffkran's new Riyadh joint venture has already bid for 90 units, reflecting the region's service network premium. Execution risk remains: Jeddah Tower only resumed in 2024 after a multiyear pause, underscoring schedule volatility.
Europe's outlook is regulatory-heavy. The EU Machinery Regulation 2023/1230 and Construction Products Regulation 2024/3110 layer digital passport and life-cycle duties on importers, reducing compliance spend by 8-12%. Germany, France, and the UK concentrate demand, but EU construction contracted 2.1% in 2024, tempering prospects. Offshore wind foundations in the North Sea support specialized tower and luffer demand despite broader building weakness. North America wrestles with steel tariffs that inflate mobile-crane costs by up to 45%, indirectly nudging contractors toward tower models for multi-year high-rise jobs. Equipment-rental revenues hit record highs, yet fleet counts slipped as firms de-emphasized ownership. Infrastructure Investment and Jobs Act funds cushion any residential slowdown, keeping bridge and rail projects in the queue.
South America's growth hinges on Brazil's revived Growth Acceleration Program, targeting 2 million housing units by 2026, and on multi-line Sao Paulo metro extensions. However, currency swings and uneven skill availability blur the outlook. Africa remains nascent, with mining shafts and select skyline projects in South Africa and Nigeria the main bright spots.
- Liebherr Group
- Zoomlion Heavy Industry Science&Technology Co., Ltd.
- XCMG Group
- SANY Group
- The Manitowoc Company, Inc.
- Terex Corporation
- Wolffkran International
- Comansa
- JASO Tower Cranes
- Raimondi Cranes
- Action Construction Equipment
- Sarens n.v.
- Maxim Crane Works
- Favelle Favco Berhad
- Fushun Yongmao
- FM Gru
- Saez Cranes
- Wilbert Tower Cranes
- Bigge Crane & Rigging
- NFT Group
Additional Benefits:
- The market estimate (ME) sheet in Excel format
- 3 months of analyst support
TABLE OF CONTENTS
1 Introduction
- 1.1 Study Assumptions and Market Definition
2 Research Methodology
3 Executive Summary
4 Market Landscape
- 4.1 Market Overview
- 4.2 Market Drivers
- 4.2.1 Rapid Urbanization and Super-Tall Construction Boom
- 4.2.2 Infrastructure Stimulus Programmes In Asia and GCC
- 4.2.3 Shift To Rental Model Among Contractors
- 4.2.4 Digital-Twin, IoT and Remote-Operation Adoption
- 4.2.5 Electrification Mandates For Zero-Emission Sites
- 4.2.6 Advancements In Safety And Automation Technologies
- 4.3 Market Restraints
- 4.3.1 Steel Price and Supply-Chain Volatility
- 4.3.2 Skilled Operator Shortage and Ageing Workforce
- 4.3.3 Stricter EU/OSHA Safety Compliance Costs
- 4.3.4 Competition From High-Capacity Mobile Cranes In Mid-Rise Jobs
- 4.4 Value/Supply-Chain Analysis
- 4.5 Regulatory Landscape
- 4.6 Technological Outlook
- 4.7 Porter's Five Forces
- 4.7.1 Threat of New Entrants
- 4.7.2 Bargaining Power of Suppliers
- 4.7.3 Bargaining Power of Buyers
- 4.7.4 Threat of Substitutes
- 4.7.5 Competitive Rivalry
5 Market Size and Growth Forecasts (Value and Volume)
- 5.1 By Crane Type
- 5.1.1 Hammerhead Cranes
- 5.1.2 Flat-Top Cranes
- 5.1.3 Luffing Jib Cranes
- 5.1.4 Self-Erecting Cranes
- 5.1.5 Climbable Tower Cranes
- 5.2 By Lifting Capacity
- 5.2.1 Up to 5 ton
- 5.2.2 6-10 ton
- 5.2.3 11-16 ton
- 5.2.4 17-25 ton
- 5.2.5 Above 25 ton
- 5.3 By Design
- 5.3.1 Top-Slewing
- 5.3.2 Bottom-Slewing
- 5.4 By Application
- 5.4.1 Residential Buildings
- 5.4.2 Commercial Buildings
- 5.4.3 Infrastructure Projects
- 5.4.4 Mining and Excavation
- 5.4.5 Industrial Projects
- 5.4.6 Marine/Offshore
- 5.5 By End User
- 5.5.1 Construction Companies
- 5.5.2 Rental Companies
- 5.5.3 Industrial Operators
- 5.5.4 Others
- 5.6 By Geography
- 5.6.1 North America
- 5.6.1.1 United States
- 5.6.1.2 Canada
- 5.6.1.3 Rest of North America
- 5.6.2 South America
- 5.6.2.1 Brazil
- 5.6.2.2 Argentina
- 5.6.2.3 Rest of South America
- 5.6.3 Europe
- 5.6.3.1 Germany
- 5.6.3.2 United Kingdom
- 5.6.3.3 France
- 5.6.3.4 Italy
- 5.6.3.5 Spain
- 5.6.3.6 Rest of Europe
- 5.6.4 Asia-Pacific
- 5.6.4.1 China
- 5.6.4.2 India
- 5.6.4.3 Japan
- 5.6.4.4 South Korea
- 5.6.4.5 Rest of Asia-Pacific
- 5.6.5 Middle East and Africa
- 5.6.5.1 United Arab Emirates
- 5.6.5.2 Saudi Arabia
- 5.6.5.3 South Africa
- 5.6.5.4 Turkey
- 5.6.5.5 Rest of Middle East and Africa
- 5.6.1 North America
6 Competitive Landscape
- 6.1 Market Concentration
- 6.2 Strategic Moves
- 6.3 Market Share Analysis
- 6.4 Company Profiles (Includes Global level Overview, Market level overview, Core Segments, Financials as available, Strategic Information, Market Rank/Share, Products and Services, Recent Developments)
- 6.4.1 Liebherr Group
- 6.4.2 Zoomlion Heavy Industry Science&Technology Co., Ltd.
- 6.4.3 XCMG Group
- 6.4.4 SANY Group
- 6.4.5 The Manitowoc Company, Inc.
- 6.4.6 Terex Corporation
- 6.4.7 Wolffkran International
- 6.4.8 Comansa
- 6.4.9 JASO Tower Cranes
- 6.4.10 Raimondi Cranes
- 6.4.11 Action Construction Equipment
- 6.4.12 Sarens n.v.
- 6.4.13 Maxim Crane Works
- 6.4.14 Favelle Favco Berhad
- 6.4.15 Fushun Yongmao
- 6.4.16 FM Gru
- 6.4.17 Saez Cranes
- 6.4.18 Wilbert Tower Cranes
- 6.4.19 Bigge Crane & Rigging
- 6.4.20 NFT Group
7 Market Opportunities and Future Outlook
- 7.1 White-space and Unmet-Need Assessment