

|
시장보고서
상품코드
2044025
트레이드 프로모션 최적화 AI : 시장 점유율 분석, 업계 동향 및 통계, 성장 예측(2026-2031년)Trade Promotion Optimization AI - Market Share Analysis, Industry Trends & Statistics, Growth Forecasts (2026 - 2031) |
||||||
 Mordor Intelligence
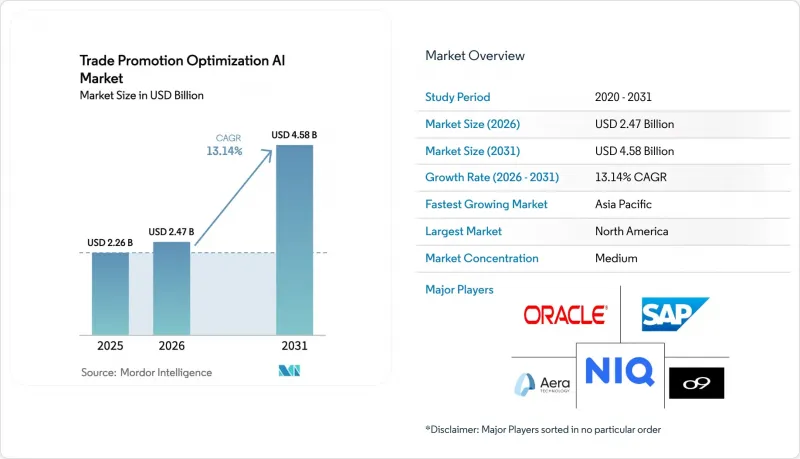
트레이드 프로모션 최적화 AI시장 규모는 2025년에 22억 6,000만 달러로 평가되었습니다. 2026년 24억 7,000만 달러에서 2031년까지 45억 8,000만 달러에 이를 것으로 예상되며, 예측 기간(2026-2031년) CAGR은 13.14%를 나타낼 전망입니다.
각 브랜드는 직관에 기반한 계획에서 모든 프로모션 비용을 정량화하는 알고리즘에 의한 의사결정으로 예산 배분을 전환하고 있으며, 이러한 전환은 가격 책정, 재고 및 제품군 결정을 통합하는 에이전트 기반 플랫폼에 의해 촉진되고 있습니다. 클라우드 인프라의 비용 절감으로 인해 과거에는 대기업만 가능했던 고도의 시뮬레이션을 소규모 소비재 제조업체도 실행할 수 있게 되었습니다. 한편, 소매업체들은 실시간 탄력성 모델을 요구함으로써 퍼스트 파티 데이터를 수익화하고 있습니다. 생성형 AI는 시나리오 계획 주기를 몇 주에서 몇 분으로 단축하고, 진열대 라벨을 하나라도 변경하기 전에 수천 개의 오퍼를 가상으로 테스트할 수 있게 해줍니다. 페더럴 러닝과 같은 프라이버시 보호 기술은 유럽과 북미에서 확산되고 있으며, 벤더들이 모델의 성능을 희생하지 않고도 강화되는 데이터 규제 체제를 준수할 수 있도록 돕고 있습니다.
세계의 트레이드 프로모션 최적화 AI 시장 동향 및 인사이트
고정밀 POS 데이터 가용성 확대
전자가격표시기와 통합 커머스 플랫폼은 SKU 단위의 거래 데이터를 분 단위로 스트리밍하여 머신러닝 모델에 연료를 공급하여 실험실 수준의 정확도로 카테고리 간 효과를 계산할 수 있도록 합니다. 월마트의 도입으로 가격 변경 주기가 며칠에서 몇 분으로 단축된 반면, 알리바바의 Hema는 약 1,000개의 라벨을 23초 만에 업데이트하여 대형마트 규모의 빠른 피드백 루프가 현실화되었음을 증명했습니다. Nielsen IQ의 2025년 Gastrograph AI 인수를 통해 이 데이터 스택에 감각적 선호도 예측을 통합하여 카테고리 팀은 파일럿을 실행하기 전에 가상으로 맛의 개념을 테스트할 수 있게 되었습니다. 포인트 카드, 실시간 재고, 경쟁사 데이터 수집이 교차하면서 판촉 계획은 분기별 스프레드시트를 통한 관리에서 거의 실시간 최적화로 대체되는 지속적인 제어 루프로 변모하고 있습니다.
GenAI를 활용한 예측 알고리즘의 급속한 발전
과거 언어 처리 작업에 사용되던 트랜스포머 아키텍처는 현재 저빈도 카테고리의 구매 확률을 예측하여 규칙 기반 엔진을 괴롭혀온 콜드 스타트 문제를 해결하고 있습니다. 도시바테크는 2024년 프로모션 최적화 소프트웨어에 생성형 모듈을 직접 내장하여 엄격한 예산 제한 하에서도 1 : 1 쿠폰 배분을 가능하게 했습니다. 2026년 액센츄어 벤처스의 지원을 받은 Profitmind의 에이전트 AI는 이익에 미치는 영향과 연동된 가격, 재고, 구색 변경을 결합하여 우선순위가 지정된 주간 액션 리스트를 생성하고 분석과 실행을 단일 워크플로우로 통합합니다. 시장의 흐름은 인사이트 생성에서 사람의 재입력 없이 루프를 닫는 자동화된 의사결정으로 이동하고 있습니다.
레거시 ERP 통합의 복잡성
배치 처리 아키텍처를 기반으로 구축된 SAP와 Oracle의 시스템은 실시간 데이터 수집을 지원하지 않아 기업은 미들웨어와 변환 파이프라인을 조합하여 대응할 수밖에 없었고, 그 결과 도입 기간이 길어지고 있습니다. 한 업계 조사에 따르면, 83%의 소매업체가 사일로화된 데이터를 통합하는 데 어려움을 겪고 있으며, 이는 '플러그 앤 플레이'를 표방하는 마케팅 주장 뒤에 숨어있는 숨겨진 비용을 강조하고 있습니다. 인포시스의 TradeEdge 모듈은 이 문제를 해결하는 좋은 예입니다. 매일 밤 ERP 로그와 스트리밍 피드를 대조하여 최적화 엔진에 공급하면서 감사 추적을 유지합니다. 표준화된 커넥터가 성숙하기 전까지는 통합의 마찰로 인해 원래 견조한 성장이 예상되는 판촉 최적화 AI 시장의 성장이 둔화될 것입니다.
부문 분석
2025년 매출 중 클라우드가 62.73%를 차지했으며, 이는 스트리밍 형태의 POS 피드 처리 및 온디맨드 컴퓨팅 성능 제공에 있어 클라우드의 효율성을 강조하고 있습니다. 클라우드 도입에 있어 판매 촉진 최적화 AI 시장 규모는 2026년부터 2031년까지 예측 기간 동안 CAGR 21.34%를 나타낼 것으로 예측됩니다. 이러한 성장으로 클라우드 기반 솔루션과 기존 On-Premise형 시스템과의 격차는 더욱 확대될 것으로 예측됩니다. 기업들은 가치 실현 시간 단축, 탄력적인 확장성 지원, 설비 투자를 크게 줄일 수 있다는 장점으로 인해 클라우드 솔루션을 점점 더 많이 채택하고 있습니다. 또한, 규제 당국이 데이터 거주 요건을 준수하는 지역 분할형 클라우드 인프라를 점점 더 많이 허용하고 있는 것도 클라우드 도입을 더욱 촉진하고 있습니다.
아시아태평양은 클라우드 도입의 이점을 여실히 보여주고 있습니다. 예를 들어, 인도에서 진행 중인 소매업의 디지털화 이니셔티브는 기존의 On-Premise형 서버 환경을 완전히 배제하는 그린필드 도입을 촉진하고 있습니다. 마찬가지로, 일본의 일본 액세스(Japan Access)는 클라우드 네이티브 가격 책정 AI 솔루션을 활용하여 6%에서 20%의 이익 증가를 달성했다고 보고했습니다. 보안 문제를 해결하기 위해 각 벤더들은 기밀성이 높은 마스터 데이터는 On-Premise에 보관하고, 모델 트레이닝은 클라우드를 활용하는 하이브리드 클라우드 모델을 도입하고 있습니다. 이러한 접근 방식을 통해 데이터 보안과 컴플라이언스가 매우 중요한 제약 산업과 같이 규제가 엄격한 산업에서도 클라우드를 도입할 수 있게 되었습니다.
2025년에는 솔루션이 매출의 58.23%를 차지했으며, 최적화 엔진과 분석 대시보드의 구독 라이선스가 주류를 이루었습니다. 그러나 서비스 부문은 CAGR 21.32%로 성장하고 있습니다. 이는 기업들이 변경 관리, 데이터 클렌징, 지속적인 모델 튜닝이 투자 대비 효과를 결정짓는다는 것을 인식하고 있기 때문입니다. 판매 촉진 최적화 AI 업계 컨설팅 회사들은 도입을 촉진하고 재무적 성과를 보장하기 위해 머천다이징 부서 내에 스프린트 팀을 배치하고 있습니다.
2026년 비용 절감 청사진은 절감액을 예산에 직접 반영하는 혁신 관리 사무소 설립을 강조하고 있으며, 소프트웨어 솔루션만으로는 충분하지 않음을 보여주고 있습니다. Wipro와 RELEX의 파트너십은 플랫폼 도입과 전담 구현 팀을 결합하고, NEC는 카테고리 관리자를 위해 알고리즘 출력을 해석하는 관리형 서비스 데스크를 제공합니다. NEC는 소매 가격 최적화 솔루션에서 AI 기반 가격 책정 모델과 비즈니스 프로세스 아웃소싱을 융합하고 있습니다. 전담 가격 책정 팀은 이러한 제안을 운영할 뿐만 아니라, 머천다이저에게 그 근거를 설명하고, 성과 분석도 수행합니다. 이러한 접근방식은 NEC의 제공 서비스가 단순한 도구 판매가 아닌 성과 창출에 중점을 둔 모델임을 강조하고 있습니다.
지역별 분석
2025년에는 북미가 매출의 41.37%를 차지하며 시장을 주도했습니다. 이는 성숙한 POS 인프라, 소매업체의 미디어 네트워크, 그리고 포춘 500대 소비재(CPG) 기업의 조기 도입이 반영된 결과입니다. 이 지역의 우위는 고도의 기술 통합과 전략적 의사결정을 위해 데이터를 활용할 수 있는 소매업체의 능력에 의해 뒷받침되고 있습니다. Kroger Precision Marketing의 클로즈드 루프 어트리뷰션과 Target의 AI 로드맵은 소매업체들이 데이터를 서비스화하여 수익을 창출하고 있으며, 브랜드 기업들은 프로모션 예산을 알고리즘에 의한 ROI 벤치마크와 일치시켜야 합니다. 벤치마크에 맞추어 프로모션 예산을 조정할 것을 요구하고 있습니다. 또한, 식료품 매출의 21%를 넘어선 개인 브랜드의 침투로 경쟁이 치열해지면서 시장 점유율과 수익성을 유지하려는 기업에게 프로모션의 정교한 계산은 전략적으로 필수적인 요건이 되고 있습니다.
유럽은 2위를 차지했지만, GDPR(EU 개인정보보호규정)의 제약으로 인해 벤더들이 페더레이티드 러닝과 설명 가능한 대시보드로 전환해야 하는 과제를 안고 있습니다. 독일과 네덜란드의 소매업체들은 엄격한 데이터 보호 규정을 준수하기 위해 원시 데이터를 출력하지 않고 리프트를 계산하는 프라이버시 보호 아키텍처를 시험적으로 도입하고 있습니다. 유럽에서 프로모션 최적화 AI 시장 점유율은 여전히 크지만, 컴플라이언스 대응 프로세스로 인해 조달 결정의 타임라인이 길어지면서 북미에 비해 성장세가 뒤쳐지고 있습니다. 이러한 도전에도 불구하고, 이 지역은 규제 요건과 고급 분석의 필요성의 균형을 맞추기 위한 혁신적인 솔루션에 지속적으로 투자하고 있으며, 이는 시장의 지속적인 발전을 보장하고 있습니다.
아시아태평양은 디지털 네이티브 소매업체, 가처분 소득 증가, 정부의 AI 추진 정책에 힘입어 CAGR 18.23%로 가장 빠르게 성장하고 있는 지역입니다. 인도 소매 부문에서는 새로 도입된 클라우드 네이티브 최적화 도구에 대한 수요가 높은 것으로 나타났습니다. 중국에서는 전국적인 AI 도입으로 매장 자동화가 가속화되고 있으며, 일본 로손은 트랜스포머 기반 엔진을 활용하여 신규 매장의 미디어 예산을 배분하고 있습니다. 남미, 중동 및 아프리카에서는 지역별로 진전을 보이고 있습니다. 브라질의 대형마트와 UAE의 편의점 체인에서 다이내믹 프라이싱을 시범적으로 도입하고 있지만, 데이터 파편화와 낮은 분석 능력으로 인해 지역 전체로 확산되지 못하고 있습니다.
기타 혜택 :
- 엑셀 형식 시장 예측(ME) 시트
- 3개월간 애널리스트 지원
자주 묻는 질문
목차
제1장 서론
제2장 조사 방법
제3장 주요 요약
제4장 시장 구도
제5장 시장 규모와 성장 예측
제6장 경쟁 구도
제7장 시장 기회와 향후 전망
KTH 26.05.29The trade promotion optimization AI market size was valued at USD 2.26 billion in 2025 and estimated to grow from USD 2.47 billion in 2026 to reach USD 4.58 billion by 2031, at a CAGR of 13.14% during the forecast period (2026-2031).
Brands are shifting budgets from intuition-based planning to algorithmic decisioning that quantifies every promotional dollar, a pivot reinforced by agentic platforms that unify pricing, inventory, and assortment decisions. Declining cloud infrastructure costs let even small consumer-packaged goods labels run advanced simulations once reserved for Tier-1 enterprises, while retailers monetize first-party data by demanding real-time elasticity models. Generative AI is shortening scenario-planning cycles from weeks to minutes, enabling thousands of offers to be tested virtually before a single shelf tag changes. Privacy-preserving techniques such as federated learning are gaining traction in Europe and North America, helping vendors comply with tightening data-regulation regimes without sacrificing model performance.
Global Trade Promotion Optimization AI Market Trends and Insights
Growing Availability of High-Fidelity Point-of-Sale Data
Electronic shelf labels and unified-commerce platforms stream SKU-level transactions at minute-by-minute cadence, giving machine-learning models fuel to calculate cross-category effects with laboratory-grade precision. Walmart's rollout cut price-change cycles from days to minutes, while Alibaba's Hema updates roughly 1,000 labels in 23 seconds, proving that rapid feedback loops are now plausible at hypermarket scale. NielsenIQ's 2025 acquisition of Gastrograph AI layers sensory-preference predictions onto this data stack, letting category teams test flavor concepts virtually before pilot runs. The intersection of loyalty cards, live inventory, and competitor scraping transforms promotion planning into a continuous control loop, replacing quarterly spreadsheets with near-real-time optimization.
Rapid Advances in GenAI-Powered Predictive Algorithms
Transformer architectures once used for language tasks now predict purchase likelihood for low-frequency categories, solving cold-start challenges that plagued rule-based engines. Toshiba Tec embedded generative modules directly into promotion optimization software in 2024, enabling one-to-one coupon allocation under tight funding limits. Profitmind's agentic AI, backed by Accenture Ventures in 2026, produces ranked weekly action lists that combine pricing, inventory, and assortment moves tied to profit impact, compressing analysis and execution into a single workflow. The market narrative is shifting from insight generation to automated decisioning that closes the loop without human re-keying.
Legacy ERP Integration Complexities
SAP and Oracle systems built on batch architectures resist real-time data ingestion, forcing enterprises to stitch middleware and transformation pipelines that elongate deployment timelines. An industry survey found 83% of retailers struggling to unify siloed data, underscoring the hidden costs behind plug-and-play marketing claims. Infosys's TradeEdge modules exemplify the compromise, reconciling nightly ERP logs with streaming feeds to feed optimization engines while preserving audit trails. Until standardized connectors mature, integration friction will temper the trade promotion optimization AI market's otherwise robust growth.
Other drivers and restraints analyzed in the detailed report include:
- Cloud Cost Reductions Enabling SMB Adoption
- Retailer Demand for Real-Time Price Elasticity Insights
- Rising Consumer Data-Privacy Regulations
For complete list of drivers and restraints, kindly check the Table Of Contents.
Segment Analysis
Cloud accounted for 62.73% of 2025 revenue, highlighting its effectiveness in handling streaming point-of-sale feeds and providing on-demand computational capabilities. The trade promotion optimization AI market size for cloud deployments is anticipated to grow at a compound annual growth rate (CAGR) of 21.34% during the forecast period from 2026 to 2031. This growth is expected to further widen the gap between cloud-based solutions and legacy on-premises installations. Enterprises are increasingly adopting cloud solutions for their ability to deliver faster time-to-value, support elastic scaling, and significantly reduce capital expenditure. Additionally, regulatory bodies are increasingly accepting regionally partitioned cloud infrastructures that comply with data-residency requirements, further driving adoption.
The Asia-Pacific region exemplifies the advantages of cloud adoption. For instance, India's ongoing retail digitization initiatives are fostering greenfield launches that entirely bypass traditional on-premises server setups. Similarly, Japan's Nippon Access has reported profit gains ranging from 6% to 20% by leveraging a cloud-native pricing AI solution. To address security concerns, vendors are introducing hybrid cloud models that retain sensitive master data on-premises while leveraging the cloud for model training. This approach is enabling cloud adoption even in highly regulated industries, such as the pharmaceutical industry, where data security and compliance are critical.
Solutions captured 58.23% revenue in 2025, dominated by subscription licenses for optimization engines and analytics dashboards. Yet the services slice is advancing at a 21.32% CAGR because enterprises recognize that change management, data cleansing, and continuous model tuning determine return on investment. Trade promotion optimization AI industry consultancies embed sprint teams within merchandising functions to shepherd adoption and guarantee financial outcomes.
The 2026 cost-reduction blueprint emphasizes establishing a transformation management office that integrates savings directly into budgets, underscoring that software solutions alone are insufficient. Wipro's partnership with RELEX combines platform rollouts with dedicated implementation squads, while NEC offers a managed service desk that interprets algorithmic outputs for category managers. NEC melds AI-driven pricing models with business process outsourcing in its retail price optimization solution. A dedicated pricing team not only operationalizes these offers but also explains their rationale to merchandisers and conducts performance analyses. This approach underscores NEC's offering as a model focused on generating results, rather than merely selling a tool.
The Trade Promotion Optimization AI Market Report is Segmented by Deployment Mode (Cloud, and On-Premise), Component (Solutions, and Services), Industry Vertical (Consumer Packaged Goods, Food and Beverage, and More), Application (Demand Forecasting, Post-Event Analysis, and More), Organization Size (Large Enterprises, and Small and Medium Enterprises), and Geography. The Market Forecasts are Provided in Terms of Value (USD).
Geography Analysis
North America led with 41.37% revenue in 2025, reflecting mature point-of-sale infrastructure, retailer media networks, and early adoption by Fortune 500 CPG firms. The region's dominance is driven by advanced technological integration and retailers' ability to leverage data for strategic decision-making. Kroger Precision Marketing's closed-loop attribution and Target's AI roadmap highlight how retailers monetize data as a service, compelling brands to align promotion funding with algorithmic ROI benchmarks. Additionally, private-label penetration, which has surpassed 21% of grocery sales, intensifies competition, making precise promotion math a strategic imperative for businesses aiming to maintain market share and profitability.
Europe ranks second but faces challenges due to GDPR constraints that push vendors toward federated learning and explainable dashboards. Retailers in Germany and the Netherlands are piloting privacy-preserving architectures that calculate lift without exporting raw loyalty data, ensuring compliance with stringent data protection regulations. While the trade promotion optimization AI market share in Europe remains substantial, growth lags behind North America because compliance cycles extend procurement decision-making timelines. Despite these challenges, the region continues to invest in innovative solutions to balance regulatory requirements with the need for advanced analytics, ensuring steady market development.
Asia-Pacific is the fastest-growing region, with a 18.23% CAGR, buoyed by digital-native retailers, rising disposable incomes, and government AI agendas. India's retail sector demonstrates strong demand for greenfield cloud-native optimization tools. China's nationwide AI rollout accelerates store automation, while Japan's Lawson uses transformer-based engines to allocate new-store media budgets. South America, the Middle East, and Africa advance in pockets, Brazilian hypermarkets and UAE convenience chains pilot dynamic pricing, but fragmented data and lower analytical maturity temper region-wide scaling.
- NielsenIQ, LLC
- SAP SE
- Oracle Corporation
- Accenture Plc
- IBM Corporation
- Aera Technology, Inc.
- Wipro Limited
- Infosys Limited
- Exceedra Ltd.
- Revionics, LLC
- Blacksmith Applications, Inc.
- Trade Promotion Master International B.V.
- o9 Solutions, Inc.
- Eversight, Inc.
- Blue Yonder Group, Inc.
- T-Pro Solutions LLC
- Uptake Technologies Inc.
- AFS Technologies, Inc.
- Quotient Technology Inc.
- Anaplan, Inc.
Additional Benefits:
- The market estimate (ME) sheet in Excel format
- 3 months of analyst support
TABLE OF CONTENTS
1 INTRODUCTION
- 1.1 Study Assumptions and Market Definition
- 1.2 Scope of the Study
2 RESEARCH METHODOLOGY
3 EXECUTIVE SUMMARY
4 MARKET LANDSCAPE
- 4.1 Market Overview
- 4.2 Market Drivers
- 4.2.1 Growing Availability of High-Fidelity Point-of-Sale Data
- 4.2.2 Rapid Advances in GenAI-Powered Predictive Algorithms
- 4.2.3 Cloud Cost Reductions Enabling SMB Adoption
- 4.2.4 Retailer Demand for Real-Time Price Elasticity Insights
- 4.2.5 Supermarket Private-Label Expansion Requiring Precise Promotion Math
- 4.2.6 Privacy-Preserving Federated Learning Models in CPG Retail
- 4.3 Market Restraints
- 4.3.1 Legacy ERP Integration Complexities
- 4.3.2 Rising Consumer Data-Privacy Regulations
- 4.3.3 Low Analytical Maturity in Emerging Markets
- 4.3.4 Internal Change-Management Barriers
- 4.4 Impact of Macroeconomic Factors on the Market
- 4.5 Industry Value Chain Analysis
- 4.6 Regulatory Landscape
- 4.7 Technological Outlook
- 4.8 Porter's Five Forces Analysis
- 4.8.1 Bargaining Power of Suppliers
- 4.8.2 Bargaining Power of Buyers
- 4.8.3 Threat of New Entrants
- 4.8.4 Threat of Substitutes
- 4.8.5 Intensity of Competitive Rivalry
5 MARKET SIZE AND GROWTH FORECASTS (VALUE)
- 5.1 By Deployment Mode
- 5.1.1 Cloud
- 5.1.2 On-Premise
- 5.2 By Component
- 5.2.1 Solutions
- 5.2.2 Services
- 5.3 By Industry Vertical
- 5.3.1 Consumer Packaged Goods
- 5.3.2 Retail and E-Commerce
- 5.3.3 Food and Beverage
- 5.3.4 Pharmaceutical and Healthcare
- 5.3.5 Electronics and Appliances
- 5.3.6 Other industry Verticals
- 5.4 By Application
- 5.4.1 Promotion Planning and Calendar Management
- 5.4.2 Demand Forecasting
- 5.4.3 Price and Promotion Optimization
- 5.4.4 Post-Event Analysis
- 5.4.5 Other Applications
- 5.5 By Organization Size
- 5.5.1 Large Enterprises
- 5.5.2 Small and Medium Enterprises
- 5.6 By Geography
- 5.6.1 North America
- 5.6.1.1 United States
- 5.6.1.2 Canada
- 5.6.1.3 Mexico
- 5.6.2 South America
- 5.6.2.1 Brazil
- 5.6.2.2 Argentina
- 5.6.2.3 Rest of South America
- 5.6.3 Europe
- 5.6.3.1 United Kingdom
- 5.6.3.2 Germany
- 5.6.3.3 France
- 5.6.3.4 Italy
- 5.6.3.5 Spain
- 5.6.3.6 Rest of Europe
- 5.6.4 Asia-Pacific
- 5.6.4.1 China
- 5.6.4.2 Japan
- 5.6.4.3 India
- 5.6.4.4 South Korea
- 5.6.4.5 Rest of Asia-Pacific
- 5.6.5 Middle East and Africa
- 5.6.5.1 Middle East
- 5.6.5.1.1 United Arab Emirates
- 5.6.5.1.2 Saudi Arabia
- 5.6.5.1.3 Rest of Middle East
- 5.6.5.2 Africa
- 5.6.5.2.1 South Africa
- 5.6.5.2.2 Egypt
- 5.6.5.2.3 Rest of Africa
- 5.6.5.1 Middle East
- 5.6.1 North America
6 COMPETITIVE LANDSCAPE
- 6.1 Market Concentration
- 6.2 Strategic Moves
- 6.3 Market Share Analysis
- 6.4 Company Profiles (includes Global Level Overview, Market Level Overview, Core Segments, Financials as available, Strategic Information, Market Rank/Share, Products and Services, Recent Developments)
- 6.4.1 NielsenIQ, LLC
- 6.4.2 SAP SE
- 6.4.3 Oracle Corporation
- 6.4.4 Accenture Plc
- 6.4.5 IBM Corporation
- 6.4.6 Aera Technology, Inc.
- 6.4.7 Wipro Limited
- 6.4.8 Infosys Limited
- 6.4.9 Exceedra Ltd.
- 6.4.10 Revionics, LLC
- 6.4.11 Blacksmith Applications, Inc.
- 6.4.12 Trade Promotion Master International B.V.
- 6.4.13 o9 Solutions, Inc.
- 6.4.14 Eversight, Inc.
- 6.4.15 Blue Yonder Group, Inc.
- 6.4.16 T-Pro Solutions LLC
- 6.4.17 Uptake Technologies Inc.
- 6.4.18 AFS Technologies, Inc.
- 6.4.19 Quotient Technology Inc.
- 6.4.20 Anaplan, Inc.
7 MARKET OPPORTUNITIES AND FUTURE OUTLOOK
- 7.1 White-Space and Unmet-Need Assessment


