
|
시장보고서
상품코드
2044032
통신 네트워크 고밀도화 : 시장 점유율 분석, 업계 동향 및 통계, 성장 예측(2026-2031년)Telecom Network Densification - Market Share Analysis, Industry Trends & Statistics, Growth Forecasts (2026 - 2031) |
||||||
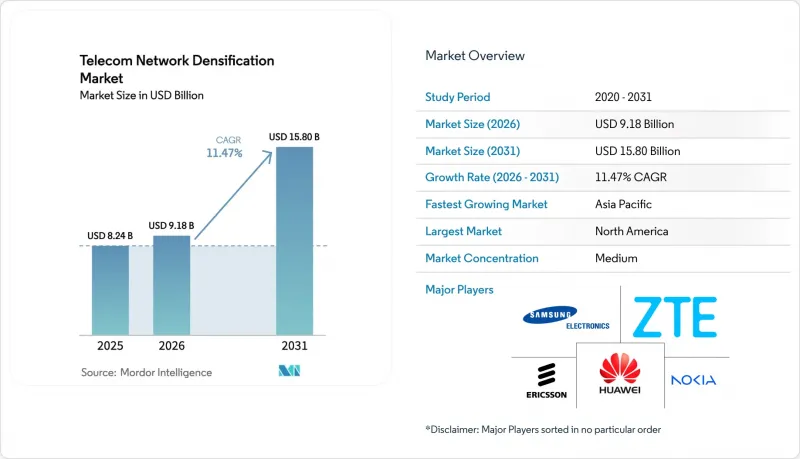
통신 네트워크 고밀도화 시장 규모는 2025년 82억 4,000만 달러로 평가되었습니다. 2026년 91억 8,000만 달러로 확대되어 2026년부터 2031년에 걸쳐 CAGR 11.47%를 나타내, 2031년에는 158억 달러에 이를 것으로 예측됩니다.
2025년까지 월간 모바일 데이터 트래픽이 전년 대비 25% 증가한 한편, 인구 밀집 지역의 매크로셀 용량이 한계에 다다랐기 때문에 통신사들은 스몰셀, 분산형 안테나 시스템, mm파 노드 도입에 박차를 가하고 있습니다. 경기장, 공항, 기업 캠퍼스에서는 확실한 통신 커버리지가 필요하기 때문에 실내 시스템이 주류를 이루고 있지만, 거리 단위의 허가 절차가 간소화되면서 실외 노드의 두 번째 성장 물결이 일어나고 있습니다. 통신사업자들이 광역 커버리지와 멀티 기가비트 핫스팟을 통합함에 따라 6GHz 미만 대역과 mm파를 결합한 하이브리드 아키텍처가 확산되고 있으며, 건물 소유주가 공유 인프라를 통해 수익을 창출하는 중립 호스트의 비즈니스 모델도 확대되고 있습니다. 확대되고 있습니다. 정부의 5G 부양책으로 리스크는 더욱 줄어들고 있지만, 백홀용 광케이블 부족과 지자체마다 상이한 규제로 인해 5G 확산 속도는 여전히 느린 임베디드니다.
세계의 통신 네트워크 고밀도화 시장 동향 및 인사이트
급증하는 모바일 데이터 트래픽과 5G 가입자 증가
세계 모바일 데이터 소비량은 2025년 월 140 엑사바이트에 달했으며, 2024년 대비 25% 증가했습니다. 또한, 2029년까지 5G 계약 건수는 56억 건에 달할 것으로 예측됩니다. 고도의 캐리어 어그리게이션을 채택하더라도 고밀도 영역의 매크로셀 처리량은 현재 약 10Gbps로 한계에 달하고 있어 통신사업자는 사이트 수를 늘려야 합니다. 동영상 스트리밍과 클라우드 게임은 이미 트래픽의 70%를 차지하고 있으며, 향후 등장할 증강현실(XR) 서비스로 인해 업링크 수요는 더욱 증가할 것으로 예측됩니다. 네트워크 밀도를 높이는 선구자는 안정적인 기가비트급 성능을 원하는 프리미엄 가입자를 확보할 수 있지만, 뒤처지는 사업자는 일관된 QoE(Quality of Experience)를 제공하는 경쟁사로의 고객 이탈 위험에 직면하게 됩니다. 통신사업자가 네트워크 밀도 향상과 엣지 컴퓨팅을 함께 도입하면 평균 판매가격이 상승하기 때문에 벤더들도 수혜를 입습니다. 그 결과, 거시경제의 불확실성에도 불구하고 통신 네트워크 밀도 향상 시장은 두 자릿수 성장을 지속하고 있습니다.
도시 지역의 용량 부족으로 스몰셀과 mm파의 보급이 가속화
도심 핫스팟의 경우, 5G 매크로 기지국의 완벽한 커버리지를 확보하더라도 간섭과 높은 사용자 밀도로 인해 저녁 피크 시간대에는 셀 에지 처리량이 50Mbps 이하로 떨어지는 경우가 많습니다. 이에 통신사들은 가로등, 전봇대, 건물 외벽에 스몰셀을 설치하여 무선설비 설치 면적을 줄이고 사용자당 대역폭을 확대되고 있습니다. 예를 들어, EE는 2025년 중반까지 런던 전역에 1,500개 이상의 도시형 스몰셀을 가동하여 혼잡한 매크로 계층의 트래픽을 완화했습니다. 그러나 mm파(mmWave) 무선은 6GHz 이하 무선에 비해 20-30dB 높은 전송 손실이 발생하기 때문에 같은 지역을 커버하기 위해서는 5-10배의 설치 거점이 필요합니다. 산호세의 'dig-once' 정책처럼 원스톱으로 허가 절차를 간소화하는 지자체는 통신사업자의 투자를 더 많이 유치할 수 있습니다. 반면, 승인 프로세스가 분절된 경우, 노드 가동 시작이 1년 이상 지연될 수 있습니다.
인구 밀집 도시에서의 복잡한 부지 취득 및 허가 취득
매크로 타워를 위해 수립된 지자체 조례는 가로등에 볼트로 고정되는 백팩 사이즈의 장비에 대응하는 경우는 드뭅니다. 뉴욕시에서는 기존에는 최대 24개월이 걸렸지만, LA시는 시 소유의 모든 전봇대에 대한 마스터 라이선스를 통해 그 기간을 90일로 단축했습니다. 2018년 FCC가 부과한 노드당 연간 270달러의 연방 상한선은 현재도 법적 문제에 직면해 있으며, 설비 투자 계획에 불확실성을 초래하고 있습니다. 수천 개의 노드를 구축하는 통신사업자는 각각 고유한 업무 흐름을 가진 교통국, 유틸리티국, 문화재 보호기관 등과 협상을 해야 합니다. 중립 호스트 애그리게이터는 절차의 번거로움을 줄여주지만, 30-40%의 마진을 부과하는 경우가 많아 총소유비용이 증가합니다. 따라서 허가 지연은 자본 집약적인 도심의 통신망 고밀도화 시장 확대에 가장 큰 걸림돌로 작용하고 있습니다.
부문 분석
실내 사이트는 2025년 매출의 64.56%를 차지했으며, 단일 부문으로서는 가장 큰 통신 네트워크 고밀도화 시장 점유율을 차지할 것으로 예측됩니다. 공항, 경기장, 기업 캠퍼스에서는 평방 킬로미터당 5만 명 이상의 동시 사용자 밀도를 달성하여 실외 매크로 기지국의 한계를 훨씬 넘어섰습니다. 따라서 실내용 스몰셀이나 분산형 안테나 시스템(DAS)은 평방미터당 용량을 10배에서 100배까지 증가시킬 수 있습니다. 지자체의 건물 내 설치에 대한 규제는 드물며, 이를 통해 부동산 소유자는 중립 호스트와 직접 계약할 수 있어 허가 취득의 지연을 최소화할 수 있습니다.
실외 노드는 교통 및 소매점 밀집 지역의 가로등 및 전봇대 설치에 힘입어 CAGR 12.41%를 나타낼 것으로 예측됩니다. FCC의 과도한 지자체 수수료 규제로 인해 규제를 준수하는 관할권에서는 평균 승인 기간이 18개월에서 90일 미만으로 단축되었습니다. 마스터 라이선스 프레임워크를 채택하는 도시에서는 전력 공급, 전봇대 접근, 광섬유 연결 신청이 통합되어 통신 사업자의 부담을 줄일 수 있습니다. 품질 보증을 위한 실내 설치와 이동성을 위한 실외 설치를 균형 있게 결합한 건설 계획은 통신 사업자가 균일한 기가비트 서비스를 실현하고 통신 네트워크 밀도 향상 시장에서 수익을 극대화할 수 있도록 돕습니다.
6GHz 이하 대역의 커버리지는 반경 500-1,000m 범위에서 사이트 수와 설비투자(CAPEX)를 관리할 수 있는 수준으로 억제할 수 있기 때문에 2025년 지출의 43.91%를 차지할 것으로 예측됩니다. 그러나 통신사업자들이 멀티 기가비트 핫스팟을 광역 커버리지에 겹겹이 쌓아 올리면서 6GHz 이하 대역과 mm파(mmWave)를 결합한 하이브리드 방식은 2031년까지 연평균 복합 성장률(CAGR) 12.98%를 나타낼 것으로 예측됩니다. 미국의 810억 달러 규모의 C-band 주파수 경매가 그 선구자이며, 일본의 NTT도코모는 도쿄 시부야 지역에서 기지국으로부터 100미터 이내에서 28GHz의 mm파를 사용하여 다운링크 4Gbps를 달성했습니다.
순수 mm파는 6GHz 이하 대역에 비해 20-30dB 높은 전송 손실이 있어 경기장, 공항 및 밀집된 도심에서의 이용이 제한되어 있습니다. Release-17의 듀얼 커넥티비티를 통해 디바이스가 두 대역에 동시에 연결할 수 있어 스펙트럼 효율성과 사용자 경험을 최적화할 수 있습니다. 이종 대역 간 간섭 감소와 부하분산을 습득한 통신사업자는 스펙트럼 투자수익률(ROI)을 확보하여 통신망 고밀도화 시장을 확대되고 있습니다.
'통신 네트워크 고밀도화 시장 보고서'는 설치 장소(실내 및 실외), 주파수 대역(6GHz 미만, mm파(24-71GHz), 6GHz 미만 + mm파 하이브리드), 용도(eMBB, FWA 등), 최종 사용자(통신사업자, 기업, 사설 네트워크 호스트 등), 지역별로 구분하여 분석하였습니다. 사용자(통신사업자, 기업 및 사설 네트워크 호스트 등), 지역별로 분류되어 있습니다. 시장 예측은 금액(USD)으로 표시됩니다.
지역별 분석
북미는 C-band 도입과 연간 5만 개의 신규 스몰셀 가동에 힘입어 2025년 매출의 24.56%를 차지했습니다. 캐나다에서는 3.5GHz 대역의 전국적 확산으로 농촌 지역까지 커버리지가 확대되고 있으며, 멕시코에서는 인프라 공유가 의무화되어 설비투자(CAPEX)를 최소화한 확장이 가능해졌습니다. 탄탄한 중립적 호스트 생태계와 명확한 허가 규정으로 인해 투자 모멘텀은 높은 수준을 유지하고 있지만, 역사 보존 구역은 여전히 개발의 병목 현상으로 남아있습니다.
아시아태평양은 2031년까지 13.04%의 연평균 복합 성장률(CAGR)을 나타내고, 모든 지역을 능가할 것으로 예상되며, 곧 통신 네트워크 밀도 향상 시장에서 가장 큰 점유율을 차지할 것으로 예측됩니다. 차이나모바일만 230만 개의 5G 기지국을 운영하고 있으며, 인도의 Jio와 Airtel은 2027년까지 100만 개의 스몰셀을 구축할 계획입니다. 일본과 한국은 mm파(mmWave) 도입을 선도하고 있으며, 아세안 국가들은 디지털 경제의 목표 달성을 위해 주파수 경매를 가속화하고 있습니다. 정부의 보조금과 산업단지 우대정책으로 리스크를 최소화하고, GDP가 높은 지역에 조기 네트워크 고밀도화가 집중되고 있습니다.
유럽은 15%대 중반의 점유율을 유지하고 있으며, EU의 5G 실행 계획은 2030년까지 모든 교통 회랑을 따라 커버리지를 의무화하고 있으며, 이는 도로를 따라 노드의 밀집된 배치로 이어집니다. GCC 국가들은 스마트시티 구상, 두바이 엑스포, 사우디 비전 2030을 활용하여 네트워크를 빠르게 고밀도화하고 사용자 1인당 수익을 높이고 있습니다. 아프리카와 남미 지역은 뒤늦게 출발했지만, 낮은 기반에서 높은 성장률을 보이고 있으며, 최근 나이지리아와 브라질의 주파수 할당으로 인해 파일럿 배포가 빠르게 시작되고 있습니다. 규제 진행 상황이 다양하기 때문에 세계 벤더들은 통신 네트워크 밀도 향상 시장에서 성장 점유율을 확보하기 위해 지역별로 시장 진출 전략을 조정해야 합니다.
기타 혜택 :
- 엑셀 형식 시장 예측(ME) 시트
- 3개월간 애널리스트 지원
자주 묻는 질문
목차
제1장 서론
제2장 조사 방법
제3장 주요 요약
제4장 시장 구도
제5장 시장 규모와 성장 예측
제6장 경쟁 구도
제7장 시장 기회와 향후 전망
KTH 26.05.29The Telecom Network Densification Market size is expected to grow from USD 8.24 billion in 2025 to USD 9.18 billion in 2026 and is forecast to reach USD 15.80 billion by 2031 at 11.47% CAGR over 2026-2031.

Operators are accelerating deployments of small cells, distributed antenna systems, and millimeter-wave nodes because monthly mobile data traffic jumped 25% year-on-year through 2025, while macro-cell capacity in dense districts plateaued. Indoor systems dominate because stadiums, airports, and enterprise campuses demand guaranteed coverage, yet streamlined street-level permitting is unlocking a second growth wave for outdoor nodes. Hybrid sub-6 GHz plus mmWave architectures are gaining traction as carriers blend wide-area reach with multi-gigabit hotspots, and neutral-host business models are expanding as building owners monetize shared infrastructure. Government 5G stimulus programs further reduce risk, but backhaul fiber scarcity and fragmented municipal rules continue to temper rollout velocity.
Global Telecom Network Densification Market Trends and Insights
Surging Mobile Data Traffic and 5G Subscription Growth
Global mobile data consumption reached 140 exabytes per month in 2025, a 25% increase from 2024, and 5G subscriptions are on track to reach 5.6 billion by 2029. Macro-cell throughput in high-density corridors now levels off at around 10 Gbps, even with advanced carrier aggregation, compelling operators to increase site counts. Video streaming and cloud gaming already account for 70% of traffic, and forthcoming extended-reality services will further intensify uplink demand. Early movers that densify networks secure premium subscribers seeking stable gigabit performance, whereas laggards risk churn toward rivals with consistent quality of experience. Equipment vendors benefit as operators bundle densification with edge compute, raising average selling prices. Consequently, the Telecom network densification market continues to post double-digit gains despite macroeconomic uncertainty.
Urban Capacity Crunch Spurring Small-Cell and mmWave Rollout
Cell-edge throughput in inner-city hot spots often dips below 50 Mbps during evening peaks, even under full 5G macro coverage, mainly due to interference and high user density. Carriers therefore affix small cells to lamp posts, utility poles, and facades to shrink the radio footprint and lift per-user bandwidth. EE, for instance, activated more than 1,500 urban small cells across London by mid-2025, relieving traffic on congested macro layers. However, mmWave radios experience 20-30 dB higher path loss than sub-6 GHz radios, requiring 5-10 times as many sites to blanket the same geography. Municipalities that streamline single-touch permitting, such as San Jose's "dig-once" policy, attract greater operator capital, whereas fragmented approval chains can delay node activation by over a year.
Complex Site Acquisition and Permitting in Dense Cities
Municipal codes drafted for macro towers seldom accommodate devices the size of a backpack bolted to streetlights. New York City historically required up to 24 months for approvals, whereas Los Angeles cut timelines to 90 days via a master license on all city-owned poles. The federal caps of USD 270 per node annually, imposed by the FCC in 2018, are facing ongoing legal challenges, creating uncertainty for CAPEX planning. Carriers deploying thousands of nodes must negotiate with transportation, public works, and heritage bodies, each with its own workflows. Neutral-host aggregators reduce red tape but often capture 30-40% margins, increasing the total cost of ownership. Hence, slow permitting remains the most immediate drag on the expansion of the Telecom network densification market in capital-intensive urban cores.
Other drivers and restraints analyzed in the detailed report include:
- Government and Operator 5G Infrastructure Investments
- Enterprise/Private-5G Demand for Ultra-Low-Latency Links
- Backhaul-Fiber Availability and Cost Constraints
For complete list of drivers and restraints, kindly check the Table Of Contents.
Segment Analysis
Indoor sites accounted for 64.56% of 2025 revenue, the largest Telecom network densification market share for any single segment. Airports, arenas, and corporate campuses deliver concurrent user densities above 50,000 per square kilometer, far exceeding outdoor macro limits. Indoor small cells and distributed-antenna systems thus enable 10-to-100-fold capacity gains per square meter. Municipalities rarely govern in-building installations, allowing property owners to contract with neutral hosts directly and minimizing permitting delays.
Outdoor nodes will grow at a 12.41% CAGR, powered by lamp-post and utility-pole deployments along transit and retail corridors. FCC preemption of excessive municipal fees trimmed average approval timelines from 18 months to under 90 days in compliant jurisdictions. Cities adopting master-license frameworks consolidate power supply, pole access, and fiber attachment requests, reducing operator friction. Balanced build plans, indoor for guaranteed quality and outdoor for mobility, help carriers achieve uniform gigabit service and maximize Telecom network densification market size returns.
Sub-6 GHz coverage preserved 43.91% of 2025 spending because a 500-1,000-meter radius keeps site counts and CAPEX manageable. However, hybrid sub-6 GHz + mmWave approaches will post a 12.98% CAGR through 2031 as operators layer wide-area coverage with multi-gigabit hotspots. The United States' USD 81 billion C-band auction set the pace, while Japan's NTT Docomo achieved 4 Gbps downlink in Tokyo's Shibuya district using 28 GHz mmWave within 100 meters of base stations.
Pure mmWave remains specialized for stadiums, airports, and dense downtown blocks, due to 20-30 dB higher path loss than sub-6 GHz. Release-17 dual-connectivity enables devices to connect to both bands simultaneously, optimizing spectral efficiency and user experience. Operators mastering interference mitigation and load balancing across heterogeneous bands protect spectrum ROI and expand the Telecom network densification market.
The Telecom Network Densification Market Report is Segmented by Deployment Location (Indoor and Outdoor), Spectrum Band (Sub-6 GHz, Mmwave (24-71 GHz), and Hybrid Sub-6 + MmWave), Application (Enhanced Mobile Broadband (eMBB), Fixed Wireless Access (FWA), and More), End User (Telecom Operators, Enterprises and Private-Network Hosts, and More), and Geography. The Market Forecasts are in Value (USD).
Geography Analysis
North America retained 24.56% of 2025 turnover, underpinned by C-band deployments and the activation of 50,000 new small cells during the year. Canada's nationwide 3.5 GHz rollout extends coverage to rural communities, while Mexico's infrastructure-sharing mandate unlocks lower-CAPEX expansions. Robust neutral-host ecosystems and clear permitting rules keep investment momentum high, though heritage zones remain deployment bottlenecks.
Asia-Pacific is set to outpace every region, with a 13.04% CAGR through 2031, and will soon command the largest Telecom network densification market share. China Mobile alone operates 2.3 million 5G base stations, while India's Jio and Airtel plan to deploy 1 million small cells by 2027. Japan and South Korea lead mmWave adoption, while ASEAN nations accelerate auctions to fuel digital-economy goals. Governmental subsidies and industrial-park incentives minimize risk and concentrate early densification in high-GDP corridors.
Europe maintains a mid-teens share, and the EU's 5G Action Plan mandates coverage along all transport corridors by 2030, which translates into dense roadside node deployments. GCC nations leverage smart-city visions, the Dubai Expo, and Saudi Vision 2030 to densify networks swiftly, generating high per-user revenue. Africa and South America lag but exhibit high percentage growth from low bases, with Nigeria's and Brazil's recent spectrum awards jump-starting pilot rollouts. Diverse regulatory rhythms mean global vendors must tailor their go-to-market strategies by region to capture their share of the growth in the Telecom network densification market.
- Huawei Technologies Co., Ltd.
- Telefonaktiebolaget LM Ericsson
- Nokia Corporation
- Samsung Electronics Co., Ltd.
- ZTE Corporation
- Qualcomm Technologies, Inc.
- CommScope Holding Company, Inc.
- Airspan Networks Holdings Inc.
- Mavenir Systems, Inc.
- NEC Corporation
- Fujitsu Limited
- Corning Incorporated
- Cisco Systems, Inc.
- Baicells Technologies Co., Ltd.
- ip.access Limited
- Radisys Corporation
- John Mezzalingua Associates, LLC
- Parallel Wireless, Inc.
- Boldyn Networks
Additional Benefits:
- The market estimate (ME) sheet in Excel format
- 3 months of analyst support
TABLE OF CONTENTS
1 INTRODUCTION
- 1.1 Study Assumptions and Market Definition
- 1.2 Scope of the Study
2 RESEARCH METHODOLOGY
3 EXECUTIVE SUMMARY
4 MARKET LANDSCAPE
- 4.1 Market Overview
- 4.2 Market Drivers
- 4.2.1 Surging Mobile Data Traffic and 5G Subscription Growth
- 4.2.2 Urban Capacity Crunch Spurring Small-Cell and mmWave Rollout
- 4.2.3 Government and Operator 5G Infrastructure Investments
- 4.2.4 Enterprise/Private-5G Demand for Ultra-Low-Latency Links
- 4.2.5 AI-Optimized Smart Repeaters Lowering Deployment CAPEX
- 4.2.6 Integrated Access and Backhaul (IAB) Enabling Fiber-Lean Roll-Outs
- 4.3 Market Restraints
- 4.3.1 Complex Site Acquisition and Permitting in Dense Cities
- 4.3.2 Backhaul-Fiber Availability and Cost Constraints
- 4.3.3 DL/UL Power Imbalance at mmWave Bands
- 4.3.4 Energy-Use Escalation Vs. Sustainability Targets
- 4.4 Industry Value Chain Analysis
- 4.5 Regulatory Landscape
- 4.6 Technological Outlook
- 4.7 Porter's Five Forces Analysis
- 4.7.1 Threat of New Entrants
- 4.7.2 Bargaining Power of Suppliers
- 4.7.3 Bargaining Power of Buyers
- 4.7.4 Threat of Substitutes
- 4.7.5 Competitive Rivalry
5 MARKET SIZE AND GROWTH FORECASTS (VALUE)
- 5.1 By Deployment Location
- 5.1.1 Indoor
- 5.1.2 Outdoor
- 5.2 By Spectrum Band
- 5.2.1 Sub-6 GHz
- 5.2.2 mmWave (24-71 GHz)
- 5.2.3 Hybrid Sub-6 + mmWave
- 5.3 By Application
- 5.3.1 Enhanced Mobile Broadband (eMBB)
- 5.3.2 Fixed Wireless Access (FWA)
- 5.3.3 Industrial IoT/Industry 4.0
- 5.3.4 Smart Cities and Public Venues
- 5.3.5 Mission-Critical and Public Safety
- 5.3.6 Connected and Autonomous Mobility (V2X)
- 5.4 By End User
- 5.4.1 Telecom Operators
- 5.4.2 Enterprises and Private-Network Hosts
- 5.4.3 Neutral-Host Providers
- 5.4.4 Government and Public Safety
- 5.4.5 Residential/Consumers
- 5.5 By Geography
- 5.5.1 North America
- 5.5.1.1 United States
- 5.5.1.2 Canada
- 5.5.1.3 Mexico
- 5.5.2 South America
- 5.5.2.1 Brazil
- 5.5.2.2 Argentina
- 5.5.2.3 Rest of South America
- 5.5.3 Europe
- 5.5.3.1 Germany
- 5.5.3.2 United Kingdom
- 5.5.3.3 France
- 5.5.3.4 Italy
- 5.5.3.5 Spain
- 5.5.3.6 Russia
- 5.5.3.7 Rest of Europe
- 5.5.4 Asia-Pacific
- 5.5.4.1 China
- 5.5.4.2 Japan
- 5.5.4.3 South Korea
- 5.5.4.4 India
- 5.5.4.5 ASEAN
- 5.5.4.6 Rest of Asia-Pacific
- 5.5.5 Middle East and Africa
- 5.5.5.1 GCC
- 5.5.5.2 South Africa
- 5.5.5.3 Nigeria
- 5.5.5.4 Rest of Middle East and Africa
- 5.5.1 North America
6 COMPETITIVE LANDSCAPE
- 6.1 Market Concentration
- 6.2 Strategic Moves
- 6.3 Market Share Analysis
- 6.4 Company Profiles (includes Global level Overview, Market level overview, Core Segments, Financials as available, Strategic Information, Market Rank/Share for key companies, Products and Services, and Recent Developments)
- 6.4.1 Huawei Technologies Co., Ltd.
- 6.4.2 Telefonaktiebolaget LM Ericsson
- 6.4.3 Nokia Corporation
- 6.4.4 Samsung Electronics Co., Ltd.
- 6.4.5 ZTE Corporation
- 6.4.6 Qualcomm Technologies, Inc.
- 6.4.7 CommScope Holding Company, Inc.
- 6.4.8 Airspan Networks Holdings Inc.
- 6.4.9 Mavenir Systems, Inc.
- 6.4.10 NEC Corporation
- 6.4.11 Fujitsu Limited
- 6.4.12 Corning Incorporated
- 6.4.13 Cisco Systems, Inc.
- 6.4.14 Baicells Technologies Co., Ltd.
- 6.4.15 ip.access Limited
- 6.4.16 Radisys Corporation
- 6.4.17 John Mezzalingua Associates, LLC
- 6.4.18 Parallel Wireless, Inc.
- 6.4.19 Boldyn Networks
7 MARKET OPPORTUNITIES AND FUTURE OUTLOOK
- 7.1 White-Space and Unmet-Need Assessment
- 7.2 Analyst Recommendations and Suggestions
