|
시장보고서
상품코드
2044129
색 감지 센서 시장 : 점유율 분석, 산업 동향 및 통계, 성장 예측(2026-2031년)Color Detection Sensor - Market Share Analysis, Industry Trends & Statistics, Growth Forecasts (2026 - 2031) |
||||||
 Mordor Intelligence
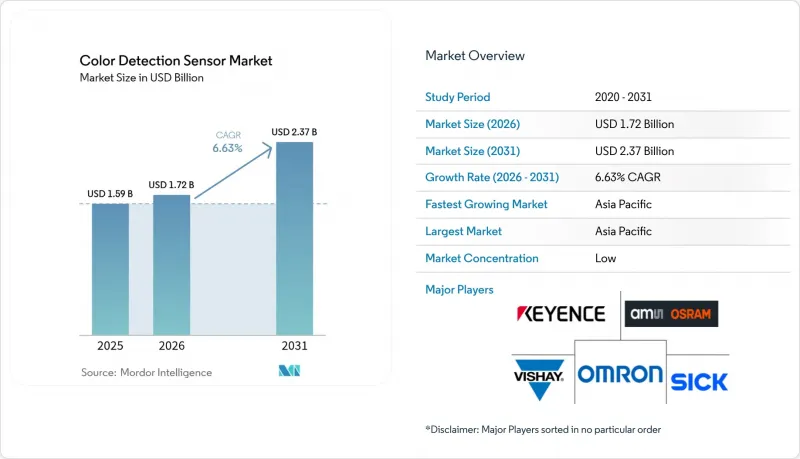
색 감지 센서 시장 규모는 2025년 15억 9,000만 달러에서 2026년에는 17억 2,000만 달러로 확대되어 2031년까지 23억 7,000만 달러에 이를 것으로 예상되고 있으며 2026년부터 2031년까지 CAGR 6.63%로 성장할 전망입니다.
공장 경영자들이 품질 관리의 디지털화를 추진하고, 스마트폰 및 웨어러블 기기 제조업체들이 건강 모니터링용 색각 모듈을 내장하고, 규제 당국이 식품 및 의약품 포장의 색상 균일성에 대한 규제를 강화함에 따라 수요는 계속 증가하고 있습니다. 또한, 기존의 RGB를 훨씬 뛰어넘는 재료 레벨의 지식을 얻을 수 있을 것으로 기대되는 하이퍼스펙트럼 연구에 대한 투자도 진행되고 있으며, 머신러닝 펌웨어를 통해 검사 주기를 단축하고 불량품의 감소가 진행되고 있습니다. 각 벤더들은 카메라 센서나 로봇 그리퍼 옆에 설치할 수 있는 소형, 저전력 소모 장치로 이에 대응하고 있으며, 처리 속도 저하 없이 실시간 검증을 가능하게 하고 있습니다. 대량 생산되는 가전제품의 경우 가격 압박이 계속되고 있지만, 산업 및 의료 분야의 구매자는 정확성, 추적성, 장기적인 공급 보장을 위해 계속해서 높은 가격을 지불하고 있습니다.
세계 색 감지 센서 시장 동향 및 인사이트
개별 산업 및 공정 산업에서 공정 자동화의 발전 추세
자동차, 스마트폰, 기계를 조립하는 공장에서는 현재 라인을 멈추지 않고 부품 식별 확인, 도장 결함 발견, 도장 공차 이내 유지를 위해 인라인 색상 검사에 의존하고 있습니다. 화학 및 식품 제조업체는 비표준 배치가 포장 공정에 도달하기 전에 조정하기 위해 액체 흐름에 대한 연속적인 색도 측정을 수행합니다. 주요 비전 장비 공급업체가 2025년 자동화 프로젝트에서 두 자릿수 매출 증가를 기록함에 따라 시장 성장이 가속화되었습니다. 이더넷 지원 센서는 프로그래머블 로직 컨트롤러(PLC)에 데이터를 전송하고 피드백 루프를 형성하여 첫 번째 합격률을 높이고 재작업 작업을 줄입니다. 새로운 응용 분야로는 재활용을 위한 색으로 구분된 플라스틱의 선별, 제약 라인에서 약물의 방출 속도와 상관관계가 있는 정제 코팅의 실시간 검증 등이 있습니다.
스마트폰 및 웨어러블 기기의 색 감지 센서 보급 확대
스마트폰과 스마트 워치 제조업체들은 카메라 옆이나 유리 아래에 RGB 및 RGB+IR 다이오드를 탑재하여 맥박, 혈중 산소포화도, 심지어 피부색까지 읽어내어 뷰티 조언을 제공합니다. 휴대폰의 연간 생산량이 수억 대에 달하면서 부품 가격이 급락하고, 공급업체들은 패키지 크기를 2mm 미만으로 줄이면서 최대 14개 채널의 분광 출력을 추가해야 하는 상황에 직면해 있습니다. 현재 연구개발(R&D)은 규제 당국이 의료기기로서의 소프트웨어에 대한 가이드라인을 마련하는 대로 임상 시장을 개척할 수 있는 비침습적 혈당 검사를 목표로 하고 있습니다. 따라서 대량 생산되는 모바일 분야가 소형화 자금의 원천이 되고, 산업 및 의료 분야 채택자들이 이를 빠르게 전환하고 있습니다.
높은 초기 비용과 ROI에 대한 우려
센서, 광학, 통합 소프트웨어를 포함한 인라인 컬러 스테이션의 가격은 미화 1만 달러가 넘을 수 있어 자본이 부족한 소규모 공장에는 장벽이 될 수 있습니다. 색 검출 시스템의 투자 회수율(ROI) 계산은 불량률, 생산 처리량, 도입 규모에 따라 달라지기 때문에 그 변동폭이 매우 큽니다. 따라서 경영진은 인건비 상승이나 고객의 품질 요구 사항 강화와 같은 외부 압력으로 인해 도입이 불가피할 때까지는 자본 투입에 신중을 기하게 됩니다. 이러한 망설임이 지금까지 도입 지연으로 이어졌지만, 각 벤더들은 재무적 리스크를 줄이는 유연한 비즈니스 모델을 통해 이 문제에 대한 대응을 강화하고 있습니다.
부문 분석
2025년 기준, RGB 센서는 3채널 데이터가 많은 가전 및 자동차 용도의 요구 사항을 충족하기 때문에 RGB 센서가 색 감지 센서 시장 점유율의 41.27%를 차지하며 수량 기준으로 선두를 유지하고 있습니다. 그러나 제약용 코팅, 정밀농업, 위조방지 등의 응용 분야에서 높은 파장 분해능의 정보가 요구됨에 따라 스펙트럼 디바이스는 CAGR 7.61%로 성장을 지속하고, 있습니다. RGB+IR 하이브리드는 심박수 측정의 정확도와 저조도에서의 콘트라스트를 향상시키는 근적외선 채널을 추가하여 이 간극을 메우고 있습니다.
스펙트럼 아키텍처는 RGB에서 포착할 수 없는 구성과 층의 두께를 드러내는 세부적인 시그니처를 포착합니다. 드론에 탑재된 하이퍼스펙트럼 페이로드는 수백 개의 밴드를 스캔하여 작물의 건강 상태를 매핑하고, 인라인 어레이는 분말의 열화에 따른 색상 편차가 없는지, 적층 가공(AM)의 각 층을 모니터링합니다. CMOS 이미지 센서는 반도체 비용 곡선에 따라 계속 상승하고 있으며, 과거에는 프리미엄 기능이었던 것이 미드 레인지 디바이스의 표준 옵션으로 변모하고 있습니다. 포토다이오드 어레이는 이미지 기능은 부족하지만 뛰어난 신호 대 잡음비를 실현하고, 공간 해상도보다 분광 정확도가 중요한 웹 검사에서 여전히 필수적인 존재입니다.
지역별 분석
아시아태평양은 2025년 세계 매출의 37.54%를 차지하며 2031년까지 연평균 복합 성장률(CAGR) 7.56%를 나타낼 것으로 예측됩니다. 중국의 휴대폰 및 웨어러블 단말기 조립 공장에서는 매년 수억 개의 RGB+IR 칩이 내장되어 있으며, 일본은 로봇 공학의 전문성을 활용하여 용접 및 도장 공정에 색상 검사를 도입하고 있습니다. 인도의 제네릭 의약품 대기업은 FDA의 수입 요건을 충족하기 위해 인라인 분광광도계를 도입했으며, 싱가포르와 말레이시아에는 컬러 센싱 시스템이 인쇄된 솔더 페이스트를 검증하는 반도체 백엔드 공장이 있습니다. 한편, 호주에서는 광활한 농지를 조사하고 비료 살포의 정확도를 높이기 위해 드론에 하이퍼스펙트럼 장치를 탑재하고 있습니다.
북미도 그 뒤를 잇고 있습니다. 이는 FDA의 엄격한 색소 첨가제 규제에 따라 제약업체가 모든 로트 검증을 의무화하는 데 따른 것입니다. 디트로이트의 도장 공장은 보증 청구를 피하기 위해 즉각적인 색조 검사에 의존하고 있으며, 미국의 주요 항공우주 제조업체는 복합재 층을 검사하기 위해 컬러 비전을 활용하고 있습니다. 캐나다의 식품 포장업체와 멕시코의 급성장하는 자동차 공장은 수출 목표를 달성하기 위해 컬러스테이션을 도입하고 있습니다.
유럽은 머신 비전 조사 및 패키징 관련 법규 분야에서 계속해서 선도적인 위치를 유지하고 있습니다. 독일 자동차 제조업체는 색상과 질감 분석을 결합하여 전 세계 공급망에서 일관된 마감을 보장하고, 프랑스 식품 규제 당국은 라벨의 색조에 대한 엄격한 허용 오차를 철저히 관리하고 있습니다. 영국 제약업계에서는 브렉시트로 인해 컴플라이언스 관련 사무처리가 내재화되면서 인라인 도입이 가속화되었습니다. 남미, 중동 및 아프리카는 현재 규모가 작지만, 브라질의 섬유 공장과 사우디아라비아의 석유화학 정제소에서는 보다 광범위한 인더스트리 4.0 투자의 일환으로 환경 친화적인 센서를 도입하고 있습니다.
기타 특전:
- 엑셀 형식 시장 예측(ME) 시트
- 3개월간 애널리스트 지원
자주 묻는 질문
목차
제1장 서론
제2장 조사 방법
제3장 주요 요약
제4장 시장 구도
제5장 시장 규모와 성장 예측
제6장 경쟁 구도
제7장 시장 기회와 향후 전망
JHS 26.06.02The color detection sensor market size is expected to increase from USD 1.59 billion in 2025 to USD 1.72 billion in 2026 and reach USD 2.37 billion by 2031, growing at a CAGR of 6.63% over 2026-2031.
Demand keeps rising as factory owners digitize quality control, smartphone and wearable brands embed chromatic modules for health monitoring, and regulators tighten rules on color uniformity in food and pharmaceutical packaging. Investment is also flowing toward hyperspectral research that promises material-level insights far beyond classic RGB, while machine-learning firmware shortens inspection cycles and trims scrap. Vendors are responding with miniaturized, low-power devices that fit next to camera sensors or robot grippers, allowing real-time validation without slowing throughput. Pricing pressure persists in high-volume consumer electronics, yet industrial and healthcare buyers continue to pay a premium for accuracy, traceability, and long-term supply assurance.
Global Color Detection Sensor Market Trends and Insights
Rising Process Automation Across Discrete and Process Industries
Factories that assemble cars, smartphones, or machinery now rely on inline color checks to confirm part identity, spot coating flaws, and hold paint within tolerance without pausing the line. Chemical and food producers run continuous colorimetry on liquid streams to trigger adjustments before off-spec batches reach packaging. Growth accelerated after large vision suppliers posted double-digit revenue gains from 2025 automation projects. Ethernet-ready sensors feed programmable logic controllers, closing feedback loops that lift first-pass yield and trim rework. Emerging uses include color-coded plastic sorting for recycling and real-time verification of tablet coating in pharma lines where hue correlates with drug release rates.
Proliferation of Color Sensors in Smartphones and Wearables
Phone and watch makers mount RGB and RGB+IR diodes beside cameras or under glass to read pulse, blood-oxygen saturation, and even skin tone for cosmetic advice. With annual handset volumes in the hundreds of millions, component pricing has plunged, spurring suppliers to shrink packages to under 2 mm while adding up to 14 channels of spectral output. R&D now targets non-invasive glucose tests that could open clinical markets once regulators complete guidance on software-as-a-medical-device rules. The high-volume mobile segment, therefore, finances miniaturization that industrial and healthcare adopters quickly repurpose.
High Upfront Cost and ROI Concerns
An inline color station, including a sensor, optics, and integration software, can cost more than USD 10,000, a hurdle for smaller factories with limited capital. Return-on-investment calculations for color detection systems are highly variable, since they depend on scrap rates, production throughput, and the scale of deployment, which makes managers cautious about committing capital until external pressure, such as rising labor costs or stricter customer quality clauses, forces their hand. This hesitation has historically slowed adoption, but vendors are increasingly addressing it with flexible business models that reduce financial risk.
Other drivers and restraints analyzed in the detailed report include:
- Adoption in Industrial Robotics and Machine-Vision Systems
- Stringent Color-Matching Standards in Food-Pharma Packaging
- Ambient-Light Sensitivity and Calibration Complexities
For complete list of drivers and restraints, kindly check the Table Of Contents.
Segment Analysis
RGB sensors held 41.27% of the color-detection sensor market share in 2025, maintaining volume leadership because three-channel data satisfies many consumer electronics and automotive applications. Spectral devices, however, are registering a 7.61% CAGR as pharmaceutical coatings, precision agriculture, and counterfeit-protection applications demand wavelength-resolved insight. RGB+IR hybrids bridge the gap by adding near-infrared channels that enhance heart-rate readings and low-light contrast.
Spectral architectures capture detailed signatures that reveal composition and layer thickness, which RGB cannot see. Hyperspectral payloads on drones scan hundreds of bands to map crop health, while inline arrays monitor additive manufacturing layers for color drift linked to powder degradation. CMOS image sensors continue to ride semiconductor cost curves, turning once-premium features into standard options for mid-range devices. Photodiode arrays, though lacking imagery, deliver exceptional signal-to-noise and remain staples in web inspection where spatial resolution matters less than spectral fidelity.
The Color Detection Sensor Market Report is Segmented by Sensor Type (RGB, RGB+IR, Spectral, CMOS, and More), Form Factor (Discrete Module, Embedded, and OEM), End-User Industry (Food and Beverage, Healthcare, Chemical, Textile, Automotive, and More), and Geography. The Market Forecasts are Provided in Terms of Value (USD).
Geography Analysis
Asia-Pacific captured 37.54% of global revenue in 2025 and is forecast to post a 7.56% CAGR through 2031. China's handset and wearable assembly complexes integrate hundreds of millions of RGB+IR chips each year, while Japan leverages robotics expertise to add color checks to welding and painting cells. India's generic pharmaceutical leaders deploy inline spectrophotometers to meet FDA import requirements, and Singapore and Malaysia house semiconductor back-end plants where color-sensing systems validate printed solder paste. Australia, meanwhile, mounts hyperspectral rigs on drones to survey broadacre farms, improving fertilizer targeting.
North America follows closely, driven by stringent FDA color additive rules that require pharmaceutical makers to validate every lot. Detroit paint shops rely on instant tint checks to avoid warranty claims, and U.S. aerospace primes use color vision to inspect composite layers. Canada's food packagers and Mexico's fast-growing auto plants are integrating color stations to meet export targets.
Europe maintains leadership in machine-vision research and packaging legislation. German carmakers combine color and texture analysis to guarantee consistent finishes across global supply chains, and French food regulators enforce tight label-tone tolerance. The United Kingdom's pharma sector accelerated inline adoption after Brexit shifted compliance paperwork in-house. South America and the Middle East and Africa remain smaller today, yet Brazilian textile mills and Saudi petrochemical refineries are installing ruggedized sensors as part of broader Industry 4.0 investments.
- SICK AG
- Ams-Osram AG
- Keyence Corporation
- Omron Corporation
- Vishay Intertechnology Inc.
- EMX Industries Inc.
- Wenglor Sensoric GmbH
- Panasonic Corporation
- Astech Applied Sensor Technology GmbH
- Banner Engineering Corporation
- Baumer NV
- Rockwell Automation Inc.
- Datalogic SpA
- SensoPart Industriesensorik GmbH
- Jenoptik AG
- Hamamatsu Photonics KK
- Balluff GmbH
- Pepperl+Fuchs Inc.
- Tri-Tronics Company Inc.
- IDEC Corporation
Additional Benefits:
- The market estimate (ME) sheet in Excel format
- 3 months of analyst support
TABLE OF CONTENTS
1 INTRODUCTION
- 1.1 Study Assumptions and Market Definition
- 1.2 Scope of the Study
2 RESEARCH METHODOLOGY
3 EXECUTIVE SUMMARY
4 MARKET LANDSCAPE
- 4.1 Market Overview
- 4.2 Market Drivers
- 4.2.1 Rising Process Automation Across Discrete and Process Industries
- 4.2.2 Proliferation of Color Sensors in Smartphones and Wearables
- 4.2.3 Adoption in Industrial Robotics and Machine-Vision Systems
- 4.2.4 Stringent Color-Matching Standards in Food-Pharma Packaging
- 4.2.5 Inline Color Measurement for Additive Manufacturing
- 4.2.6 Hyperspectral Color Sensing in Precision-Agri Drones
- 4.3 Market Restraints
- 4.3.1 High Upfront Cost and ROI Concerns
- 4.3.2 Ambient-Light Sensitivity and Calibration Complexities
- 4.3.3 Availability of Low-Cost Monochrome Alternatives
- 4.3.4 Rare-Earth Photodiode Material Supply Volatility
- 4.4 Industry Value Chain Analysis
- 4.5 Regulatory Landscape
- 4.6 Technological Outlook
- 4.7 Porter's Five Forces Analysis
- 4.7.1 Bargaining Power of Suppliers
- 4.7.2 Bargaining Power of Buyers
- 4.7.3 Threat of New Entrants
- 4.7.4 Threat of Substitutes
- 4.7.5 Intensity of Competitive Rivalry
- 4.8 Impact of Macroeconomic Factors on the Market
5 MARKET SIZE AND GROWTH FORECASTS (VALUE)
- 5.1 By Sensor Type
- 5.1.1 RGB
- 5.1.2 RGB+IR
- 5.1.3 Spectral
- 5.1.4 CMOS
- 5.1.5 Photodiode Array
- 5.2 By Form Factor
- 5.2.1 Discrete Module
- 5.2.2 Embedded
- 5.2.3 OEM
- 5.3 By End-User Industry
- 5.3.1 Food and Beverage
- 5.3.2 Healthcare
- 5.3.3 Chemical
- 5.3.4 Textile
- 5.3.5 Automotive
- 5.3.6 Consumer Electronics
- 5.3.7 Rest of End-User Industries
- 5.4 By Geography
- 5.4.1 North America
- 5.4.1.1 United States
- 5.4.1.2 Canada
- 5.4.1.3 Mexico
- 5.4.2 South America
- 5.4.2.1 Brazil
- 5.4.2.2 Argentina
- 5.4.2.3 Rest of South America
- 5.4.3 Europe
- 5.4.3.1 Germany
- 5.4.3.2 United Kingdom
- 5.4.3.3 France
- 5.4.3.4 Italy
- 5.4.3.5 Spain
- 5.4.3.6 Rest of Europe
- 5.4.4 Asia-Pacific
- 5.4.4.1 China
- 5.4.4.2 Japan
- 5.4.4.3 India
- 5.4.4.4 Singapore
- 5.4.4.5 Australia
- 5.4.4.6 Malaysia
- 5.4.4.7 Rest of Asia-Pacific
- 5.4.5 Middle East
- 5.4.5.1 Saudi Arabia
- 5.4.5.2 United Arab Emirates
- 5.4.5.3 Rest of Middle East
- 5.4.6 Africa
- 5.4.6.1 South Africa
- 5.4.6.2 Egypt
- 5.4.6.3 Rest of Africa
- 5.4.1 North America
6 COMPETITIVE LANDSCAPE
- 6.1 Market Concentration
- 6.2 Strategic Moves
- 6.3 Market Share Analysis
- 6.4 Company Profiles (includes Global Level Overview, Market Level Overview, Core Segments, Financials as available, Strategic Information, Market Rank/Share, Products and Services, Recent Developments)
- 6.4.1 SICK AG
- 6.4.2 Ams-Osram AG
- 6.4.3 Keyence Corporation
- 6.4.4 Omron Corporation
- 6.4.5 Vishay Intertechnology Inc.
- 6.4.6 EMX Industries Inc.
- 6.4.7 Wenglor Sensoric GmbH
- 6.4.8 Panasonic Corporation
- 6.4.9 Astech Applied Sensor Technology GmbH
- 6.4.10 Banner Engineering Corporation
- 6.4.11 Baumer NV
- 6.4.12 Rockwell Automation Inc.
- 6.4.13 Datalogic SpA
- 6.4.14 SensoPart Industriesensorik GmbH
- 6.4.15 Jenoptik AG
- 6.4.16 Hamamatsu Photonics KK
- 6.4.17 Balluff GmbH
- 6.4.18 Pepperl+Fuchs Inc.
- 6.4.19 Tri-Tronics Company Inc.
- 6.4.20 IDEC Corporation
7 MARKET OPPORTUNITIES AND FUTURE OUTLOOK
- 7.1 White-Space and Unmet-Need Assessment