
|
시장보고서
상품코드
2044153
투명 디스플레이 시장 : 점유율 분석, 산업 동향 및 통계, 성장 예측(2026-2031년)Transparent Display - Market Share Analysis, Industry Trends & Statistics, Growth Forecasts (2026 - 2031) |
||||||
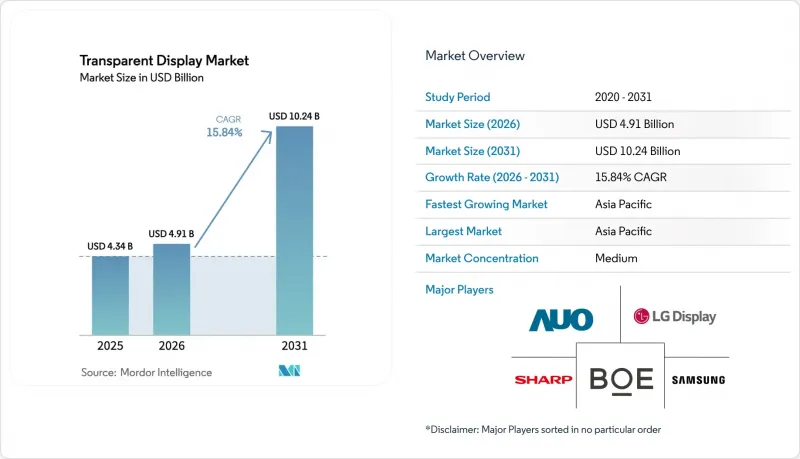
투명 디스플레이 시장 규모는 2025년에 43억 4,000만 달러로 평가되었고 2026년 49억 1,000만 달러에서 2031년까지 102억 4,000만 달러에 이를 것으로 예측되며, 예측 기간(2026-2031년) CAGR은 15.84%를 나타낼 전망입니다.
자동차 OEM은 증강현실(AR) 헤드업 디스플레이를 장착하고, 고급 소매업체는 인터랙티브 쇼윈도를 통해 소비자를 실제 매장으로 불러들이고, 방산 관련 기업은 조종사가 주변 상황을 확인할 수 있는 투명 장갑 조종석을 검사하고 있습니다. 2026년 2월 'QuadAlliance'가 결성된 것은 Tier 1 공급업체들이 투명 패널을 틈새 시장용 부가기능이 아닌 확장 가능한 플랫폼으로 인식하기 시작했음을 보여줍니다. 수직계열 업체들은 초기 수율이 50% 정도에 불과한 8.6세대 OLED 팹의 자본 부담을 계속 흡수하고 있습니다. 중국 이외 지역에서는 인듐 주석 산화물(ITO) 가격이 1kg당 400달러를 넘어 장기 공급 계약을 맺지 않은 통합 제조업체를 압박하고 있습니다. 이러한 요인들이 결합되어 규모, 안정적인 조달, 첨단 광학 기술이 경쟁 우위를 결정하는 시장이 형성되고 있습니다.
세계 투명 디스플레이 시장 동향과 인사이트
차량용 HUD 및 클러스터 디스플레이 채용 확대
자동차 제조업체들은 운전자가 시선을 떼지 않고도 내비게이션 정보나 충돌 경보를 받을 수 있도록 앞 유리나 계기판에 투명 디스플레이를 내장하고 있습니다. 2026년 2월 ZEISS, tesa, Saint-Gobain Sekurit, 현대모비스가 결성한 'QuadAlliance'는 2029년 홀로그램 헤드업 디스플레이(HUD) 양산을 목표로 하고 있습니다. 수직 시야각을 3배 확대할 예정입니다. Visteon은 2025년 9월 FUTURUS와 제휴하여 증강현실(AR) 헤드업 디스플레이를 중형 세단에 도입했습니다. 이를 통해 생산량 증가를 통해 단가를 낮출 수 있습니다. 규제 측면에서의 움직임도 두드러지는데, UNECE 규정 125에서는 전방시야장치에 최소 70%의 투명도를 요구하고 있으며, ISO/TS 21957:2023에서는 검사 절차가 통일되어 승인까지의 기간이 몇 개월 단축되고 있습니다. 2025년 3월, 코베스트로는 ISO 16750-3의 기계적 충격 테스트를 통과한 폴리카보네이트 중간층을 출시하여 공급업체가 다년간의 보증을 제공할 수 있는 자신감을 갖게 되었습니다. 표준의 명확화, 공급업체 간의 협력, 내충격성 소재 등의 요소가 결합되어 2028년까지 많은 주류 차량에 투명 HUD가 표준으로 장착될 것으로 예측됩니다.
몰입형 매장 전면에 대한 소매 및 디지털 사이니지에 대한 수요
고급 브랜드와 쇼핑몰 운영사들은 실물에 리치미디어를 겹쳐서 표시하는 투명 디스플레이를 도입하여 쇼윈도를 역동적인 광고 매체로 바꾸고 있습니다. LG디스플레이는 2025년 9월 도쿄 부티크에 55인치 투명 OLED 패널을 도입하여 검사 운영 중 체류 시간이 30%-40% 증가했다고 보고했습니다. Glass-Media는 2025년 11월, 투과율 85%의 초박형 투명 LED 포스터를 출시했습니다. 이를 통해 소매업체는 시야를 가리지 않고 몇 초마다 캠페인을 전환할 수 있게 되었습니다. 기존 스크린으로는 설치할 수 없는 유리문이나 칸막이 벽에 직접 설치할 수 있기 때문에 패스트푸드점이나 교통 허브에서도 비슷한 방식으로 도입이 진행되고 있습니다. 평방미터당 50와트 이하의 전력을 소비하는 저전력 소비 OLED 패널은 체인점이 LEED의 에너지 요건을 충족하는 데 도움이 됩니다. 컨텐츠 관리 플랫폼이 클라우드로 전환됨에 따라 지역 가맹점은 수백 개의 매장 디스플레이를 원격으로 업데이트할 수 있게 되었고, 플래그십 매장 외의 다른 매장으로의 확장이 가속화되고 있습니다.
투명패널 제조공장의 낮은 수율과 높은 설비투자 비용
8.6세대 OLED 및 마이크로 LED 제조 공장에는 클린룸, 잉크젯 프린트 헤드, 다층 봉지 장비가 필요하며, 이로 인해 설비 투자 금액이 40억 달러 이상으로 증가하여 신규 진입을 제한하고 있습니다. TCL CSOT는 2025년 10월에 41억 5,000만 달러의 예산으로 이러한 시설을 건설하기 시작했지만, 생산 개시 첫 해의 수율은 50% 정도에 그칠 것으로 예상하고 있습니다. 유니버설 디스플레이의 2025년 3분기 실적은 가동률 하락이 전체 공급망 수익률을 압박할 수 있는 리스크를 부각시켰습니다. 수율 저하는 투명 음극의 미립자 오염과 유기물질을 열화시키는 수증기의 침입에 기인합니다. 수익원이 다각화된 대기업만이 수년에 걸친 투자 회수 기간을 견딜 수 있으며, 이는 세계 생산능력 확대를 억제하고 2028년 이후 수율이 80%를 넘어설 때까지 패널 가격의 고공행진을 초래할 것입니다.
부문 분석
액정표시장치(LCD)는 제조 설비가 성숙하고 패널 가격이 평방미터당 100달러 이하로 유지되면서 2025년에도 매출 점유율이 45.13%로 가장 큰 비중을 유지했습니다. 그러나 투과율은 70% 정도가 상한선이고, 밝기가 500니트를 넘는 경우는 드물기 때문에 야외에서 사용하기에는 한계가 있습니다. 유기EL(OLED)은 CAGR 15.84%로 발전하고 있으며, 백라이트 없이 자체 발광 픽셀이 1,000니트에 달하고, 이미 자동차 HUD용 UNECE 광도 기준을 충족하고 있습니다. 소매업체와 자동차 제조업체들이 더 높은 콘트라스트를 위해 더 높은 가격을 지불함에 따라 OLED 패널의 투명 디스플레이 시장 규모는 2029년까지 액정 디스플레이의 매출액을 넘어설 것으로 예상되고 있습니다. 마이크로 LED는 더 긴 수명을 약속하며, 결함률을 10ppm 이하로 낮추는 유체 자기조직화 및 레이저 대량 전사 기술에 힘입어 2031년까지 연평균 복합 성장률(CAGR) 15.93%로 가장 높은 성장률을 나타낼 것으로 예측됩니다. 투명 프로젝션과 일렉트로 크로믹 필름은 영상 해상도보다 동적 불투명도와 저비용이 중요한 특수한 설치 환경이나 스마트 윈도우를 위해 제공되고 있습니다.
각 제조업체들은 이에 따라 제품 포트폴리오를 구분하고 있습니다. 한국 기업들은 독자적인 OLED 스택을 활용하여 고수익률의 틈새 시장을 지키고 있으며, 중국 업체들은 실내 사이니지용으로 저가의 LCD 디스플레이 유닛을 출하하고 있습니다. 시간이 지남에 따라 8.6세대 OLED 라인의 수율 향상으로 액정표시장치(LCD)와의 비용 격차가 줄어들고, 중견 소매업체들의 업그레이드를 촉진할 것으로 보입니다. 반면, 항공우주 분야 고객들은 OLED가 달성할 수 없는 90%에 가까운 투과율과 5,000니트를 훨씬 상회하는 밝기를 구현하는 마이크로 LED를 선호하고 있습니다. 이러한 양극화를 통해 공급업체는 '만능' 전략을 추구하지 않고 개별 이용 사례를 대상으로 할 수 있습니다.
소매와 디지털 사이니지는 실물 상품과 디지털 스토리텔링을 결합한 몰입형 매장의 확산에 힘입어 2025년 매출의 30.47%를 차지하며 가장 큰 비중을 차지했습니다. 자동차 부문은 헤드업 디스플레이와 클러스터 디스플레이가 고급차 옵션에서 양산형 모델의 기본 장착으로 전환되고 있어 16.29%의 가장 높은 CAGR을 나타낼 것으로 예측됩니다. ISO 및 UNECE 표준으로 인해 형식 인증에 대한 리스크가 감소함에 따라 2027년 이후 투명 디스플레이 시장 점유율은 꾸준히 상승할 것으로 예측됩니다. 가전제품과 스마트 가전은 규모는 작지만 여전히 활기찬 틈새 시장으로, 마이크로 OLED 기술의 발전으로 광 크로스토크가 크게 감소하고 밝은 실내에서 가시성이 향상되고 있습니다.
항공우주 및 방산 프로젝트는 조달 주기가 길어짐에 따라 진척이 더디지만, 높은 수익률이 소량 생산을 보완하고 있습니다. 창고 픽투라이트 시스템, 의료용 이미지 오버레이 등 상황 인식이 생산성 향상으로 이어지는 산업 및 기업용 도입은 꾸준히 성장하고 있습니다. 의료 및 교육 부문에서는 수술 계획 및 박물관 전시용으로 투명 스크린이 채택되고 있지만, 예산의 제약으로 인해 판매량이 제한되어 있습니다. 전반적으로 OEM 업체들은 SAE J1757/1 및 IEC 62471과 같은 산업별 표준을 준수하도록 투명 디스플레이를 설계하고 있습니다. 이로 인해 인증 비용은 증가하지만, 승인을 받으면 벤더 락인(Vendor Lock-in)이 강화됩니다.
지역별 분석
아시아태평양은 2025년 매출의 40.38%를 차지했으며, 중국의 LCD 및 OLED 기반과 한국의 프리미엄 OLED 기술력으로 인해 16.56%의 가장 높은 CAGR을 나타낼 것으로 보입니다. BOE는 CES 2024에서 55인치 4K 투명 OLED 디스플레이를 공개하고 양산 출하를 목표로 하고 있으며, 한국의 기존 제조업체들에게 도전장을 내밀고 있습니다. LG디스플레이와 삼성은 5자릿수 가격대이면서 고급 소매점 및 자동차 제조업체 고객을 대상으로 한 투명 OLED와 마이크로LED 시제품을 발표했습니다. 일본은 샤프와 재팬디스플레이를 통해 산업용 솔루션을 제공하고 있지만, 인도에서는 패널 제조 능력이 제한적이기 때문에 도입은 아직 초기 단계에 머물러 있습니다.
북미와 유럽은 성숙한 시장이지만 규제 주도형입니다. 미국은 2024년 9월 중국산 인듐에 25%의 관세를 부과했고, 이로 인해 인티그레이터들은 장기적인 공급을 확보하거나 수익률 하락을 흡수할 수밖에 없는 상황에 처했습니다. UNECE 규정 125는 70%의 투명성 기준을 명확히 하고, 유럽 자동차 제조업체의 채택을 가속화하고 있습니다. 생고뱅 세이지글라스(Saint-Gobain SageGlass)와 같은 스마트 창호 업체들은 건물 외피를 업그레이드하는 소유주에게 LEED(Leadership in Energy and Environmental Design) 포인트를 확보하고 있습니다. 중동에서는 넷제로 의무화에 따라 미디어를 스트리밍하면서 전기를 생산하는 이중용도 외장유리의 도입이 추진되고 있습니다.
남미와 아프리카는 여전히 초기 단계 시장입니다. 브라질의 소매 산업과 남아공의 스마트시티 지역에서의 시범 도입은 실현 가능성을 보여주고 있지만, 수입 관세와 제한된 자본 예산으로 인해 제약을 받고 있습니다. 전반적으로 아시아태평양은 여전히 생산의 중심지이며, 북미와 유럽은 공급망 전체에 파급되는 성능 및 지속가능성 벤치마크를 확립하고 있습니다.
기타 혜택
- 엑셀 형태 시장 예측(ME) 시트
- 3개월간 애널리스트 지원
자주 묻는 질문
목차
제1장 서론
제2장 조사 방법
제3장 주요 요약
제4장 시장 구도
제5장 시장 규모와 성장 예측
제6장 경쟁 구도
제7장 시장 기회와 향후 전망
JHS 26.06.02The Transparent display market size was valued at USD 4.34 billion in 2025 and is estimated to grow from USD 4.91 billion in 2026 to reach USD 10.24 billion by 2031, at a CAGR of 15.84% during the forecast period (2026-2031). Automotive original equipment manufacturers are embedding augmented-reality head-up displays, luxury retailers are adopting interactive storefronts to draw consumers back into physical stores, and defense contractors are testing transparent-armor cockpits that keep pilots aware of their surroundings. The formation of the QuadAlliance in February 2026 signals that Tier-1 suppliers now view transparent panels as a scalable platform rather than a niche add-on. Vertically integrated manufacturers continue to absorb the capital burden of Gen 8.6 organic light-emitting diode fabs where initial yields can be as low as 50%. Indium-tin-oxide prices above USD 400 per kilogram outside China are squeezing integrators that lack long-term supply contracts. These converging forces are shaping a market in which scale, secure sourcing, and advanced optics define competitive advantage.

Global Transparent Display Market Trends and Insights
Rising Adoption in Automotive HUD and Cluster Displays
Original equipment manufacturers are embedding transparent displays in windshields and instrument panels so drivers can receive navigation cues and collision alerts without shifting their gaze. The QuadAlliance formed in February 2026 by ZEISS, tesa, Saint-Gobain Sekurit, and Hyundai Mobis is targeting 2029 mass production of holographic head-up displays, tripling vertical field of view compared with today's systems. Visteon partnered with FUTURUS in September 2025 to migrate augmented-reality HUDs into mid-tier sedans, a move that will lower unit costs through higher volumes. Regulatory momentum is visible as UNECE Regulation 125 requires at least 70% transparency for forward-vision devices, while ISO/TS 21957:2023 harmonizes test procedures, cutting approval time by months. Covestro introduced polycarbonate interlayers in March 2025 that pass ISO 16750-3 mechanical-shock tests, giving suppliers confidence to offer multi-year warranties. Collectively, standards clarity, supplier alliances, and ruggedized materials point to transparent HUDs becoming standard on many mainstream vehicles by 2028.
Retail and Digital-signage Demand for Immersive Storefronts
Luxury labels and mall operators are installing transparent displays that overlay rich media onto physical products, turning windows into dynamic advertising canvases. LG Display deployed 55-inch transparent organic light-emitting diode panels across Tokyo boutiques in September 2025 and reported a 30% to 40% lift in dwell time during pilots. Glass-Media introduced ultra-thin transparent LED posters in November 2025 with 85% transparency, enabling retailers to rotate campaigns every few seconds while maintaining unobstructed views. Quick-service restaurants and transit hubs are following suit because transparent panels attach directly to glass doors or partition walls where conventional screens cannot fit. Low-power organic light-emitting diode variants consuming under 50 watts per square meter help chains meet LEED energy prerequisites. As content-management platforms move to the cloud, regional franchises can update hundreds of storefronts remotely, accelerating roll-outs beyond flagship locations.
Low Yield and High CAPEX of Transparent Panel Fabs
Gen 8.6 organic light-emitting diode and micro-LED fabs demand cleanrooms, inkjet printing heads, and multilayer encapsulation tools that push capital expenditure above USD 4 billion, limiting new entrants. TCL CSOT broke ground on such a facility in October 2025 with a USD 4.15 billion budget yet acknowledged yields will hover near 50% during the first production year. Universal Display's third-quarter 2025 results underscored the risk when lower utilization drags on margins across the supply chain. Yield losses originate from particulate contamination in transparent cathodes and water-vapor ingress that degrades organics. Only conglomerates with diversified earnings can endure multi-year payback periods, which curbs global capacity expansion and keeps panel prices elevated until yields climb above 80% post-2028.
Other drivers and restraints analyzed in the detailed report include:
- Rapid AR and VR Headset Proliferation
- Cost-down Roadmap for Micro-LED Transparent Panels
- Indium-tin-oxide Supply Risk and Price Volatility
For complete list of drivers and restraints, kindly check the Table Of Contents.
Segment Analysis
Liquid-crystal display retained the largest 45.13% revenue share in 2025 due to mature tooling and panel prices under USD 100 per square meter. Transparency, however, tops out near 70% and brightness rarely exceeds 500 nits, which restricts outdoor use. Organic light-emitting diode is advancing at a 15.84% CAGR and already meets UNECE photometric criteria for automotive HUDs because self-emissive pixels hit 1,000 nits without a backlight. The transparent display market size for organic light-emitting diode panels is projected to overtake liquid-crystal display revenue by 2029 as retailers and automakers pay premiums for higher contrast. Micro-LED promises even longer lifetimes and is forecast to post the fastest 15.93% CAGR through 2031, supported by fluidic self-assembly and laser mass-transfer techniques that drive defect rates below 10 ppm. Transparent projection and electrochromic films serve specialty installations and smart windows, where imagery resolution is less critical than dynamic opacity or low cost.
Manufacturers segment their portfolios accordingly. Korean firms leverage proprietary organic light-emitting diode stacks to defend high-margin niches, while Chinese producers ship low-cost liquid-crystal display units for indoor signage. Over time, rising yields from Gen 8.6 organic light-emitting diode lines narrow the cost gap with liquid-crystal display, encouraging mid-tier retailers to upgrade. Conversely, aerospace customers favor micro-LED for cockpit transparency near 90% and brightness well above 5,000 nits, performance unattainable with organic light-emitting diode. This bifurcation lets suppliers target discrete use cases rather than pursuing a one-size-fits-all strategy.
Retail and digital signage generated the largest slice of 2025 revenue at 30.47%, driven by immersive storefronts that merge physical goods with digital storytelling. Automotive is on course for the sharpest 16.29% CAGR because head-up and cluster displays are transitioning from luxury options to standard features across volume models. The transparent display market share for automotive applications is expected to rise steadily after 2027 as ISO and UNECE standards reduce homologation risk. Consumer electronics and smart appliances remain a smaller but vibrant niche where micro-organic light-emitting diode advances slash optical crosstalk, improving readability in bright rooms.
Aerospace and defense projects progress slowly under extended procurement cycles, yet high margins compensate for low volumes. Industrial and enterprise deployments such as warehouse pick-to-light systems and medical imaging overlays grow steadily where situational awareness pays productivity dividends. Healthcare and education adopt transparent screens for surgical planning and museum exhibits, though budgets limit unit sales. Overall, OEMs design transparent displays to meet sector-specific standards like SAE J1757/1 and IEC 62471, which elevates certification cost but reinforces vendor lock-in once approvals are secured.
The Transparent Display Market Report is Segmented by Technology (LCD, OLED, Micro-LED, and More), End-User Industry (Retail and Digital Signage, Consumer Electronics and Smart Appliances, and More), Application (Interactive Storefronts, HUD and More), Display Size (Less Than 10", 10"-39", and More), and Geography. The Market Forecasts are Provided in Terms of Value (USD).
Geography Analysis
Asia Pacific generated 40.38% of 2025 sales and will log the highest 16.56% CAGR thanks to China's liquid-crystal display and organic light-emitting diode base and South Korea's premium organic light-emitting diode prowess. BOE demonstrated a 55-inch 4K transparent organic light-emitting diode at CES 2024 and aims to ship in volume, challenging Korean incumbents. LG Display and Samsung unveiled transparent organic light-emitting diode and MicroLED prototypes that cost five-figure sums yet address premium retail and automotive clients. Japan contributes industrial solutions through Sharp and Japan Display, whereas India's adoption is still nascent given limited panel-making capacity.
North America and Europe are mature but regulation driven. The United States imposed a 25% tariff on Chinese indium in September 2024, pushing integrators to lock long-term supply or absorb margin erosion. UNECE Regulation 125 provides clarity on 70% transparency thresholds, accelerating European automaker adoption. Smart-window providers such as Saint-Gobain SageGlass secure Leadership in Energy and Environmental Design points for building owners upgrading their envelopes. The Middle East pursues dual-use facade glass that generates power while streaming media, aligning with net-zero mandates.
South America and Africa remain early-stage markets. Pilot deployments in Brazil's retail sector and South Africa's smart-city corridors demonstrate feasibility but are constrained by import duties and limited capital budgets. Overall, Asia Pacific remains the production powerhouse, while North America and Europe set performance and sustainability benchmarks that reverberate through the supply chain.
List of Companies Covered in this Report:
- LG Display Co., Ltd.
- Samsung Electronics Co., Ltd.
- BOE Technology Group Co., Ltd.
- Leyard Optoelectronic Co., Ltd. (Planar Systems Inc.)
- Panasonic Holdings Corporation
- Sharp Corporation
- AU Optronics Corporation
- Sony Group Corporation
- Crystal Display Systems Ltd.
- Pro Display UK Ltd.
- Hangzhou Hikvision Digital Technology Co., Ltd.
- Nexnovo Technology Co., Ltd.
- Shenzhen AuroLED Technology Co., Ltd.
- Tianma Micro-electronics Co., Ltd.
- Visionox Technology Inc.
- Japan Display Inc.
- 2Point0 Concepts LLC
- Xiaomi Inc.
- Visteon Corporation
- Continental AG
Additional Benefits:
- The market estimate (ME) sheet in Excel format
- 3 months of analyst support
TABLE OF CONTENTS
1 INTRODUCTION
- 1.1 Study Assumptions and Market Definition
- 1.2 Scope of the Study
2 RESEARCH METHODOLOGY
3 EXECUTIVE SUMMARY
4 MARKET LANDSCAPE
- 4.1 Market Overview
- 4.2 Market Drivers
- 4.2.1 Rising Adoption in Automotive HUD and Cluster Displays
- 4.2.2 Retail and Digital-signage Demand for Immersive Storefronts
- 4.2.3 Rapid AR/VR Headset Proliferation
- 4.2.4 Cost-down Roadmap for Micro-LED Transparent Panels
- 4.2.5 Dual-use Facade Glass Integrating Transparent PV-displays
- 4.2.6 Defense Investment in Transparent Armoured Cockpits
- 4.3 Market Restraints
- 4.3.1 Low Yield and High CAPEX of Transparent Panel Fabs
- 4.3.2 Sub-optimal Brightness / contrast Versus Conventional Displays
- 4.3.3 Indium-tin-oxide (ITO) Supply Risk and Price Volatility
- 4.3.4 Automotive Glare-safety Regulations Delaying Roll-outs
- 4.4 Value / Supply-Chain Analysis
- 4.5 Regulatory Landscape
- 4.6 Porter's Five Forces Analysis
- 4.6.1 Threat of New Entrants
- 4.6.2 Bargaining Power of Suppliers
- 4.6.3 Bargaining Power of Buyers
- 4.6.4 Threat of Substitutes
- 4.6.5 Degree of Competition
- 4.7 Impact of Macroeconomic Factors on the Market
5 MARKET SIZE AND GROWTH FORECASTS (VALUE)
- 5.1 By Technology
- 5.1.1 LCD
- 5.1.2 OLED
- 5.1.3 Micro-LED
- 5.1.4 Transparent Projection (LCoS / DLP)
- 5.1.5 Other Technologies
- 5.2 By End-user Industry
- 5.2.1 Retail and Digital Signage
- 5.2.2 Consumer Electronics and Smart Appliances
- 5.2.3 Automotive
- 5.2.4 Aerospace and Defense
- 5.2.5 Industrial and Enterprise
- 5.2.6 Others (Healthcare, Education)
- 5.3 By Application
- 5.3.1 Interactive Storefronts and Showcases
- 5.3.2 Head-Up Displays (HUD)
- 5.3.3 Augmented-Reality Wearables
- 5.3.4 Smart Windows and Architectural Glass
- 5.3.5 Exhibition and Museum Installations
- 5.4 By Display Size
- 5.4.1 Less than 10" (Micro)
- 5.4.2 10" - 39" (Medium)
- 5.4.3 Greater than or equal to 40" (Large)
- 5.5 By Geography
- 5.5.1 North America
- 5.5.1.1 United States
- 5.5.1.2 Canada
- 5.5.1.3 Mexico
- 5.5.2 South America
- 5.5.2.1 Brazil
- 5.5.2.2 Argentina
- 5.5.2.3 Rest of South America
- 5.5.3 Europe
- 5.5.3.1 Germany
- 5.5.3.2 United Kingdom
- 5.5.3.3 France
- 5.5.3.4 Italy
- 5.5.3.5 Rest of Europe
- 5.5.4 Asia-Pacific
- 5.5.4.1 China
- 5.5.4.2 Japan
- 5.5.4.3 South Korea
- 5.5.4.4 India
- 5.5.4.5 Rest of Asia-Pacific
- 5.5.5 Middle East
- 5.5.5.1 Saudi Arabia
- 5.5.5.2 United Arab Emirates
- 5.5.5.3 Rest of Middle East
- 5.5.6 Africa
- 5.5.6.1 South Africa
- 5.5.6.2 Rest of Africa
- 5.5.1 North America
6 COMPETITIVE LANDSCAPE
- 6.1 Market Concentration
- 6.2 Strategic Moves
- 6.3 Market Share Analysis
- 6.4 Company Profiles (includes Global-level Overview, Market-level Overview, Core Segments, Financials as available, Strategic Information, Market Rank/Share for key companies, Products and Services, and Recent Developments)
- 6.4.1 LG Display Co., Ltd.
- 6.4.2 Samsung Electronics Co., Ltd.
- 6.4.3 BOE Technology Group Co., Ltd.
- 6.4.4 Leyard Optoelectronic Co., Ltd. (Planar Systems Inc.)
- 6.4.5 Panasonic Holdings Corporation
- 6.4.6 Sharp Corporation
- 6.4.7 AU Optronics Corporation
- 6.4.8 Sony Group Corporation
- 6.4.9 Crystal Display Systems Ltd.
- 6.4.10 Pro Display UK Ltd.
- 6.4.11 Hangzhou Hikvision Digital Technology Co., Ltd.
- 6.4.12 Nexnovo Technology Co., Ltd.
- 6.4.13 Shenzhen AuroLED Technology Co., Ltd.
- 6.4.14 Tianma Micro-electronics Co., Ltd.
- 6.4.15 Visionox Technology Inc.
- 6.4.16 Japan Display Inc.
- 6.4.17 2Point0 Concepts LLC
- 6.4.18 Xiaomi Inc.
- 6.4.19 Visteon Corporation
- 6.4.20 Continental AG
7 MARKET OPPORTUNITIES AND FUTURE OUTLOOK
- 7.1 White-space and Unmet-need Assessment
