
|
시장보고서
상품코드
2044212
조달 소프트웨어 시장 : 점유율 분석, 산업 동향 및 통계, 성장 예측(2026-2031년)Procurement Software - Market Share Analysis, Industry Trends & Statistics, Growth Forecasts (2026 - 2031) |
||||||
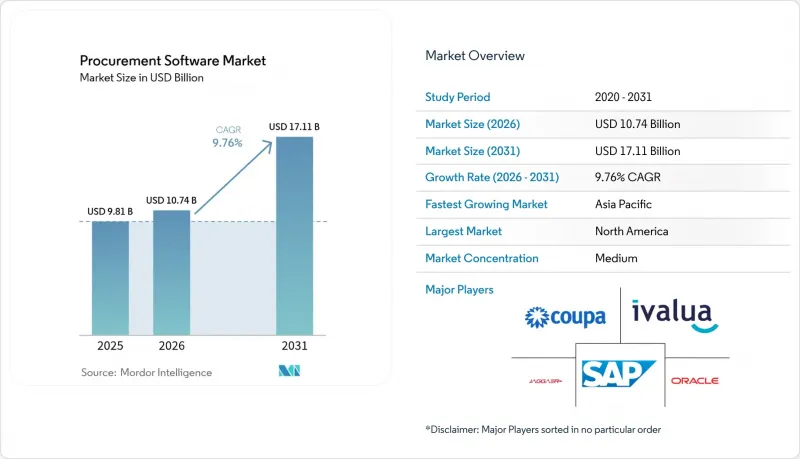
조달 소프트웨어 시장 규모는 2025년 98억 1,000만 달러, 2026년 107억 4,000만 달러에서 2031년까지 171억 1,000만 달러로 확대될 것으로 예측되고 있으며 2026년부터 2031년까지 연평균 복합 성장률(CAGR)은 9.76%를 나타낼 전망입니다.
수요의 핵심은 클라우드 네이티브 아키텍처, 생성형 AI 코파일럿, 토큰화된 국경 간 결제 인프라를 결합한 자율적인 워크플로우이며, 이는 각각 서비스 제공 비용을 절감하고 의사결정 주기를 가속화하는 역할을 합니다. 클라우드 도입이 주류가 된 이유는 탄력적인 SaaS 플랫폼이 데이터센터 오버헤드를 크게 줄이고, 지출 현황을 실시간으로 가시화하며, 모든 테넌트에 대해 거의 실시간으로 기능을 업데이트할 수 있기 때문입니다. 의료분야의 공동조달 조직이 조달 결정을 가치 기반 상환제도와 연동하여 최종 사용자의 채택을 확대하는 한편, 중소기업은 프리미엄 플랜과 설비투자를 운영비로 전환하는 임베디드 금융 서비스를 통해 시장에 진입하고 있습니다. 지역별로는 북미의 성숙한 시장이 현재 수익을 뒷받침하고 있지만, 아시아태평양은 공공 부문의 전자조달 의무화와 클라우드 도입이 빠르게 진행되면서 성장률이 북미를 상회하고 있습니다.
세계 조달 소프트웨어 시장 동향 및 인사이트
엔드 투 엔드 조달 워크플로우 자동화
기업들은 발주 요청, 승인, 공급업체 발굴, 계약 체결, 청구 처리를 하나의 플랫폼으로 통합하여 수작업으로 인한 인수인계를 없애고, 사이클 타임을 최대 절반으로 단축하고 있습니다. 현재 로봇 프로세스 자동화(RPA)가 구매 주문서의 대부분을 작성하고 있으며, 인적 자원은 공급업체 관계 관리(SRM)에 재분배되고 있습니다. 그 결과, 원자재 가격 변동에 노출된 업계에서는 운영비 절감률이 20%에 육박하고 있으며, 조기 도입 기업은 상품 가격 변동 시 수익률 보호를 위해 수량 할인을 협상할 수 있는 여지가 생기고 있습니다. 실시간 대시보드를 통해, 예산이 혼잡한 경우에도 몇 시간 내에 예산을 재분배할 수 있습니다. 이 기능은 2025년 반도체 부족 사태에서 결정적인 역할을 했습니다. 이러한 수준의 자동화를 달성한 기업들은 공급업체 온보딩이 크게 빨라지고, 단일 공급업체 리스크에 대한 탄력성이 강화되었다고 보고하고 있습니다.
ERP와 전자 조달 시스템의 완벽한 통합
핵심 ERP 시스템과 조달 스위트 간의 양방향 데이터 흐름을 통해 마스터 데이터 중복을 제거하고, 인보이스 불일치를 억제하며, 월별 결산 주기를 단축할 수 있습니다. 주요 벤더의 기성품 어댑터를 사용하면 사용자 정의 코드 없이도 계약 조건, 계정 코드, 세금 데이터를 동기화할 수 있어 여러 제품군을 운영하는 기업의 통합 위험을 줄일 수 있습니다. 또한, 미들웨어는 여러 ERP 인스턴스를 운영하는 복합 기업에서 데이터를 통합하고 비정규 지출을 가시화하며, 볼륨 할인을 활용할 수 있는 통합 지출 분석을 실현합니다. 원활한 통합을 완료한 기업들은 발주자가 익숙한 ERP 인터페이스 내에서 거래를 할 수 있기 때문에 전체 조달 직원의 생산성이 두 배 이상 향상되었다고 말합니다. 이러한 통합으로 인한 정착성은 결국 전환 비용을 높이고, 벤더와의 계약 갱신율을 높이는 요인으로 작용합니다.
레거시 시스템 통합의 복잡성
노후화되고 고도로 커스터마이징된 ERP 코드베이스를 보유한 기업들은 조달 제품군을 프로덕션에 적용하기까지 수개월에 걸친 매핑, 테스트, 수정 작업이 필요합니다. 레거시 SAP 및 Oracle 환경의 커스텀 확장 기능은 업그레이드 시 취약한 종속성을 만들어 예산을 증가시키고 ROI 실현을 지연시킬 수 있습니다. 공급업체 레코드의 중복과 같은 데이터 품질 문제는 동기화를 더욱 방해하고, 많은 경우 ERP 현대화가 완료될 때까지 플랫폼 도입을 연기할 수밖에 없는 상황으로 몰아넣는다. 현재 벤더들은 통합 위험의 일부를 자체적으로 부담하는 사전 인증된 커넥터를 제공하고 있지만, 고도로 맞춤화된 도입은 여전히 초기 일정을 초과할 수 있습니다. 이러한 장벽으로 인해 통합의 복잡성은 디지털 조달 프로그램이 정체되는 가장 큰 원인으로 꼽히고 있습니다.
부문 분석
2025년에는 클라우드 도입이 조달 소프트웨어 시장 점유율의 67.92%를 차지했습니다. 이는 기업들이 설비투자 없이도 트래픽의 급격한 증가를 흡수할 수 있는 탄력적인 용량을 선호하는 경향을 반영하고 있습니다. 이 부문의 CAGR 9.81%는 멀티테넌트 SaaS 플랫폼이 AI 모델 훈련 비용을 수천 개의 고객사에 분산시켜 자율적인 송장 대조 및 예측 리스크 스코어링이 중견기업에도 경제적으로 실현 가능하다는 것을 보여줍니다. 가능하게 하고 있습니다. 데이터 주권 관련 규제로 인해 외부 호스팅이 제한되는 국방, 금융 산업에서 On-Premise 도입은 여전히 지속되고 있지만, 하이브리드 아키텍처가 로컬에서의 트랜잭션 처리와 중앙집중형 분석을 결합하는 사례가 증가하고 있습니다. 또한, 엣지 컴퓨팅은 통신 환경이 불안정한 지역에서 사업을 영위하는 소매업체들에게도 지연을 줄이고 네트워크 장애 시에도 지속적인 트랜잭션의 흐름을 보장해주고 있어 많은 호응을 얻고 있습니다.
클라우드 벤더들이 분기 단위가 아닌 몇 시간 단위로 업데이트를 배포함으로써 전자 청구서 의무화, 탄소 배출량 보고 규정 등 규제 변화에 빠르게 대응할 수 있게 되면서 조달 소프트웨어 시장은 수혜를 입고 있습니다. 반면, On-Premise 도입 기업은 6-12개월의 업그레이드 주기로 인해 새로운 기능에 대한 접근이 지연되고, 총소유비용(TCO)이 상승하는 요인이 되고 있습니다. 규제 대상 기업들조차도 기밀 필드를 암호화하면서 멀티테넌트 경제성을 유지하는 '차폐형 SaaS' 모델을 시험적으로 도입하고 있으며, 이는 오랜 기간 동안 On-Premise가 쌓아온 견고한 입지가 점차 약화되고 있음을 시사합니다. 이러한 추세를 종합해 볼 때, 당분간 클라우드의 주도적 지위는 더욱 강화될 것으로 예측됩니다.
제조업은 2025년 매출에서 21.63%의 점유율을 차지하며 업계를 이끌었습니다. 이는 복잡한 BOM(Bill of Materials) 관리와 공급업체와의 긴밀한 협력이 요구되는 JIT(Just-in-Time) 재고 전략에 힘입은 것입니다. 그러나 가장 빠르게 성장하고 있는 분야는 의료 산업으로 9.79%의 연평균 복합 성장률(CAGR)을 기록하고 있습니다. 이는 병원이 조달비용 절감을 가치기반 상환지표와 연계하여 조달비용의 1% 단위의 절감은 수익과 직결되는 중요한 과제이기 때문입니다. 전자차트와의 시술 레벨에서의 연계를 통해 임상의는 임플란트 사용 현황을 벤치마킹하고, 근거에 기반한 가격 협상을 통해 정형외과 분야의 지출을 두 자릿수 절감할 수 있습니다. 공동구매 조직은 구매력을 증폭시키고, 병원이 감염관리, 재입원율 등의 지표를 기반으로 공급업체의 성과를 평가할 수 있도록 돕습니다.
다른 분야에서는 소매 및 전자상거래 플랫폼이 관세 계산 및 통관 서류 작성을 자동화하여 국경 간 마찰을 줄이고 있습니다. 한편, BFSI(은행, 금융, 보험) 기관들은 전 세계 자본 규제에 따른 제3자 위험 의무를 충족하기 위해 소프트웨어를 도입하고 있습니다. 정부 기관은 투명성과 접근성 요건을 충족하기 위해 전자 조달을 채택하고, IT 및 통신 기업은 지출 분석을 활용하여 SaaS 구독의 무질서한 확장을 억제하고 있습니다. 수직형 SaaS 공급업체는 건설 산업을 위한 하청업체 컴플라이언스 체크리스트와 같은 산업별 워크플로우를 구축할 수 있는 능력을 통해 수평형 제품군이 간과하고 있는 미개척 영역을 포착할 수 있는 위치에 있습니다. 그 결과, 조달 소프트웨어 시장은 기업 규모뿐만 아니라 산업 적합성의 깊이에 따라 시장이 확대되고 있습니다.
본 조달 소프트웨어 시장 보고서는 도입 형태(클라우드 및 On-Premise), 최종 사용자 산업(소매, 제조, 운송/물류, 의료, 은행, 금융서비스 및 보험(BFSI), IT/통신 등), 조직 규모(대기업 및 중소기업), 용도 모듈(e-소싱, 계약 관리, 지출 분석 등), 구성요소(소프트웨어 및 서비스), 지역별로 분류하여 분석하였습니다. 구성요소(소프트웨어 및 서비스), 그리고 지역별로 분류되어 있습니다. 시장 예측은 금액(USD)으로 표시됩니다.
지역별 분석
북미는 성숙한 ERP 생태계, 대통령령 14091에 따른 공급업체 다변화 의무화, 생성형 AI를 활용한 조달 코파일럿의 조기 도입으로 2025년 매출의 33.64%를 차지했습니다. 기계가 읽을 수 있는 계약 데이터를 요구하는 연방 정부의 투명성 요구사항이 민간 기관 전반에 걸쳐 플랫폼 보급을 촉진하는 한편, 캐나다 기업들은 디지털 접근성 규정을 준수하기 위한 전환을 진행하고 있습니다. 수출 지향적인 멕시코 제조업체들은 미국-멕시코-캐나다 협정(USMCA)의 원산지 증명 자동화를 위한 소프트웨어를 도입하여 무역 협정이 어떻게 디지털 조달을 촉진할 수 있는지를 강조하고 있습니다.
아시아태평양은 인도의 GeM과 일정 금액 이상의 조달에 대해 전자조달을 의무화하는 중국의 중앙집권적 공공조달 개혁과 같은 정부 포털에 힘입어 연평균 9.87%의 연평균 복합 성장률(CAGR)로 세계에서 가장 빠른 속도로 성장하고 있습니다. 일본은 API를 지원하는 정부 시스템에 많은 자금을 투자하고 있으며, 호주에서는 현대판 노예법이 적용되어 기업은 공급망에서 강제노동의 위험을 감사해야 합니다. 이를 통해 조달 플랫폼은 ESG 컴플라이언스의 최전선에 서게 되었습니다. 기업은 기존 인프라를 완전히 뛰어넘어 도입 첫날부터 현지화된 언어 팩, 세제 규칙, 결제 연동 기능을 제공하는 클라우드 네이티브 스위트를 채택하고 있습니다.
유럽은 북미의 성숙도와 아시아태평양의 성장 속도의 균형을 맞추고 있습니다. 유럽연합(EU)이 도입 예정인 eForms 의무화로 인해 계약 공고가 표준화되어 국경을 초월한 입찰 비용이 절감되고, 스키마 지원이 내장된 플랫폼이 우대받게 됩니다. 그린딜은 전과정에 걸친 탄소 회계를 요구하고 있으며, 소프트웨어는 배출량 데이터를 수집하고 입찰 평가 시 '생산 시작부터 출하 전(cradle-to-gate)'의 탄소 발자국을 제시해야 합니다. 독일공급망 실사법(Supply Chain Due Diligence Act)은 인권 감사 대상을 1차 공급업체까지 확대하고 있으며, EU 전역에서 유사한 법안이 논의되고 있어 컴플라이언스 주도의 도입에 힘을 실어주고 있습니다. 남미와 중동 시장은 여전히 개발 중이지만, 브라질과 사우디아라비아가 국가 전자 조달 포털을 구축함에 따라 추진력을 얻고 있습니다. 한편, 아프리카의 많은 지역에서는 여전히 통신 환경의 격차에 직면하여 광범위한 도입을 지연시키고 있습니다.
기타 특전:
- 엑셀 형식 시장 예측(ME) 시트
- 3개월간 애널리스트 지원
자주 묻는 질문
목차
제1장 서론
제2장 조사 방법
제3장 주요 요약
제4장 시장 구도
제5장 시장 규모와 성장 예측
제6장 경쟁 구도
제7장 시장 기회와 향후 전망
JHS 26.06.02The procurement software market size is projected to expand from USD 9.81 billion in 2025 and USD 10.74 billion in 2026 to USD 17.11 billion by 2031, registering a CAGR of 9.76% between 2026 to 2031.

Demand pivots around autonomous workflows that combine cloud-native architectures, generative-AI copilots, and tokenized cross-border payment rails, each lowering cost-to-serve while accelerating decision cycles. Cloud deployment dominates because elastic SaaS platforms slash data-center overhead, give real-time spend visibility, and update features for every tenant in near-real time. End-user uptake broadens as healthcare group purchasing organizations link sourcing decisions to value-based reimbursement, while SMEs gain entry through freemium tiers and embedded finance that convert capital expense into operating expense. Regionally, North American maturity anchors current revenue, yet Asia Pacific outpaces on growth as public e-procurement mandates and leapfrog cloud adoption converge.
Global Procurement Software Market Trends and Insights
Automating End-to-End Procurement Workflows
Organizations collapse requisition, approval, supplier discovery, contracting, and invoicing into a single platform that removes manual handoffs and prunes cycle time by up to half. Robotic process automation now drafts the bulk of purchase orders, reallocating human effort toward supplier relationship management. The resulting operating-expense reduction approaches 20% in industries exposed to volatile input prices, giving early adopters headroom to negotiate volume discounts that shield margins during commodity swings. Real-time dashboards redirect budgets within hours when disruptions hit, a capability that proved decisive during the 2025 semiconductor shortage. Firms that achieve this level of automation also report materially faster supplier onboarding, strengthening resiliency against single-source risk.
Seamless ERP and e-Procurement Integration
Bidirectional data flow between core ERP systems and procurement suites eliminates duplicate master records, curbing invoice discrepancies and shortening monthly close cycles. Pre-built adapters from leading vendors now synchronize contract terms, chart-of-accounts codes, and tax data without custom code, shrinking integration risk for multisuite enterprises. Middleware further federates data for conglomerates running multiple ERP instances, enabling unified spend analytics that surface maverick spend and unlock volume-discount leverage. Firms completing clean integrations often cite double-digit productivity gains across procurement staff because requisitioners transact from within the familiar ERP interface. This integration stickiness, in turn, raises switching costs and underpins vendor renewal rates.
Legacy-System Integration Complexity
Enterprises with aging, highly customized ERP codebases require months of mapping, testing, and remediation before procurement suites can go live. Custom extensions in legacy SAP or Oracle environments create brittle dependencies that break during upgrades, inflating budgets and delaying ROI. Data-quality problems such as duplicate supplier records further hamper synchronization, often forcing businesses to postpone platform rollouts until parallel ERP modernization concludes. Vendors now offer pre-certified connectors that shift part of the integration risk onto themselves, yet highly tailored deployments still overrun initial schedules. These hurdles make integration complexity the single most cited reason for stalled digital-procurement programs.
Other drivers and restraints analyzed in the detailed report include:
- Migration to Cloud-Native Platforms
- Generative AI Copilots Accelerating Autonomous Sourcing
- Data-Security and Regulatory Compliance Concerns
For complete list of drivers and restraints, kindly check the Table Of Contents.
Segment Analysis
Cloud deployment captured 67.92% of the procurement software market share in 2025, reflecting enterprise preference for elastic capacity that absorbs traffic spikes without capital expense. The segment's 9.81% CAGR underscores how multi-tenant SaaS platforms spread AI model-training costs across thousands of customers, making autonomous invoice matching and predictive risk scoring financially viable for mid-size firms. On-premise installations persist in defense and banking, where data-sovereignty rules limit external hosting, but hybrid architectures increasingly bridge local transaction processing with centralized analytics. Edge computing also gains favor among retailers operating in connectivity-challenged regions, lowering latency and ensuring continuous transaction flow during network outages.
The procurement software market benefits when cloud vendors roll updates in hours rather than quarters, enabling rapid response to regulatory changes such as electronic-invoice mandates or carbon-reporting rules. Conversely, on-premise buyers face six-to-twelve-month upgrade cycles that delay access to new functionality and inflate total cost of ownership. Even regulated entities are piloting shielded SaaS models that encrypt sensitive fields yet retain multi-tenant economics, signaling a gradual erosion of the long-standing on-premise stronghold. Taken together, these trends reinforce cloud's leadership position for the foreseeable horizon.
Manufacturing led 2025 revenue with 21.63% share, underpinned by complex bill-of-materials management and just-in-time inventory strategies that reward tight supplier coordination. Yet healthcare is the fastest riser, tracking a 9.79% CAGR as hospitals tie procurement savings to value-based reimbursement metrics, making every percentage point of supply cost a bottom-line imperative. Procedure-level integration with electronic health records allows clinicians to benchmark implant utilization and negotiate evidence-based pricing, cutting orthopedic spend by double digits. Group-purchasing organizations amplify buying power and help hospitals adjudicate supplier performance on infection-control or readmission measures.
Elsewhere, retail and e-commerce platforms automate tariff calculations and customs documentation to mitigate border friction, while BFSI institutions deploy software to meet third-party risk obligations under global capital rules. Government agencies adopt e-procurement to meet transparency and accessibility mandates, and IT-telecom firms use spend analytics to tame SaaS subscription sprawl. The ability to configure sector-specific workflows-such as subcontractor compliance checklists for construction-positions vertical SaaS vendors to seize whitespace overlooked by horizontal suites. Consequently, the procurement software market broadens not only by enterprise size but also by depth of industry fit.
The Procurement Software Market Report is Segmented by Deployment (Cloud and On-Premise), End-User Industry (Retail, Manufacturing, Transportation and Logistics, Healthcare, BFSI, IT and Telecom, and More), Organization Size (Large Enterprises and SMEs), Application Module (e-Sourcing, Contract Management, Spend Analysis, and More), Component (Software and Services), and Geography. The Market Forecasts are Provided in Value (USD).
Geography Analysis
North America generated 33.64% of 2025 revenue, thanks to mature ERP ecosystems, supplier-diversity mandates under Executive Order 14091, and early adoption of generative-AI-enabled procurement copilots. Federal transparency requirements that demand machine-readable contract data drive platform penetration across civilian agencies, while Canadian entities migrate to comply with digital-accessibility rules. Mexico's export-focused manufacturers embed software to automate United States-Mexico-Canada Agreement origin certifications, underscoring how trade pacts can catalyze digital procurement.
Asia Pacific advances at a 9.87% CAGR, the fastest worldwide, propelled by government portals such as India's GeM and China's centralized public-procurement reforms that oblige electronic sourcing above specified thresholds. Japan allocates substantial funds to API-ready government systems, and Australia applies modern slavery legislation that forces businesses to audit supply chains for forced-labor risk, bringing procurement platforms to the front line of ESG compliance. Companies leapfrog legacy infrastructure entirely, opting for cloud-native suites that offer localized language packs, tax rules, and payment integrations from day one.
Europe balances North American maturity with Asia Pacific's growth velocity. The European Union's forthcoming eForms mandates standardize contract notices, cutting cross-border tender costs and favoring platforms with built-in schema support. Green-deal initiatives require lifecycle carbon accounting, compelling software to ingest emissions data and present cradle-to-gate footprints during bid evaluation. Germany's supply-chain due-diligence act extends human-rights audits to first-tier suppliers, and similar legislation is debated across the bloc, reinforcing compliance-driven adoption. South America and Middle East markets remain nascent but gather momentum as Brazil and Saudi Arabia roll out national e-procurement portals, while much of Africa still contends with connectivity gaps that delay widescale deployment.
- SAP SE
- Coupa Software Incorporated
- Oracle Corporation
- Microsoft Corporation
- Jaggaer, LLC
- Infor Inc. (GT Nexus)
- Ivalua Inc.
- GEP Worldwide (GEP Solutions Private Ltd.)
- Basware Oyj
- Proactis Holdings Limited
- Zycus Incorporated
- Epicor Software Corporation
- Workday Inc.
- Tradeshift Holdings Inc.
- SynerTrade (Econocom Digital Solutions GmbH)
- Corcentric LLC (Determine)
- Rosslyn Data Technologies PLC
- Proxima Group Ltd.
- Scout RFP LLC (Workday)
- Mercateo AG
- Prospend Pty Ltd.
Additional Benefits:
- The market estimate (ME) sheet in Excel format
- 3 months of analyst support
TABLE OF CONTENTS
1 INTRODUCTION
- 1.1 Study Assumptions and Market Definition
- 1.2 Scope of the Study
2 RESEARCH METHODOLOGY
3 EXECUTIVE SUMMARY
4 MARKET LANDSCAPE
- 4.1 Market Overview
- 4.2 Market Drivers
- 4.2.1 Automating End-to-End Procurement Workflows
- 4.2.2 Seamless ERP and e-Procurement Integration
- 4.2.3 Migration to Cloud-Native Platforms
- 4.2.4 Generative AI Copilots Accelerating Autonomous Sourcing
- 4.2.5 Tokenized B2B Payment Rails Lowering Cross-Border Costs
- 4.2.6 Green Public Procurement Linked to Carbon Accounting APIs
- 4.3 Market Restraints
- 4.3.1 Legacy-System Integration Complexity
- 4.3.2 Data-Security and Regulatory Compliance Concerns
- 4.3.3 Algorithmic Bias Risks in AI Spend Analytics
- 4.3.4 Disruptive FinTech Entrants Eroding SaaS Price Leverage
- 4.4 Value Chain Analysis
- 4.5 Regulatory Landscape
- 4.6 Porter's Five Forces Analysis
- 4.6.1 Bargaining Power of Suppliers
- 4.6.2 Bargaining Power of Buyers
- 4.6.3 Threat of New Entrants
- 4.6.4 Threat of Substitutes
- 4.6.5 Competitive Rivalry
- 4.7 Impact of Macroeconomic Factors on the Market
5 MARKET SIZE AND GROWTH FORECASTS (VALUE)
- 5.1 By Deployment
- 5.1.1 Cloud
- 5.1.2 On-Premise
- 5.2 By End-User Industry
- 5.2.1 Retail
- 5.2.2 Manufacturing
- 5.2.3 Transportation and Logistics
- 5.2.4 Healthcare
- 5.2.5 BFSI
- 5.2.6 IT and Telecom
- 5.2.7 Government and Public Sector
- 5.2.8 Other End-User Industries
- 5.3 By Organization Size
- 5.3.1 Large Enterprises
- 5.3.2 Small and Medium Enterprises (SMEs)
- 5.4 By Application Module
- 5.4.1 e-Sourcing
- 5.4.2 Contract Management
- 5.4.3 Spend Analysis and Analytics
- 5.4.4 Procure-to-Pay
- 5.4.5 Supplier Relationship Management
- 5.4.6 Catalog Management
- 5.5 By Component
- 5.5.1 Software
- 5.5.2 Services
- 5.6 By Geography
- 5.6.1 North America
- 5.6.1.1 United States
- 5.6.1.2 Canada
- 5.6.1.3 Mexico
- 5.6.2 South America
- 5.6.2.1 Brazil
- 5.6.2.2 Argentina
- 5.6.2.3 Rest of South America
- 5.6.3 Europe
- 5.6.3.1 Germany
- 5.6.3.2 United Kingdom
- 5.6.3.3 France
- 5.6.3.4 Italy
- 5.6.3.5 Spain
- 5.6.3.6 Rest of Europe
- 5.6.4 Asia-Pacific
- 5.6.4.1 China
- 5.6.4.2 Japan
- 5.6.4.3 South Korea
- 5.6.4.4 India
- 5.6.4.5 Australia
- 5.6.4.6 Rest of Asia-Pacific
- 5.6.5 Middle East
- 5.6.5.1 Saudi Arabia
- 5.6.5.2 United Arab Emirates
- 5.6.5.3 Rest of Middle East
- 5.6.6 Africa
- 5.6.6.1 South Africa
- 5.6.6.2 Egypt
- 5.6.6.3 Rest of Africa
- 5.6.1 North America
6 COMPETITIVE LANDSCAPE
- 6.1 Market Concentration
- 6.2 Strategic Moves
- 6.3 Market Share Analysis
- 6.4 Company Profiles (includes Global Level Overview, Market Level Overview, Core Segments, Financials as available, Strategic Information, Market Rank/Share, Products and Services, Recent Developments)
- 6.4.1 SAP SE
- 6.4.2 Coupa Software Incorporated
- 6.4.3 Oracle Corporation
- 6.4.4 Microsoft Corporation
- 6.4.5 Jaggaer, LLC
- 6.4.6 Infor Inc. (GT Nexus)
- 6.4.7 Ivalua Inc.
- 6.4.8 GEP Worldwide (GEP Solutions Private Ltd.)
- 6.4.9 Basware Oyj
- 6.4.10 Proactis Holdings Limited
- 6.4.11 Zycus Incorporated
- 6.4.12 Epicor Software Corporation
- 6.4.13 Workday Inc.
- 6.4.14 Tradeshift Holdings Inc.
- 6.4.15 SynerTrade (Econocom Digital Solutions GmbH)
- 6.4.16 Corcentric LLC (Determine)
- 6.4.17 Rosslyn Data Technologies PLC
- 6.4.18 Proxima Group Ltd.
- 6.4.19 Scout RFP LLC (Workday)
- 6.4.20 Mercateo AG
- 6.4.21 Prospend Pty Ltd.
7 MARKET OPPORTUNITIES AND FUTURE OUTLOOK
- 7.1 White-space and Unmet-Need Assessment
