
|
시장보고서
상품코드
2044232
유럽의 플렉서블 오피스 시장 : 점유율 분석, 업계 동향과 통계, 성장 예측(2026-2031년)Europe Flexible Office - Market Share Analysis, Industry Trends & Statistics, Growth Forecasts (2026 - 2031) |
||||||
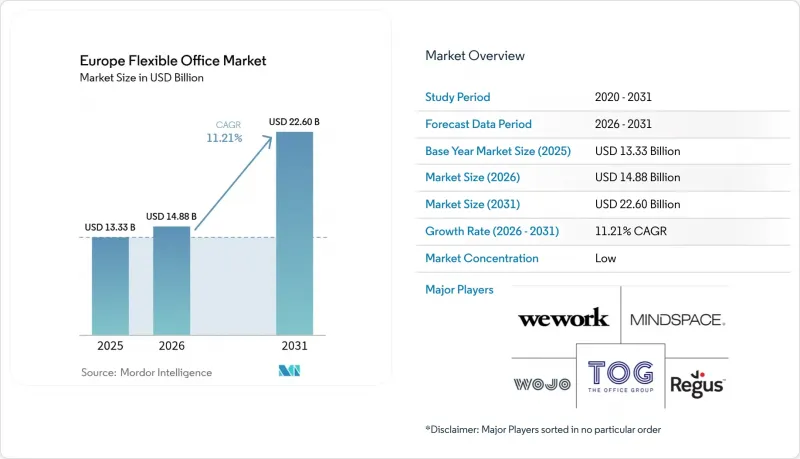
유럽의 플렉서블 오피스 시장 규모는 2025년에 133억 3,000만 달러, 2026년에 148억 8,000만 달러되어, 2031년까지 226억 달러에 이를 것으로 예측되며, 2026년부터 2031년까지 CAGR 11.21%로 성장할 전망입니다.
기준 연도의 재평가로 인해 기존에 추적되지 않았던 서비스 사무실 재고와 기업 본사 내에 통합된 플렉스데스크가 새로이 계상됨에 따라 2025년부터 2026년까지 급격한 변화가 발생하여 유럽의 보고기준이 북미의 IFRS 16 리스회계기준과 일치하게 되었습니다. 되었습니다. 주 3-4일 출근을 의무화하는 하이브리드 근무 정책과 ESG 인증 A등급 건물에 대한 수요 증가가 맞물리면서 플렉스 공간을 일시적인 증축 공간이 아닌 포트폴리오의 필수적인 구성 요소로 인식하는 테넌트에게 강력한 기반이 형성되었습니다. AI를 활용한 가동률 분석과 전용 5G 연결을 통해 워크스테이션당 수익이 향상되고, 독립 사업자의 진입장벽이 낮아지고 있습니다. 한편, 지속가능성 연동형 대출을 통해 리노베이션 프로젝트에 자본이 유입되고 있으며, 이로 인해 양질공급이 확대되어 프리미엄 자산의 공실률이 구조적으로 낮은 수준으로 유지되고 있습니다.
유럽 플렉서블 오피스 시장 동향 및 인사이트
A등급 및 ESG 준수 유연한 사무실로 '품질에 대한 도피'로의 '탈출'
테넌트들은 검증 가능한 환경 성능을 제공하는 건물로 이동하고 있으며, 2025년에는 인증된 공간의 임대료 프리미엄이 세컨더리 부동산에 비해 15-20%까지 확대될 것으로 예측됩니다. EU의 기업 지속가능성 보고 지침(CSRD)에 따라 임대 부동산의 Scope 3 배출량 공개가 의무화됨에 따라, 인증을 받지 않은 공간은 기업의 평판을 해칠 수 있는 위험이 있습니다. IWG, The Office Group과 같은 운영사들은 상세한 탄소 강도 지표를 공개하고, 포트폴리오 전체에서 넷제로를 달성하겠다는 약속을 하고 있습니다. 반면, 오너들은 가닥자산의 리스크를 줄일 수 있는 플렉스 브랜드와의 수익배분형 파트너십을 선호하고 있습니다. 이러한 '품질에 대한 도피'로 인해 저등급 빌딩의 인센티브가 확대되고 있음에도 불구하고, 프라임급 플렉스 거점에서는 가격이 견조하게 유지되고 있습니다.
주 3-4일 출근 의무화, 하이브리드형 플렉스 스페이스 수요를 뒷받침하고 있습니다.
유럽의 주요 기업들은 일시적인 하이브리드 근무 체제를 영구적인 정책으로 전환했습니다. 보다폰은월8일 출근을 의무화하고, 유럽중앙은행은 하이브리드 근무 체제를 2027년까지 연장했으며, 마이크로소프트는 지역 직원들에게 주 3일 출근을 유지하도록 했습니다. 매일의 출근 상황은 여전히 예측하기 어렵기 때문에 기업들은 잉여 용량을 보장하는 다년 계약을 체결하여 리스크를 헤지하고 사업자에게 안정적인 가동률을 보장하고 있습니다. 스텔란티스의 2024년 풀타임 복귀 명령과 같은 정책 전환은 시장의 변동성을 강조하고 있으며, 정책 변화에 대한 보험으로서 플렉스 스페이스의 중요성을 강조하고 있습니다. IT 업계의 인력감축에도 불구하고 직원 1인당 책상 수는 증가하고 있으며, 이는 매출 성장을 뒷받침하고 있습니다. 이러한 구조적 변화가 경기순환에 따른 일시적 해고가 지속되는 상황에서도 유럽의 플렉서블 오피스 시장이 지속적으로 확대되고 있는 이유를 설명해줍니다.
높은 인테리어 및 설비 비용으로 사업자의 수익률 압박
2024년부터 2025년까지 건설 비용의 인플레이션율은 연간 8-12%에 달했고, 프리미엄 인테리어 비용은 평방미터당 870-1,305달러로 상승했습니다. EU 택소노미 준수가 요구되는 고급 공조 제어 시스템, LED 조명, 스마트 빌딩용 센서 등은 예산에 15-20% 정도 더 추가될 수 있습니다. 신규 거점이 손익분기점에 도달하기까지 18-24개월이 소요되는 경우가 많기 때문에 현금 유동성에 제약이 있는 운영 사업자는 현금 소진 기간이 길어질 수 있는 위험에 직면해 있습니다. 대량 구매 계약이나 사내 엔지니어링 부서가 없는 소규모 브랜드가 가장 큰 영향을 받아 기업용 계약에서 벗어나 수익성이 낮은 프리랜서용 틈새 시장으로 내몰리고 있습니다.
부문 분석
2025년, 코워킹 스페이스는 유럽 플렉서블 오피스 시장 매출의 51.22%를 차지하고, 이는 협업을 중시하는 프리랜서 및 크리에이티브 에이전시에 대한 매력을 입증합니다. 한편, 서비스형 오피스 및 이그제큐티브 스위트는 은행 및 컨설팅 기업들이 데이터 보안을 우선시하는 가운데 2031년까지 연평균 복합 성장률(CAGR) 12.1%로 성장하여 유럽 전체 플렉서블 오피스 시장 규모 확대를 상회할 것으로 예측됩니다. 서비스형 오피스 부문의 부상은 NIS2 준수에 대한 압박과 함께 전용 에어컨, 잠금 가능한 출입구, 전용 서버 랙을 갖춘 개인실 레이아웃은 30-40%의 가격 프리미엄을 수반한다(3). 사업자는 개인실과 공유 라운지를 결합한 하이브리드형 상품으로 이에 대응하고 있으며, 기밀성과 커뮤니티의 균형을 추구하고 있습니다.
'품질에 대한 도피' 트렌드가 지속되면서 서비스형 스위트에 대한 수요가 증가하고 있습니다. 예를 들어, IWG는 알리안츠 리얼 에스테이트와 2025년까지 파트너십을 맺고 독일, 프랑스, 스페인 전역에서 ESG 인증을 받은 25만 평방미터의 신규 공간을 사전 임대했습니다. 한편, 모듈식 인테리어 시스템을 통해 공사 기간을 8주로 단축하여 자본 주기를 단축하고 확장에 따른 리스크를 줄였습니다. 코워킹의 점유율은 여전히 크지만, 기업 임차인들이 프라이버시를 최우선으로 하는 형태를 선호하는 방향으로 유럽 플렉서블 오피스 시장 점유율 구성이 재편되고 있어 그 비율은 점차 감소하고 있습니다.
'유럽 플렉서블 오피스 시장 보고서'는 유형별(코워킹스페이스, 서비스형 오피스/이그제큐티브 오피스 등), 부문별(IT 및 ITES 등), 최종 사용자별(기업, 프리랜서, 스타트업 및 기타), 국가별(영국, 독일, 프랑스, 스페인, 이탈리아 및 기타 유럽) 등으로 분류되어 있습니다. 독일, 프랑스, 스페인, 이탈리아 및 기타 유럽)로 분류되어 있습니다. 이 보고서는 위의 모든 부문에 대해 시장 규모와 예측(금액 기준, 미화 기준)을 제공합니다.
기타 특전:
- 엑셀 형식 시장 예측(ME) 시트
- 3개월간 애널리스트 지원
자주 묻는 질문
목차
제1장 서론
제2장 조사 방법
제3장 주요 요약
제4장 시장 구도
제5장 시장 규모 및 성장 예측(금액 : 달러)
제6장 경쟁 구도
제7장 시장 기회와 향후 전망
JHS 26.06.11The Europe flexible office market size is projected to be USD 13.33 billion in 2025, USD 14.88 billion in 2026, and reach USD 22.60 billion by 2031, growing at a CAGR of 11.21% from 2026 to 2031.

Base-year revaluation, which now captures previously untracked serviced-office inventory as well as embedded flex desks inside corporate headquarters, produced the sharp 2025-2026 step-change, aligning European reporting with North American IFRS 16 lease-accounting standards. Hybrid work policies that require three to four days in the office each week, together with rising demand for Grade-A, ESG-certified buildings, have created a resilient baseline for occupiers that view flex space as an essential portfolio component rather than surge capacity. AI-enabled occupancy analytics and private 5G connectivity are lifting revenue per workstation and lowering entry barriers for independent operators. Meanwhile, sustainability-linked loans are channeling capital into retrofit projects, expanding high-quality supply and keeping vacancy for premium assets structurally tight.
Europe Flexible Office Market Trends and Insights
Flight-to-Quality Toward Grade-A, ESG-Compliant Flex Offices
Occupiers are trading up to buildings that deliver verifiable environmental performance, widening the rent premium for certified space to 15-20% over secondary stock in 2025. EU Corporate Sustainability Reporting Directive rules compel disclosure of Scope 3 emissions from leased real estate, making uncertified space a reputational liability. Operators such as IWG and The Office Group publish granular carbon-intensity metrics and have portfolio-wide net-zero commitments. In turn, landlords favor revenue-share partnerships with flex brands that help de-risk stranded assets. This quality flight anchors price resilience for prime flex hubs even while incentives proliferate in lower-grade buildings.
Mandatory 3-to-4-Day Office Policies Sustain Hybrid Flex-Space Demand
Europe's largest employers have converted temporary hybrid schedules into permanent policy. Vodafone requires eight office days per month, the European Central Bank has extended its hybrid framework through 2027, and Microsoft keeps a three-day rule for regional staff. Because daily attendance remains unpredictable, enterprises hedge by locking multi-year memberships that guarantee overflow capacity, ensuring stable occupancy for operators. Policy reversals such as Stellantis's 2024 full-time return order underscore volatility, reinforcing flex space as insurance against mandate changes. Even with tech head-count reductions, desk-per-employee ratios are rising, supporting revenue growth. This structural shift explains why the Europe flexible office market continues expanding despite cyclical layoffs.
High Fit-Out & M&E Costs Erode Operator Margins
Construction-cost inflation ran 8-12% annually in 2024-2025, lifting premium fit-out spend to USD 870-1,305 per m2. Advanced HVAC controls, LED lighting, and smart-building sensors demanded by EU Taxonomy compliance add another 15-20% to budgets. Because new sites often take 18-24 months to reach break-even, capital-constrained operators risk prolonged cash burn. Smaller brands lacking bulk-purchase agreements or in-house engineering are most exposed, pushing them toward lower-value freelancer niches and away from enterprise contracts.
Other drivers and restraints analyzed in the detailed report include:
- Corporate Decarbonization & EU Taxonomy Accelerate Retrofit Flex Hubs
- Green-Linked Loans Unlock Refinancing of Distressed Assets Into Flex Space
- Vacant Secondary Offices Undercut Flex Rents With Incentives
For complete list of drivers and restraints, kindly check the Table Of Contents.
Segment Analysis
Co-working spaces captured 51.22% of Europe flexible office market revenue in 2025, underscoring their appeal to freelancers and creative agencies that prize collaboration. Serviced offices and executive suites, however, are forecast to grow at a 12.1% CAGR to 2031, outpacing overall Europe flexible office market size expansion as banks and consulting firms prioritize data security. The serviced segment's rise mirrors NIS2 compliance pressure; enclosed layouts with dedicated HVAC, lockable access, and private server racks command 30-40% pricing premiums[3]. Operators respond with hybrid products that combine private suites and shared lounges, balancing confidentiality with community.
Continued flight-to-quality strengthens serviced-suite demand. IWG, for example, pre-leased 250,000 m2 of new ESG-certified space across Germany, France, and Spain under a 2025 alliance with Allianz Real Estate. Meanwhile, modular fit-out systems cut build times to eight weeks, reducing capital cycles and de-risking expansion. Co-working's share remains large but is edging lower as enterprise occupiers reshape the Europe flexible office market share mix in favor of privacy-first formats.
The Europe Flexible Office Market Report is Segmented by Type (Co-Working Spaces, Serviced Offices / Executive Suites, and More) by Sector (Information Technology (IT and ITES), and More), by End Use (Enterprises, Freelancers and Start Ups & Others), and by Country (UK, Germany, France, Spain, Italy and Rest of Europe). The Report Provides Market Size and Forecasts in Value (USD) for all the Above Segments.
List of Companies Covered in this Report:
- Regus Group Companies
- WeWork
- The Office Group
- Mindspace
- Wojo
- Knotel
- Talent Garden
- Huckletree
- Selina
- Bisley Flexible Offices
- Impact Hub
- Techspace
- Labs (LabTech)
- CBRE Hana (now - The Office Partners)
- Deskopolitan
- Spacesworks
- Utopicus (Banco Santander)
- Station F
- Ordnungs ApS
- Matrikel 1
Additional Benefits:
- The market estimate (ME) sheet in Excel format
- 3 months of analyst support
TABLE OF CONTENTS
1 Introduction
- 1.1 Study Assumptions & Market Definition
- 1.2 Scope of the Study
2 Research Methodology
3 Executive Summary
4 Market Landscape
- 4.1 Market Overview
- 4.2 Market Drivers
- 4.2.1 Flight-to-quality toward Grade-A, ESG-compliant flex offices
- 4.2.2 Mandatory 3-to-4-day office policies sustain hybrid flex-space demand
- 4.2.3 Corporate decarbonisation & EU Taxonomy accelerate retrofit flex hubs
- 4.2.4 Green-linked loans unlock refinancing of distressed assets into flex space
- 4.2.5 AI-driven occupancy analytics lift revenue per workstation
- 4.2.6 Private 5G neutral-host roll-out lowers IT barriers for satellite flex offices
- 4.3 Market Restraints
- 4.3.1 High fit-out & M&E costs erode operator margins
- 4.3.2 Vacant secondary offices under-cut flex rents with incentives
- 4.3.3 NIS2 and GDPR privacy scrutiny delays large-enterprise uptake of small brands
- 4.3.4 Cross-border VAT gaps inflate TCO for multi-country occupiers
- 4.4 Value / Supply-Chain Analysis
- 4.4.1 Overview
- 4.4.2 Real Estate Developers & Asset Owners - Key Insights
- 4.4.3 Workspace Design & Technology Consultants - Key Insights
- 4.4.4 Modular Furniture & Smart Office Solutions Providers - Key Insights
- 4.5 Government Regulations & Initiatives in the Industry
- 4.6 Technological Innovations in the Flexible Office Real Estate Market
- 4.7 Key Office Real-Estate Metrics (Supply, Rentals, Prices, Occupancy/Vacancy %)
- 4.8 Impact of Remote Working on Space Demand
- 4.9 Porter's Five Forces
- 4.9.1 Bargaining Power of Suppliers
- 4.9.2 Bargaining Power of Buyers
- 4.9.3 Threat of New Entrants
- 4.9.4 Threat of Substitutes
- 4.9.5 Intensity of Competitive Rivalry
5 Market Size & Growth Forecasts (Value USD)
- 5.1 By Type
- 5.1.1 Co-Working Space
- 5.1.2 Serviced Offices / Executive Suites
- 5.1.3 Others (Hybrid, Virtual Office)
- 5.2 By Sector
- 5.2.1 Information Technology (IT & ITES)
- 5.2.2 BFSI (Banking, Financial Services & Insurance)
- 5.2.3 Business Consulting & Professional Services
- 5.2.4 Other Services (Retail, Life-Sciences, Energy, Legal)
- 5.3 By End Use
- 5.3.1 Freelancers
- 5.3.2 Enterprises
- 5.3.3 Start-Ups & Others
- 5.4 By Country
- 5.4.1 Germany
- 5.4.2 France
- 5.4.3 UK
- 5.4.4 Spain
- 5.4.5 Italy
- 5.4.6 Rest of Europe
6 Competitive Landscape
- 6.1 Market Concentration
- 6.2 Strategic Moves
- 6.3 Company Profiles {(includes Global level Overview, Market level overview, Core Segments, Financials as available, Strategic Information, Market Rank/Share for key companies, Products & Services, and Recent Developments)}
- 6.3.1 Regus Group Companies
- 6.3.2 WeWork
- 6.3.3 The Office Group
- 6.3.4 Mindspace
- 6.3.5 Wojo
- 6.3.6 Knotel
- 6.3.7 Talent Garden
- 6.3.8 Huckletree
- 6.3.9 Selina
- 6.3.10 Bisley Flexible Offices
- 6.3.11 Impact Hub
- 6.3.12 Techspace
- 6.3.13 Labs (LabTech)
- 6.3.14 CBRE Hana (now - The Office Partners)
- 6.3.15 Deskopolitan
- 6.3.16 Spacesworks
- 6.3.17 Utopicus (Banco Santander)
- 6.3.18 Station F
- 6.3.19 Ordnungs ApS
- 6.3.20 Matrikel 1
7 Market Opportunities & Future Outlook
- 7.1 White-space & Unmet-need Assessment
