
|
시장보고서
상품코드
2044244
영국의 코워킹 오피스 스페이스 시장 : 점유율 분석, 산업 동향 및 통계, 성장 예측(2026-2031년)UK Co-Working Office Spaces - Market Share Analysis, Industry Trends & Statistics, Growth Forecasts (2026 - 2031) |
||||||
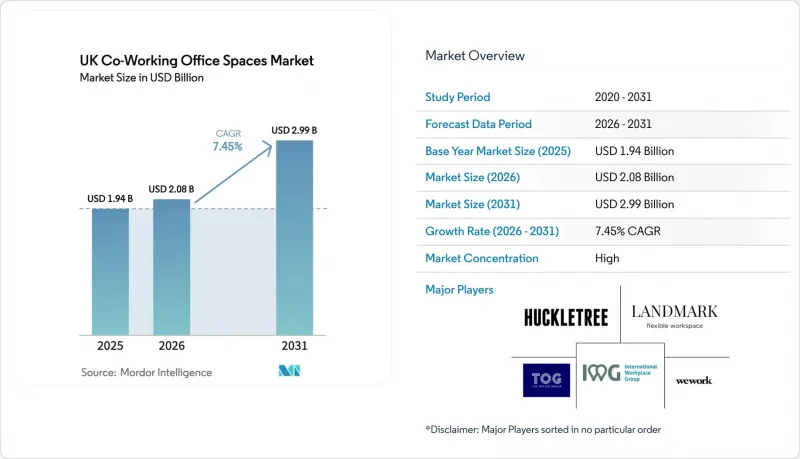
영국 코워킹 오피스 스페이스 시장 규모는 2025년에 19억 4,000만 달러로 평가되었고 2026년 20억 8,000만 달러에서 2031년까지 29억 9,000만 달러에 이를 것으로 예측되며, 예측 기간(2026-2031년) CAGR은 7.45%를 나타낼 전망입니다.

수요를 주도하는 것은 하이브리드 근무 정책을 공식적으로 도입하는 고용주가 증가함에 따라 소프트 워크스페이스가 일시적인 복리후생에서 부동산 전략의 핵심 요소로 변모하고 있다는 점입니다. 기업들은 본사의 거점 규모를 재검토하면서 지역별로 위성 사무실을 증설하고 있으며, 이러한 움직임은 영국 코워킹스페이스 시장의 잠재 고객층을 확대되고 있습니다. 동시에 ESG 요구사항으로 인해 부동산 소유주들은 BREEAM 및 LEED 인증을 획득한 건물의 개보수 및 개발을 강요받고 있으며, 이에 따라 운영 사업자들은 임대료 프리미엄이 15-20%에 달하는 인증 받은 건물을 우선적으로 선호하고 있습니다. 자금은 풍부하며, 패밀리 오피스, 인프라 펀드, REIT 등이 미활용 자금을 수익배분 계약에 할당하여 운영사업자를 막대한 인테리어 비용으로부터 보호하고 부동산 소유주에게 이익배분 기회를 제공하는 수익배분 계약에 할당하고 있습니다. 한편, 맨체스터와 벨파스트와 같은 지방 거점 도시들은 런던과의 격차를 좁혀가고 있으며, 이는 영국 코워킹스페이스 시장에서 활동하는 사업자들에게 포트폴리오의 위험을 분산시키는 지속적인 지리적 재균형의 조짐을 보여주고 있습니다.
영국 코워킹 오피스 스페이스 시장 동향 및 인사이트
하이브리드 작업의 보급으로 연질 공간 흡수율이 두 자릿수대 유지
현재 영국 고용주의 3분의 2가 직원들에게 일주일 중 적어도 일부 시간을 사무실에 출근할 것을 요구하고 있으며, 이는 2023년 이후 급격히 증가할 것으로 예측됩니다. 또한, 2025년 평균 오피스 가동률은 66%에 달했습니다. 이에 따라 기업들은 고정 임대료 임대에서 직원 수에 따라 확장 및 축소가 가능한 변동비형 데스크 형태로 전환하고 있습니다. 기술 대기업들은 실시간 데이터를 스케줄링 툴에 반영하는 재실감지 센서 생태계를 주류화하고 있으며, 이 시스템과 연동할 수 있는 운영 사업자가 기업들과 계약을 체결하고 있습니다. 이러한 보급이 영국 전체 코워킹 오피스 스페이스 시장에서의 안정적인 두 자릿수 흡수율을 뒷받침하고 있습니다.
기술, 크리에이티브, 전문 서비스업 입주기업들이 여러 도시로 진출 확대
게임, 영화, 디지털 미디어에 대한 정부 보조금(2024년 이후 총 4억 8,000만 달러)으로 인해 테넌트들은 맨체스터, 버밍엄, 리즈에 진출하고 있습니다. 이들 도시에서는 새로운 혁신지구에서 스튜디오 공간과 코워킹 플로어가 통합된 시설을 제공합니다. 전문 서비스 기업들도 비슷한 경향을 보이고 있으며, 인건비 절감을 위해 런던 외곽에 근거리 배송팀을 시험적으로 배치하고 있으며, 이로 인해 영국의 코워킹 스페이스 시장은 수도권을 넘어 확장되고 있습니다.
런던 중심부 서브마켓의 국지적 공급과잉으로 책상 임대료가 하락세
시티와 웨스트민스터 지역의 재고는 2022-2024년 사이에 100만 평방피트 이상 증가했지만, 가동률은 여전히 70% 미만입니다. 2024년 초월평균 책상 임대료가 994달러에 이르렀지만, 주변 지역 집주인들은 현재 공실을 채우기 위해 임대료 무료 기간과 인테리어 보조금을 제시하며 기존 사업자의 수익률을 압박하고 있습니다.
부문 분석
대규모 캠퍼스가 가장 빠른 확장 궤도를 그리며, 2026-2031년까지 연평균 복합 성장률(CAGR) 9.11%를 나타낼 것으로 예측됩니다. Bruntwood SciTech와 British Land와 같은 운영사는 20만 평방피트 규모의 CL2 대응 개발 프로젝트를 진행하고 있으며, 인테리어 공사 기간을 8주로 단축하여 바이오테크놀러지 및 AI를 활용한 신약개발 벤처기업을 유치하고 있습니다. 중형 허브는 여전히 영국 코워킹 스페이스 시장 점유율의 43%를 차지하며 가장 큰 점유율을 유지하고 있습니다. 이는 여러 도시에 5,000-2만 평방피트 규모의 거점을 보유한 기업들이 선호하고 있기 때문입니다. 5,000평방피트 이하의 소규모 근린형 소규모 거점은 런던 교외에서 활기를 띠고 있으며, 출퇴근의 부담을 최소화하면서 집 근처에서 일하고자 하는 수요를 충족시키고 있습니다. 이 세 가지 형태를 결합하면 사업자에게는 수익원이 다양해져 경기변동에 영향을 덜 받게 됩니다.
수요의 다양성으로 인해 운영자는 포트폴리오의 균형을 맞출 필요가 있습니다. 캠퍼스형은 주요 테넌트와의 다년 계약을 중심으로, 중형 허브는 위성 거점으로, 소규모 거점은 프리랜서 수요를 충족시키는 역할을 합니다. 특정 규모에 지나치게 편중된 그룹은 임차인의 요구사항이 변화함에 따라 가동률의 급격한 변화 위험에 직면하게 됩니다. 그 결과, 영국 코워킹스페이스 시장의 확장 계획은 구조적 변화에 대비하기 위해 각 규모별로 최소 한 개 이상의 자산을 통합하는 것이 일반화되었습니다.
기타 혜택
- 엑셀 형태 시장 예측(ME) 시트
- 3개월간 애널리스트 지원
자주 묻는 질문
목차
제1장 서론
제2장 조사 방법
제3장 주요 요약
제4장 시장 구도
제5장 시장 규모와 성장 예측
제6장 경쟁 구도
제7장 시장 기회와 향후 전망
JHS 26.06.02The UK co-working spaces market size was valued at USD 1.94 billion in 2025 and estimated to grow from USD 2.08 billion in 2026 to reach USD 2.99 billion by 2031, at a CAGR of 7.45% during the forecast period (2026-2031).
Demand is being propelled by employers formalizing hybrid policies, which has shifted flexible workspace from a cyclical perk to a core component of real-estate strategy. Enterprises are renegotiating headquarters footprints while adding regional satellites, a move that enlarges the addressable pool for the UK co-working spaces market. ESG mandates are simultaneously pushing landlords to retrofit or develop BREEAM- and LEED-certified buildings, encouraging operators to prioritize certified assets where rent premiums reach 15-20%. Capital is abundant: family offices, infrastructure funds, and REITs are allocating dry powder to revenue-share agreements that shield operators from heavy fit-out costs and give landlords upside participation. Meanwhile, regional hubs such as Manchester and Belfast are closing the gap with London, signaling a durable geographic rebalancing that diversifies portfolio risk for providers active in the UK co-working spaces market.
UK Co-Working Office Spaces Market Trends and Insights
Hybrid-Work Penetration Sustaining Double-Digit Flexible-Space Absorption
Two-thirds of UK employers now require employees in the office at least part of the week, up sharply since 2023, and average office utilization hit 66% in 2025. Companies are therefore shifting from fixed leases toward variable-cost desks that can expand or contract with headcount. Technology giants have mainstreamed occupancy-sensor ecosystems that feed real-time data into scheduling tools, and operators able to plug into this stack are winning enterprise contracts. This uptake underpins stable, double-digit absorption across the UK co-working spaces market.
Technology, Creative & Professional-Services Tenants Extending Multi-City Footprints
Government grants for gaming, film, and digital media-totaling USD 480 million since 2024-are driving tenants to Manchester, Birmingham, and Leeds, where new innovation districts bundle studio space with co-working floors. Professional-services firms mirror this pattern, piloting nearshore delivery teams outside London to control salary costs, which enlarges the UK co-working spaces market beyond the capital.
Localized Oversupply in Central-London Sub-Markets Depressing Desk Rates
Inventory in the City and Westminster grew by more than 1 million sq ft between 2022-2024, yet utilization lingers below 70%. Average monthly desk rates reached USD 994 in early 2024, but landlords in fringe zones now offer rent-free periods and fit-out subsidies to fill space, straining margins for incumbent operators.
Other drivers and restraints analyzed in the detailed report include:
- Regional-Hub Demand Spike Narrowing London Dependence
- Shift Toward BREEAM/LEED-Certified Spaces to Meet Occupiers' ESG Mandates
- Elevated Energy, FM and Labor Costs Squeezing Operator EBITDA Margins
For complete list of drivers and restraints, kindly check the Table Of Contents.
Segment Analysis
Large campuses accounted for the fastest expansion path, registering a 9.11% CAGR outlook as of 2026-2031. Operators like Bruntwood SciTech and British Land are building 200,000 sq ft CL2-ready developments that compress fit-out timelines to eight weeks, making them magnets for biotech and AI drug-discovery ventures. Medium-scale hubs still hold the greatest slice at 43% of the UK co-working spaces market share, favored by enterprises distributing 5,000-20,000 sq ft footprints across multiple cities. Small neighborhood locations under 5,000 sq ft flourish in suburban London, absorbing work-from-near-home demand with minimal commute friction. Collectively, the trio of formats gives providers a diversified revenue mix that insulates them from cycle swings.
Demand heterogeneity requires operators to balance portfolio mix. Campuses can anchor multi-year agreements with anchor tenants, while medium hubs function as satellite nodes, and small sites satisfy freelancers. Groups that over-index on one scale risk occupancy shocks as tenant requirements evolve. Consequently, expansion blueprints in the UK co-working spaces market now bundle at least one asset in each scale tier to hedge against structural shifts.
The United Kingdom Co-Working Office Spaces Market Report is Segmented by Size & Scale of Facility (Small, Medium, Large), by Sector (IT & ITES, BFSI, Business Consulting & Professional Services, Other Services), by End Use (Freelancers, Enterprises, Start-Ups & Others), and by Geography (England, Scotland, Wales, Northern Ireland). The Market Forecasts are Provided in Terms of Value (USD).
List of Companies Covered in this Report:
- International Workplace Group plc (IWG)
- WeWork
- The Office Group
- Landmark
- Huckletree
- Labs
- Work Well Offices
- The Brew
- Jactin House
- Icon Offices
- Wimbletech CIC
- The Skiff
- Soho Works
- Creative Works
- The Hoxton
- Mare Street Market
- Southbank Centre
- Bruntwood Works
- Knotel UK
- Clockwise Offices
Additional Benefits:
- The market estimate (ME) sheet in Excel format
- 3 months of analyst support
TABLE OF CONTENTS
1 Introduction
- 1.1 Study Assumptions & Market Definition
- 1.2 Scope of the Study
2 Research Methodology
3 Executive Summary
4 Market Landscape
- 4.1 Market Overview
- 4.2 Market Drivers
- 4.2.1 Hybrid-work penetration sustaining double-digit flexible-space absorption
- 4.2.2 Technology, creative & professional-services tenants extending multi-city footprints
- 4.2.3 Regional-hub demand spike (Manchester, Birmingham, Leeds) narrowing London dependence
- 4.2.4 Shift toward BREEAM/LEED-certified spaces to meet occupiers' ESG mandates
- 4.2.5 Family-office & infrastructure-fund capital earmarked for income-resilient co-working portfolios
- 4.2.6 Landlord-operator revenue-share models lowering entry barriers for new sites
- 4.3 Market Restraints
- 4.3.1 Localized oversupply in Central-London sub-markets depressing desk rates
- 4.3.2 Elevated energy, FM and labour costs squeezing operator EBITDA margins
- 4.3.3 SME demand volatility amid UK inflation/recession fears
- 4.3.4 Upcoming non-traditional competition (hotel-lobby passes, retail pop-ups) eroding pricing power
- 4.4 Value / Supply-Chain Analysis
- 4.4.1 Overview
- 4.4.2 Real-Estate Developers & Asset Owners - Key Quantitative and Qualitative Insights
- 4.4.3 Workspace Design & Technology Consultants - Key Quantitative and Qualitative Insights
- 4.4.4 Modular Furniture & Smart-Office Solution Providers - Key Quantitative and Qualitative Insights
- 4.5 Regulatory Landscape (Planning-use-class E, EPC-B 2030 mandate, business-rates reliefs)
- 4.6 Technological Outlook (prop-tech, IoT-enabled desk booking, AI space-optimisation)
- 4.7 Key Office-Real-Estate Metrics (Supply, Rentals, Prices, Occupancy/Vacancy %)
- 4.8 Impact of Remote Working on Space Demand
- 4.9 Porter's Five Forces
- 4.9.1 Bargaining Power of Suppliers
- 4.9.2 Bargaining Power of Buyers
- 4.9.3 Threat of New Entrants
- 4.9.4 Threat of Substitutes
- 4.9.5 Intensity of Competitive Rivalry
5 Market Size & Growth Forecasts (Value, USD)
- 5.1 By Size & Scale of Facility
- 5.1.1 Small
- 5.1.2 Medium
- 5.1.3 Large
- 5.2 By Sector
- 5.2.1 IT & ITES
- 5.2.2 BFSI
- 5.2.3 Business Consulting & Professional Services
- 5.2.4 Other Services (Retail, Lifesciences, Energy, Legal)
- 5.3 By End Use
- 5.3.1 Freelancers
- 5.3.2 Enterprises
- 5.3.3 Start-ups & Others
- 5.4 By Country
- 5.4.1 England
- 5.4.1.1 London
- 5.4.1.2 Rest of England
- 5.4.2 Scotland
- 5.4.3 Wales
- 5.4.4 Northern Ireland
- 5.4.1 England
6 Competitive Landscape
- 6.1 Market Concentration
- 6.2 Strategic Moves
- 6.3 Company Profiles {(includes Global-level Overview, Market-level overview, Core Segments, Financials as available, Strategic Information, Market Rank/Share, Products & Services, Recent Developments)}
- 6.3.1 International Workplace Group plc (IWG)
- 6.3.2 WeWork
- 6.3.3 The Office Group
- 6.3.4 Landmark
- 6.3.5 Huckletree
- 6.3.6 Labs
- 6.3.7 Work Well Offices
- 6.3.8 The Brew
- 6.3.9 Jactin House
- 6.3.10 Icon Offices
- 6.3.11 Wimbletech CIC
- 6.3.12 The Skiff
- 6.3.13 Soho Works
- 6.3.14 Creative Works
- 6.3.15 The Hoxton
- 6.3.16 Mare Street Market
- 6.3.17 Southbank Centre
- 6.3.18 Bruntwood Works
- 6.3.19 Knotel UK
- 6.3.20 Clockwise Offices
7 Market Opportunities & Future Outlook
- 7.1 White-Space & Unmet-Need Assessment
