
|
시장보고서
상품코드
2061497
다이렉트 드라이브 풍력 터빈 : 시장 점유율 분석, 업계 동향 및 통계, 성장 예측(2026-2031년)Direct Drive Wind Turbine - Market Share Analysis, Industry Trends & Statistics, Growth Forecasts (2026 - 2031) |
||||||
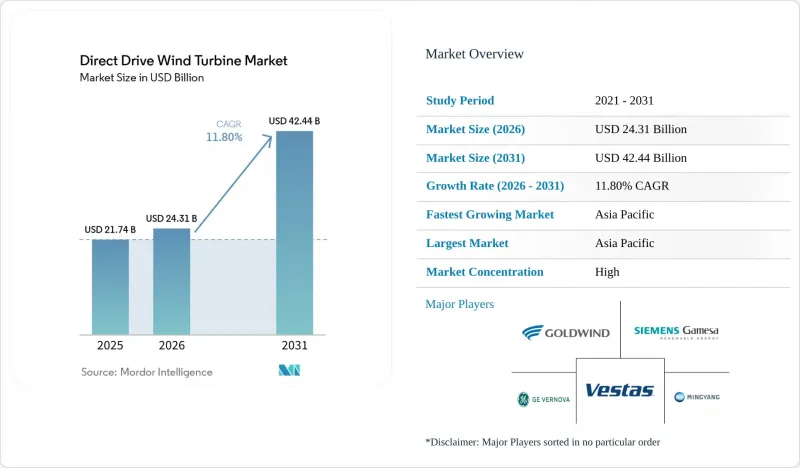
Mordor Intelligence에 의하면, 2026년 다이렉트 드라이브 풍력 터빈 시장 규모는 243억 1,000만 달러에 달할 것으로 추정됩니다. 2025년 217억 4,000만 달러에서 성장하여 2031년에는 424억 4,000만 달러에 이를 것으로 예측됩니다.
2026년부터 2031년까지의 연평균 성장률(CAGR)은 11.80%를 나타낼 것으로 전망됩니다.

본 보고서는 출력 등급(3MW 이하, 3MW-8MW, 8MW 이상), 발전기 기술(영구자석 동기기 및 자석 동기기), 설치 유형(육상, 고정식 해상, 부유식 해상), 용도(유틸리티 규모 풍력발전소 및 분산형), 지역(북미, 유럽, 아시아태평양, 남미, 중동 및 아프리카)별로 분류되어 있습니다.
세계의 다이렉트 드라이브 풍력 터빈 시장 동향 및 분석
4MW 이상의 다이렉트 드라이브 터빈에서 균등화 발전 원가(LCOE)의 하락
2024년 풍력 발전의 LCOE는 평균 0.033달러/kWh를 기록하여, 2010년 대비 70% 하락했습니다. 이는 기어박스를 배제한 설계 덕분에 주요 유지보수 비용 요인이 제거되었기 때문입니다. 기어박스의 원격 유지보수는 비용이 많이 들고 물류 측면에서도 복잡하기 때문에 해상 프로젝트가 가장 큰 혜택을 보고 있습니다. 나셀의 대형화로 인해 발전기의 질량이 증가하더라도 MW당 비용은 감소하며, 규모 확대가 단가를 낮추는 선순환이 강화되고 있습니다. 부유식 플랫폼의 경우, 구동계의 단순화를 통해 가혹한 해양 환경에서의 점검 횟수가 줄어들기 때문에 이러한 비용 절감 효과가 더욱 증폭됩니다. 전력 회사들이 4MW를 초과하는 터빈을 표준 사양으로 채택하기 시작함에 따라, 다이렉트 드라이브 풍력 터빈 시장은 구조적인 비용 우위를 확립해 가고 있습니다.
EU, 영국, 중국의 급속한 해상 풍력 발전 건설 목표
EU의 법규에 따르면 2030년까지 60GW, 2050년까지 300GW의 해상 풍력 발전 용량을 목표로 하고 있으며, 중국과 영국도 마찬가지로 야심 찬 로드맵을 제시하고 있습니다. 이 모든 것을 합치면 계획 중인 프로젝트의 규모는 400GW를 넘어섰으며, 각 OEM 업체들은 에너지 회수율을 극대화하기 위해 다이렉트 드라이브의 정격 출력을 15MW 이상으로 높일 것을 권고받고 있습니다. 부유식 해상 풍력 발전의 전망은 2024년 270MW에서 244GW 규모의 프로젝트 파이프라인으로 확대되었으며, 기어박스가 필요 없는 시스템에 적합한 심해 지역에서의 가능성이 넓어졌습니다. 명확한 정책 방향 덕분에 신공장과 수 GW 규모의 프레임워크 계약을 위한 자금 조달이 가능해졌습니다.
나셀의 무게 증가로 인해 육상 사이트의 물류 비용이 상승하고 있습니다.
10MW 다이렉트 드라이브 발전기의 무게는 약 300톤으로, 이로 인해 타워의 철강 비용과 운송비가 대폭 증가합니다. 타워의 구성 부품은 이미 터빈 비용의 26%를 차지하고 있습니다. 운송 경로의 제약으로 인해 2MW 터빈 1기당 최대 11대의 초대형 트럭 운송이 필요하며, 크레인 임대 비용이 1기당 10만 달러가 추가될 가능성이 있습니다. 각 OEM 업체들은 모듈식 발전기나 현장 조립을 추구하고 있지만, 이는 현장에서의 품질 위험을 높이는 결과를 초래합니다.
부문별 분석
3MW-8MW급 다이렉트 드라이브 풍력 터빈 시장 규모는 2025년에 정점을 찍으며, 매출의 43.25%를 차지했습니다. 이는 물류 관리가 비교적 용이한 육상에서의 보급이 주도한 결과입니다. 그러나 15MW를 초과하는 기종의 경우, 고정식 및 부유식 해상 프로젝트를 통해 높은 설비 가동률이 예상에 따라 연평균 성장률(CAGR) 21.96%라는 가장 급격한 성장이 전망되고 있습니다.
설치 메가와트당 자본 지출이 감소함에 따라 개발업체들은 더 대형 터빈을 발주하도록 유도되고 있지만, 한편으로는 인증 지연이 걸림돌이 되고 있습니다. 베스타스의 V236-15.0 MW 모델만으로도 7 GW의 확정 수주를 확보했으며, 이는 초대형 나셀에 대한 조기 신뢰를 보여주는 것입니다. 그러나 연안 조선소의 운송 능력과 크레인 용량은 생산량의 급속한 확대에 여전히 걸림돌이 되고 있습니다.
2025년에는 영구자석 동기식 유닛이 다이렉트 드라이브 풍력 터빈 시장의 87.90%를 차지했으며, 효율성과 낮은 유지보수 비용이 자석 비용에 대한 우려를 상쇄함에 따라 2031년까지 연평균 성장률(CAGR) 12.45%로 증가할 전망입니다. 로터 권선의 손실이 없기 때문에 더 높은 에너지 수율을 얻을 수 있으며, 지속적으로 발전하는 계통 연계 규정을 준수하기도 쉬워집니다. 전기 자석식 기계는 축소되는 틈새 시장을 차지하고 있으며, 주로 자석 공급의 안정성이 에너지 효율보다 우선시되는 곳에서 사용되고 있습니다.
재활용의 발전과 대체 재료의 등장으로 인해 PMSG의 비용 측면에서의 과제는 점차 완화될 것이며, 그 우위성은 더욱 장기화될 가능성이 있습니다. EESG 공급업체들은 설계의 유연성과 자석을 사용하지 않는 공급망을 강조하고 있지만, 유지보수의 복잡성과 낮은 출력이 보급을 저해하고 있습니다. 초전도 기술에 대한 연구는 장기적으로 양 진영에 큰 변화를 가져올 가능성이 있지만, 2030년 이전에 상업적으로 보급될 가능성은 낮아 보입니다.
지역별 분석
아시아태평양은 2025년에 전 세계 매출의 48.90%를 차지했으며, 2031년까지 연평균 성장률(CAGR) 12.62%를 나타낼 것으로 전망됩니다. 중국 내 대규모 해상 풍력 발전의 확대와 국내 공급망 통합이, 유럽 및 미국 국가들에 비해 20-30%의 비용 우위를 뒷받침하고 있습니다. 정책의 명확화가 공장 투자를 뒷받침하고 있으며, 골드윈드(Goldwind)의 브라질 신규 공장도 그 한 예로, 이를 통해 라틴아메리카 시장에서 가격 경쟁력을 확대되고 있습니다.
유럽은 2위를 차지하고 있지만, 부유식 해상 풍력 발전 및 전력계통 연계 분야에서의 기술 도입에 있어서는 주도적인 입지를 차지하고 있습니다. EU의 목표와 현지 조달 의무에 힘입어, V236-15.0 MW 터빈을 장착한 1GW 규모의인치 케이프(Inch Cape) 프로젝트 등 신규 발전 용량 발표가 잇따르고 있습니다. 폴란드, 영국, 덴마크의 OEM 제조업체들의 공장 확장은 수요가 지속되고 있음을 보여줍니다.
북미에서는 미국의 인플레이션 억제법(Inflation Reduction Act)에 힘입어 기세가 더욱 거세지고 있으며, 국내 부품 조달을 촉진하고 있습니다. GE Vernova의 1GW를 초과하는 리파워링 계약은 국내에서 제조된 다이렉트 드라이브 나셀의 조달 증가를 반영하고 있습니다. 한편, 중동의 정부계 펀드와 라틴아메리카의 개발업체들은 현지 생산 능력을 신속하게 확대하기 위해 중국의 OEM 업체와의 제휴에 주목하고 있으며, 이를 통해 향후 매출에 지리적 다각화가 더해지게 될 것입니다.
기타 혜택 :
- 엑셀 형식 시장 예측(ME) 시트
- 3개월간의 애널리스트 지원
자주 묻는 질문
목차
제1장 서론
제2장 조사 방법
제3장 주요 요약
제4장 시장 구도
제5장 시장 규모 및 성장 예측
제6장 경쟁 구도
제7장 시장 기회 및 향후 전망
KTH 26.06.22According to Mordor Intelligence, the direct drive wind turbine market size in 2026 is estimated at USD 24.31 billion, growing from 2025 value of USD 21.74 billion with 2031 projections showing USD 42.44 billion, growing at 11.80% CAGR over 2026-2031.
This report is Segmented by Power Rating (Up To 3 MW, 3 MW To 8 MW, and More), Generator Technology (Permanent-Magnet Synchronous and Electrically-Excited Synchronous), Installation Type (Onshore, Fixed-Bottom Offshore, and Floating Offshore), Application (Utility-Scale Wind Farms and Distributed), Geography (North America, Europe, Asia-Pacific, South America, and Middle East and Africa).
Global Direct Drive Wind Turbine Market Trends and Insights
Declining Levelized Cost of Electricity (LCOE) for >=4 MW Direct Drive Turbines
Wind LCOE averaged USD 0.033/kWh in 2024, a 70% fall since 2010, with gearbox-free designs removing major maintenance cost centers. Offshore projects gain the most because remote servicing of gearboxes is expensive and logistically complex. Larger nacelles lower cost per MW even as generator mass rises, reinforcing a virtuous cycle where scale reduces unit pricing. Floating platforms amplify these savings because simplified drivetrains cut service visits under harsh marine conditions. As utilities routinely specify turbines exceeding 4 MW, the direct-drive wind turbine market gains structural cost leadership.
Rapid Offshore Wind Build-Out Targets in EU, UK & China
EU legislation aims for 60 GW of offshore capacity by 2030 and 300 GW by 2050, while China and the UK have similarly ambitious roadmaps. Combined pipelines exceed 400 GW, incentivising OEMs to push direct drive ratings beyond 15 MW to maximise energy capture. Floating offshore prospects swell from 270 MW in 2024 to a 244 GW pipeline, expanding deep-water potential that favours gearbox-free systems. Clear policy visibility unlocks capital for new factories and multi-GW frame agreements.
Heavy Nacelle Mass Increases Logistics Costs for Onshore Sites
A 10 MW direct-drive generator weighs around 300 t, which significantly increases tower steel and transport costs; tower components already account for 26% of turbine costs. Route constraints mean up to 11 over-dimensioned truckloads per 2 MW turbine and crane hire that can add USD 100,000 per unit. OEMs pursue modular generators and onsite assembly, though these raise field-quality risks.
Other drivers and restraints analyzed in the detailed report include:
- Rising OEM Preference for Simplified Drivetrains (Gearbox-Free)
- Rare-Earth Magnet Recycling Breakthroughs Lowering NdFeB Input Cost
- Limited Global Rare-Earth Mining & Refining Capacity
For complete list of drivers and restraints, kindly check the Table Of Contents.
Segment Analysis
The direct drive wind turbine market size for the 3 MW-8 MW band was the highest in 2025, accounting for 43.25% of the revenue, driven by widespread onshore adoption where logistics remain manageable. Above 15 MW machines, however, promise the steepest upside with a 21.96% CAGR, leveraged by fixed-bottom and floating offshore projects that reward higher capacity factors.
Falling capital expenditure per installed megawatt motivates developers to order ever-larger turbines, while certification delays act as a gating factor. Vestas' V236-15.0 MW model alone secured 7 GW of firm commitments, illustrating early confidence in ultra-large nacelles. Yet transportation and crane capability in near-shore yards remain barriers for rapid volume scale-up.
Permanent-magnet synchronous units owned 87.90% of the direct drive wind turbine market in 2025, rising on a 12.45% CAGR through 2031 as efficiency and low maintenance trump magnet cost worries. Rotor winding losses are absent, enabling higher energy yield and easier compliance with evolving grid codes. Electrically excited machines occupy a shrinking niche, primarily used where magnet supply security outweighs energy efficiency.
Recycling advances and alternative compounds gradually lessen PMSG cost headwinds, potentially extending dominance. EESG vendors emphasise design flexibility and magnet-free supply chains, but added maintenance complexity and lower output limit uptake. Superconducting research could disrupt both camps long term, yet commercial traction appears unlikely before 2030.
Geography Analysis
Asia-Pacific recorded 48.90% of global revenue in 2025 and is projected to expand at a 12.62% CAGR through 2031. China's large-scale offshore roll-out and domestic supply chain integration underpin regional cost advantages of 20-30% over Western peers. Policy clarity supports factory investments, including Goldwind's new Brazilian plant that extends pricing leverage into Latin America.
Europe ranks second yet leads technology deployment in floating offshore and grid-forming applications. EU targets, along with local content mandates, drive new capacity announcements, such as the 1 GW Inch Cape project equipped with V236-15.0 MW turbines. OEM factory expansions in Poland, the UK, and Denmark highlight sustained demand.
North America gains momentum through the U.S. Inflation Reduction Act, spurring domestic component sourcing. GE Vernova's repower contracts, topping 1 GW, mirror the rising procurement of direct-drive nacelles made in-country. Meanwhile, Middle East sovereign funds and Latin American developers are turning to Chinese OEM partnerships to fast-track local capacity, thereby adding geographic diversity to future sales.
- Vestas Wind Systems A/S
- Goldwind Science & Technology Co. Ltd.
- Siemens Gamesa Renewable Energy S.A.
- GE Vernova (GE Renewable Energy)
- Envision Energy Ltd.
- Ming Yang Smart Energy Group Ltd.
- Enercon GmbH
- Hitachi Energy Ltd.
- Senvion India
- Lagerwey (Enercon DD platform)
- Toshiba Energy Systems & Solutions
- Hyundai Electric & Energy Systems
- Doosan Enerbility Co. Ltd.
- Shanghai Electric Wind Power Group
- Inox Wind Ltd.
- NSK Ltd. (main bearings)
- SKF AB (drivetrain bearings)
- Moog Inc. (pitch systems)
- Flender GmbH (Winergy converters)
Additional Benefits:
- The market estimate (ME) sheet in Excel format
- 3 months of analyst support
TABLE OF CONTENTS
1 Introduction
- 1.1 Study Assumptions & Market Definition
- 1.2 Scope of the Study
2 Research Methodology
3 Executive Summary
4 Market Landscape
- 4.1 Market Overview
- 4.2 Market Drivers
- 4.2.1 Declining Levelized Cost of Electricity (LCOE) for ?4 MW DD turbines
- 4.2.2 Rapid offshore wind build-out targets in EU, UK & China
- 4.2.3 Rising OEM preference for simplified drivetrains (gearbox-free)
- 4.2.4 Rare-earth magnet recycling breakthroughs lowering NdFeB input cost
- 4.2.5 Grid-forming inverter capability demand for high-penetration renewables
- 4.3 Market Restraints
- 4.3.1 Heavy nacelle mass increases logistics costs for onshore sites
- 4.3.2 Limited global rare-earth mining & refining capacity
- 4.3.3 Slow certification cycles for ≥15 MW next-gen DD prototypes
- 4.4 Supply-Chain Analysis
- 4.5 Regulatory Landscape
- 4.6 Technological Outlook
- 4.7 Porter's Five Forces
- 4.7.1 Bargaining Power of Suppliers
- 4.7.2 Bargaining Power of Buyers
- 4.7.3 Threat of New Entrants
- 4.7.4 Threat of Substitutes
- 4.7.5 Intensity of Competitive Rivalry
5 Market Size & Growth Forecasts
- 5.1 By Power Rating
- 5.1.1 Up to 3 MW
- 5.1.2 3 MW to 8 MW
- 5.1.3 8 MW to 15 MW
- 5.1.4 Above 15 MW
- 5.2 By Generator Technology
- 5.2.1 Permanent-Magnet Synchronous (PMSG)
- 5.2.2 Electrically-Excited Synchronous (EESG)
- 5.3 By Installation Type
- 5.3.1 Onshore
- 5.3.2 Fixed-bottom Offshore
- 5.3.3 Floating Offshore
- 5.4 By Application
- 5.4.1 Utility-Scale Wind Farms
- 5.4.2 Distributed (Below 5 MW)
- 5.5 By Geography
- 5.5.1 North America
- 5.5.1.1 United States
- 5.5.1.2 Canada
- 5.5.1.3 Mexico
- 5.5.2 Europe
- 5.5.2.1 Germany
- 5.5.2.2 United Kingdom
- 5.5.2.3 France
- 5.5.2.4 Spain
- 5.5.2.5 Sweden
- 5.5.2.6 Finland
- 5.5.2.7 Turkey
- 5.5.2.8 Rest of Europe
- 5.5.3 Asia Pacific
- 5.5.3.1 China
- 5.5.3.2 India
- 5.5.3.3 Japan
- 5.5.3.4 South Korea
- 5.5.3.5 Australia
- 5.5.3.6 Vietnam
- 5.5.3.7 Rest of Asia Pacific
- 5.5.4 South America
- 5.5.4.1 Brazil
- 5.5.4.2 Argentina
- 5.5.4.3 Chile
- 5.5.4.4 Rest of South America
- 5.5.5 Middle East and Africa
- 5.5.5.1 Saudi Arabia
- 5.5.5.2 Kenya
- 5.5.5.3 South Africa
- 5.5.5.4 Morocco
- 5.5.5.5 Rest of Middle East and Africa
- 5.5.1 North America
6 Competitive Landscape
- 6.1 Market Concentration
- 6.2 Strategic Moves (M&A, Partnerships, PPAs)
- 6.3 Market Share Analysis (Market Rank/Share for key companies)
- 6.4 Company Profiles (includes Global level Overview, Market level overview, Core Segments, Financials as available, Strategic Information, Products & Services, and Recent Developments)
- 6.4.1 Vestas Wind Systems A/S
- 6.4.2 Goldwind Science & Technology Co. Ltd.
- 6.4.3 Siemens Gamesa Renewable Energy S.A.
- 6.4.4 GE Vernova (GE Renewable Energy)
- 6.4.5 Envision Energy Ltd.
- 6.4.6 Ming Yang Smart Energy Group Ltd.
- 6.4.7 Enercon GmbH
- 6.4.8 Hitachi Energy Ltd.
- 6.4.9 Senvion India
- 6.4.10 Lagerwey (Enercon DD platform)
- 6.4.11 Toshiba Energy Systems & Solutions
- 6.4.12 Hyundai Electric & Energy Systems
- 6.4.13 Doosan Enerbility Co. Ltd.
- 6.4.14 Shanghai Electric Wind Power Group
- 6.4.15 Inox Wind Ltd.
- 6.4.16 NSK Ltd. (main bearings)
- 6.4.17 SKF AB (drivetrain bearings)
- 6.4.18 Moog Inc. (pitch systems)
- 6.4.19 Flender GmbH (Winergy converters)
7 Market Opportunities & Future Outlook
- 7.1 White-space & Unmet-Need Assessment
