
|
시장보고서
상품코드
2061529
미국의 전력 : 시장 점유율 분석, 업계 동향 및 통계, 성장 예측(2026-2031년)United States Power - Market Share Analysis, Industry Trends & Statistics, Growth Forecasts (2026 - 2031) |
||||||
Mordor Intelligence에 의하면, 미국의 전력 시장 규모(설치용량 기반)는 2025년 1,350기가와트로 평가되었습니다. 2026년에는 1,390기가와트로 확대되어 2026년부터 2031년에 걸쳐 CAGR은 2.73%를 나타내, 2031년까지 1,590기가와트에 이를 것으로 예측됩니다.
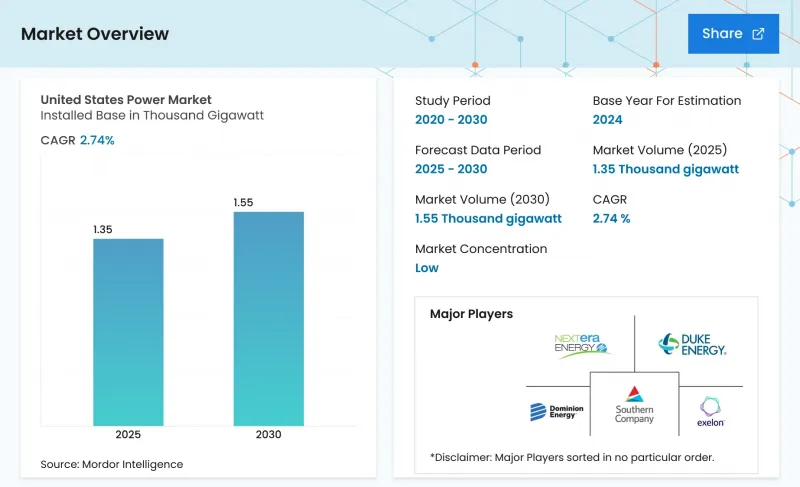
본 보고서는 발전원별(화력, 원자력, 재생에너지) 및 최종 사용자별(유틸리티, 상업 및 산업, 주택)로 분류되어 있습니다. 시장 규모 및 전망은 설비 용량(GW) 기준으로 제시되어 있습니다.
미국의 전력 시장 동향과 인사이트
IRA를 통한 재생에너지 확대
IRA에 따른 생산세액공제 및 투자세액공제의 10년 연장뿐만 아니라, 20퍼센트포인트의 국내 조달 보너스 덕분에 자본이 풍력 및 태양광 발전 프로젝트로 결정적으로 이동했습니다. 2030년까지 공급될 재생에너지 용량으로 발표된 총량은 550GW에 달하며, 이는 이미 IRA 도입 전 예측치의 2배를 웃도는 수치입니다. 자금 제공업체들이 수익의 확실성을 요구하는 가운데, 이미 체결된 전력 구매 계약은 2024년에 발표된 프로젝트의 80% 이상을 차지하고 있습니다. 미국의 모듈 제조업체인 퍼스트 솔라(First Solar)는 2026년까지 오하이오주의 생산 능력을 연간 14GW로 확대하여, 규제 요건을 충족하는 공급을 확보하고 있습니다. 그러나 2029년부터 2030년에 걸쳐 시행될 예정인 세액 공제의 단계적 축소에 따라, 건설 일정이 단축되고 설비 비용이 상승할 것으로 예측됩니다.
석탄 화력 발전소의 폐지가 공급 공백을 초래합니다.
2030년까지 폐지될 예정인 약 20GW 규모의 석탄 화력 발전 용량은 PJM, MISO, SPP에 집중되어 있습니다. 용량 입찰이 사상 최고가로 성사되는 가운데, 전력 회사들은 새로운 가스 터빈 발전소를 건설하는 대신 태양광, 풍력, 그리고 4시간 동안 전력을 저장할 수 있는 배터리를 결합하는 방침을 취하고 있습니다. 듀크 에너지만 해도, 대체 에너지가 전력망에 연계될 때까지 한계에 다다른 석탄 화력 발전 설비를 계속 가동하기 위해 2024년에 환경 대책 개보수 비용으로 4억 달러를 예산에 반영했습니다. 평균 5년에 달하는 계통 연계 대기 목록이 이러한 격차를 더욱 심화시키고 있어, 송전망 운영자는 긴급 수요 대응 프로그램을 가동할 수밖에 없는 상황입니다. 이러한 동향은 신뢰성 위험을 높이는 동시에, 독립 발전 사업자(머천트 제너레이터)에게 비즈니스 기회도 확대시키고 있습니다.
태양광 또는 변압기공급 병목 현상
고압 변압기의 리드타임은 팬데믹 이전의 12개월에서 2024년에는 30개월로 늘어났으며, 이로 인해 계통 연계 및 네트워크 업그레이드가 지연되고 있습니다. 연간 약 200대인 국내 생산 능력은 현재 수요의 절반밖에 충족하지 못하고 있습니다. ABB와 히타치 에너지는 미국 내 공장 확장을 발표했으나, 2027년까지는 완전한 생산 능력에 도달하지 못할 전망입니다. 섹션 201에 따른 태양광 관세 및 강제 노동에 의한 수입 금지 조치로 인해, 규정을 준수하는 모듈의 가격이 최대 20% 상승하여 개발업체의 수익을 압박하고 있습니다. 전력 회사는 현재 가격 조정 조항이 포함된 다년 공급 계약을 체결하고 있으며, 인플레이션 위험을 고객에게 전가하고 있습니다.
부문별 분석
2024년, 재생에너지의 설비 용량은 전체의 42.4%를 차지하며 연평균 성장률(CAGR) 7.8%로 확대되어, 미국의 전력 시장에서 화력 발전의 우위를 꾸준히 잠식하고 있습니다. 2024년 유틸리티 규모의 태양광 발전 신규 설치량은 32GW에 달했으며, 3년 연속으로 다른 모든 기술을 앞질렀습니다. 한편, 800MW 규모의 ‘Vineyard Wind 1’ 프로젝트는 상업용 해상 풍력 발전 시장 진출을 알리는 계기가 되었습니다. 2024년에는 석탄 화력 발전소의 폐지로 인해 8GW가 감축되었으며, 평균 설비 가동률은 40% 미만으로 떨어졌고, 출력 조정을 위한 유연한 가스 화력 자산에 대한 의존도가 높아졌습니다. 원자력 발전 용량은 95GW 전후로 안정적으로 유지되고 있으며, 2028년에 예정된 쓰리마일 아일랜드 원자력 발전소의 835MW 재가동은 폐쇄된 원자로가 재가동되는 첫 사례가 되어, 확실한 탄소 제로 전력 공급에서 원자력이 담당하는 역할을 부각시키고 있습니다. 파보사의 400MW ‘프로젝트 레드’와 같은 신흥 지열 프로젝트는 조절 가능한 재생에너지에 대한 투자자들의 관심이 높아지고 있음을 보여줍니다.
이러한 투자 열기는 IRA(인플레이션 억제법)에 따른 명확한 우대 조치가 적용되는 기술을 뒷받침하고 있으며, 미국의 전력 시장에서 태양광 발전 및 에너지 저장, 풍력 발전이 폐지되는 화석 연료 발전 설비의 기본 대체 수단으로서의 입지를 확고히 다지고 있습니다. 그렇긴 하지만, 개발업체들은 계통 연계 지연, 변압기 부족, 그리고 가격 변동 위험을 가중시키는 요금 변동 위험과 같은 과제에 직면해 있습니다. 메탄 배출료 도입이 임박함에 따라 천연가스 복합발전소 건설은 주춤하고 있지만, 기존 가스 발전 설비는 저녁 시간대 피크 시간대에 여전히 희소성에 따른 이익을 계속 창출하고 있습니다. 소형 모듈 원자로는 2024년에 원자력규제위원회로부터 설계 승인을 받았으나, 상업 운전은 2030년 이후가 될 것으로 전망되고 있습니다. 바이오매스나 조력 발전은 환경 규제 준수 비용이 수익을 상회하기 때문에 여전히 틈새 시장으로 남아 있습니다.
기타 혜택 :
- 엑셀 형식 시장 예측(ME) 시트
- 3개월간의 애널리스트 지원
자주 묻는 질문
목차
제1장 서론
제2장 조사 방법
제3장 주요 요약
제4장 시장 구도
제5장 시장 규모 및 성장 예측
제6장 경쟁 구도
제7장 시장 기회 및 향후 전망
KTH 26.06.22According to Mordor Intelligence, the united states power market size in terms of installed base is expected to grow from 1.35 Thousand gigawatt in 2025 to 1.39 Thousand gigawatt in 2026 and is forecast to reach 1.59 Thousand gigawatt by 2031 at 2.73% CAGR over 2026-2031.

This report is Segmented by Power Source (Thermal, Nuclear, and Renewables) and End-User (Utilities, Commercial and Industrial, and Residential). The Market Sizes and Forecasts are Provided in Terms of Installed Capacity (GW).
United States Power Market Trends and Insights
IRA-driven renewable build-out
The IRA's decade-long extension of production and investment tax credits, plus a 20-percentage-point domestic-content bonus, has shifted capital decisively toward wind and solar projects. Announcements totaling 550 GW of renewable capacity for delivery by 2030 already exceed pre-IRA forecasts twofold. Contracted offtake now covers more than 80% of projects announced in 2024 as financiers demand revenue certainty. U.S. module producer First Solar is expanding its Ohio manufacturing to 14 GW of annual output by 2026, ensuring a compliant supply. However, a looming 2029-2030 credit step-down is expected to compress construction schedules and bid up equipment costs.
Coal Retirements Create Capacity Gap
Roughly 20 GW of coal capacity scheduled to exit by 2030 is concentrated in PJM, MISO, and SPP. With capacity auctions clearing at record prices, utilities are pairing solar, wind, and 4-hour batteries rather than building new gas turbines. Duke Energy alone budgeted USD 400 million in 2024 for environmental retrofits to keep marginal coal units online until replacement resources interconnect. Interconnection backlogs averaging five years intensify the gap, forcing grid operators to activate emergency demand-response programs. These dynamics elevate both reliability risk and merchant-generator opportunity.
Solar or transformer supply bottlenecks
High-voltage transformer lead times lengthened to 30 months in 2024 versus 12 months pre-pandemic, delaying interconnections and network upgrades. Domestic production capacity of roughly 200 units annually meets only half of the current demand. ABB and Hitachi Energy announced U.S. factory expansions, but full output is unlikely before 2027. Section 201 solar tariffs and forced-labor import bans inflated compliant-module prices by up to 20%, compressing developer returns. Utilities now sign multi-year supply agreements with escalators, shifting inflation risk to customers.
Other drivers and restraints analyzed in the detailed report include:
- Electrification-led demand growth
- Grid Modernization & Resiliency Funding
- Transmission Siting & Permitting Delays
For complete list of drivers and restraints, kindly check the Table Of Contents.
Segment Analysis
Renewables captured 42.4% of installed capacity in 2024 and are advancing at a 7.8% CAGR, steadily eroding thermal's majority position in the United States power market. Utility-scale solar additions of 32 GW in 2024 outpaced every other technology for the third straight year, while the 800 MW Vineyard Wind 1 project heralded commercial offshore wind entry. Coal retirements removed 8 GW in 2024, pushing average fleet capacity factors below 40% and increasing reliance on flexible gas assets for ramping. Nuclear capacity remains steady near 95 GW; the planned 835 MW restart of Three Mile Island in 2028 marks the first reactor return from retirement and underscores nuclear's role in firm zero-carbon supply. Emerging geothermal projects such as Fervo's 400 MW Project Red illustrate growing investor appetite for dispatchable renewables.
Investment momentum favors technologies with clear IRA incentives, positioning solar-plus-storage and wind as the default replacements for retiring fossil units within the United States power market. Developers nonetheless face interconnection delays, transformer shortages, and tariff exposure that add price volatility. Natural-gas combined-cycle builds are slowing as potential methane fees loom, yet existing gas fleets continue to capture scarcity rents during evening peaks. Small modular reactors earned Nuclear Regulatory Commission design approval in 2024, but commercial operation remains a post-2030 prospect. Biomass and tidal remain niche as environmental compliance costs outweigh revenue streams.
List of Companies Covered in this Report:
- NextEra Energy Inc
- American Electric Power
- FirstEnergy Corp
- Constellation Energy
- Mitsubishi Power Americas
- Duke Energy Corp
- Berkshire Hathaway Energy
- Public Service Enterprise Group
- Pattern Energy Group
- Southern Company
- Vistra Corp
- AES Corporation
- Orsted A/S (US)
- ABB USA
- Exelon Corp
- Entergy Corp
- Eversource Energy
- General Electric Vernova
- Toshiba America Energy Systems
Additional Benefits:
- The market estimate (ME) sheet in Excel format
- 3 months of analyst support
TABLE OF CONTENTS
1 Introduction
- 1.1 Study Assumptions & Market Definition
- 1.2 Scope of the Study
2 Research Methodology
3 Executive Summary
4 Market Landscape
- 4.1 Market Overview
- 4.2 Market Drivers
- 4.2.1 IRA-driven renewable build-out
- 4.2.2 Coal retirements create capacity gap
- 4.2.3 Electrification-led demand growth
- 4.2.4 Grid modernization & resiliency funding
- 4.2.5 Hyperscale-data-center PPAs
- 4.2.6 Green-hydrogen electrolyzer demand
- 4.3 Market Restraints
- 4.3.1 Solar/transformer supply bottlenecks
- 4.3.2 Transmission siting & permitting delays
- 4.3.3 Curtailment risk in high-renewable zones
- 4.3.4 Extreme-weather insurance cost surge
- 4.4 Supply-Chain Analysis
- 4.5 Regulatory Landscape
- 4.6 Technological Outlook
- 4.7 Porter's Five Forces
- 4.7.1 Threat of New Entrants
- 4.7.2 Bargaining Power of Suppliers
- 4.7.3 Bargaining Power of Buyers
- 4.7.4 Threat of Substitutes
- 4.7.5 Competitive Rivalry
- 4.8 PESTLE Analysis
5 Market Size & Growth Forecasts
- 5.1 By Power Source
- 5.1.1 Thermal (Coal, Natural Gas, Oil and Diesel)
- 5.1.2 Nuclear
- 5.1.3 Renewables (Solar, Wind, Hydro, Geothermal, Biomass & Waste, Tidal)
- 5.2 By End User
- 5.2.1 Utilities
- 5.2.2 Commercial and Industrial
- 5.2.3 Residential
- 5.3 By T&D Voltage Level (Qualitative Analysis only)
- 5.3.1 High-Voltage Transmission (Above 230 kV)
- 5.3.2 Sub-Transmission (69 to 161 kV)
- 5.3.3 Medium-Voltage Distribution (13.2 to 34.5 kV)
- 5.3.4 Low-Voltage Distribution (Up to 1 kV)
6 Competitive Landscape
- 6.1 Market Concentration
- 6.2 Strategic Moves (M&A, Partnerships, PPAs)
- 6.3 Market Share Analysis (Market Rank/Share for key companies)
- 6.4 Company Profiles (includes Global level Overview, Market level overview, Core Segments, Financials as available, Strategic Information, Products & Services, and Recent Developments)
- 6.4.1 NextEra Energy Inc
- 6.4.2 American Electric Power
- 6.4.3 FirstEnergy Corp
- 6.4.4 Constellation Energy
- 6.4.5 Mitsubishi Power Americas
- 6.4.6 Duke Energy Corp
- 6.4.7 Berkshire Hathaway Energy
- 6.4.8 Public Service Enterprise Group
- 6.4.9 Pattern Energy Group
- 6.4.10 Southern Company
- 6.4.11 Vistra Corp
- 6.4.12 AES Corporation
- 6.4.13 Orsted A/S (US)
- 6.4.14 ABB USA
- 6.4.15 Exelon Corp
- 6.4.16 Entergy Corp
- 6.4.17 Eversource Energy
- 6.4.18 General Electric Vernova
- 6.4.19 Toshiba America Energy Systems
7 Market Opportunities & Future Outlook
- 7.1 White-space & Unmet-Need Assessment
