
|
시장보고서
상품코드
2061572
바이오시뮬레이션 : 시장 점유율 분석, 업계 동향 및 통계, 성장 예측(2026-2031년)Biosimulation - Market Share Analysis, Industry Trends & Statistics, Growth Forecasts (2026 - 2031) |
||||||
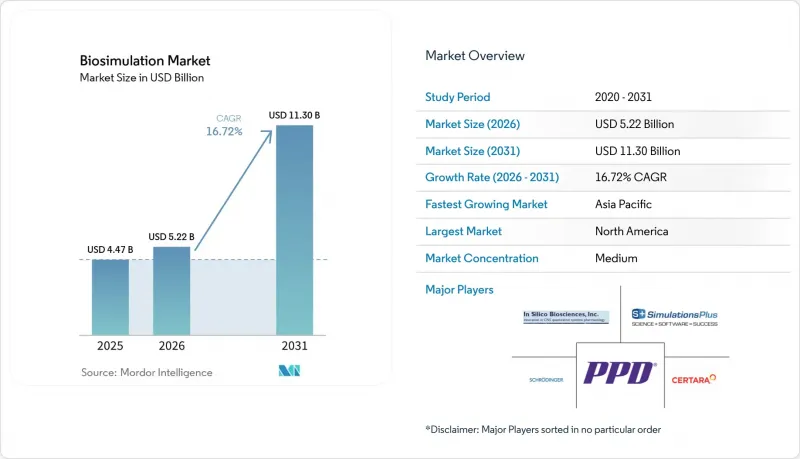
Mordor Intelligence에 의하면, 2026년 바이오시뮬레이션 시장 규모는 52억 2,000만 달러에 달할 것으로 추정됩니다. 2025년 44억 7,000만 달러에서 성장하여 2031년에는 113억 달러에 이를 것으로 예측됩니다.
2026년부터 2031년까지의 연평균 성장률(CAGR)은 16.72%를 나타낼 것으로 전망됩니다.
본 보고서에서는 업계를 제품별(소프트웨어, 서비스), 제공 모델별(구독형, 소유/On-Premise), 용도별(전임상 및 임상 단계의 의약품 개발 등), 최종 사용자별(제약·바이오기술 기업 등), 지역별(북미, 유럽, 아시아태평양, 중동 및 아프리카, 남미)로 분류하고 있습니다. 시장 전망은 금액(달러) 기준으로 제시되어 있습니다.
세계의 바이오시뮬레이션 시장 동향과 인사이트
헬스케어 분야의 IT 예산 증가
생명과학 분야의 CIO를 대상으로 한 조사에 따르면, 2024년에 과반수의 기업이 기술 예산을 증액했으며, 그중 4분의 1은 인공지능(AI) 프로젝트를 우선순위로 두고 있습니다. 예산 확대는 PBPK, QSP 및 AI 알고리즘을 통합한 바이오시뮬레이션 플랫폼에 대한 수요 증가로 이어질 것입니다. 화이자(Pfizer)와 노보노르디스크(Novo Nordisk)는 클라우드 네이티브 모델링에 대한 투자를 통해 달성한 구체적인 비용 절감 효과를 공개하며, 바이오시뮬레이션 시장 전반에 걸친 보다 광범위한 도입을 뒷받침하는 비즈니스 사례를 제시하고 있습니다. 지출 증가는 대규모 가상 트윈 연구와 전 세계에 흩어져 있는 팀 간의 실시간 협업을 가능하게 하는 클라우드 인프라 업그레이드도 가속화하고 있습니다. 이러한 추세는 중기적으로 바이오시뮬레이션 시장이 지속적인 두 자릿수 성장을 이룰 수 있도록 뒷받침하고 있습니다.
규제 당국의 바이오시뮬레이션 플랫폼 도입 확대
규제 측면에서의 움직임은 중요한 전환점에 도달했습니다. FDA는 QSP에 따른 신청 건수가 현재 1.4년마다 두 배로 증가하고 있음을 지적하며, 상설 MIDD(모델 기반 개발) 협력 회의 프로그램을 통해 정량적 모델에 관한 체계적인 조언을 제공합니다. 2024년에 최종 확정된 ICH M15 지침은 모델 정보에 기반한 의약품 개발에 대한 국제적인 기대를 조화시키고, 신청 기업의 불확실성을 줄여줍니다. EMA와 PMDA는 상세한 PBPK 지침을 발표했으며, 각 규제 당국은 단일클론 항체에 대해 동물 실험의 대안으로 시뮬레이션 데이터를 점점 더 많이 수용하고 있습니다. 이러한 공식적인 지지는 선순환을 만들어내고 있습니다. 신청이 성공할 때마다 신뢰도가 높아지면서, 더 많은 후원사들이 개발 계획에 바이오시뮬레이션을 도입하도록 장려하고 있습니다.
임상의 및 임상시험 팀의 인식 부족
많은 임상시험 책임의들은 여전히 정량적 모델링의 산출 결과에 익숙하지 않아, 이로 인해 프로토콜 설계나 의사결정에 가상 연구 결과를 완전히 반영하는 데 어려움을 겪고 있습니다. 교육 커리큘럼에는 고도의 약리통계학 모듈이 누락된 경우가 많으며, 실무 담당자들은 빡빡한 일정에 쫓기다 보니 기존 방식이 우선시되는 경향이 있습니다. 기업들은 사내 아카데미나 이러닝 모듈을 통해 대응하고 있지만, 그 도입 현황은 치료 분야나 지역에 따라 여전히 차이가 있습니다. 이러한 격차가 가장 큰 곳은 디지털 인프라가 미비하고, 현지 규제 당국이 ICH M15를 언급하기 시작한 지 얼마 되지 않은 신흥 시장입니다. 실용적인 노하우가 널리 보급되기 전까지는 일부 후원사들이 바이오시뮬레이션의 잠재력을 충분히 활용하지 못할 것입니다.
부문별 분석
2025년에는 소프트웨어 솔루션이 매출의 67.10%를 차지했습니다. 이는 시각화, 검증, 규제 당국에 대한 보고를 효율화하는 통합 모델링 환경이 선호되고 있음을 반영합니다. Certara의 ‘Phoenix’ 출시와 Dassault Systemes의 ‘BIOVIA’ 업그레이드는 화합물 스크리닝을 가속화하는 AI 모듈 통합 경쟁이 치열해지고 있음을 보여줍니다. 생물학적 시뮬레이션 시장에서는 PBPK 및 QSP 엔진을 직관적인 대시보드와 방대한 화합물 라이브러리와 결합한 업체들이 여전히 우위를 점하고 있습니다. 서비스 부문은 절대 규모로는 작지만, 스폰서들이 워크플로 맞춤화나 복잡한 결과 해석에 관한 컨설팅 전문 지식을 요구함에 따라 꾸준히 성장하고 있으며, 이는 바이오시뮬레이션 시장의 성장을 견인하고 있습니다.
이 서비스는 현재 틈새 시장이지만, 만성 질환 관리를 위해 실시간 바이오센서 데이터가 디지털 트윈에 직접 통합됨에 따라 2031년까지 연평균 성장률(CAGR) 18.05%를 나타낼 것으로 전망됩니다. 이러한 확장에 힘입어 바이오시뮬레이션 시장은 신약 개발의 범위를 넘어 임상 의사 결정 지원 분야로 확대되고 있습니다. 서비스 제공업체는 센서 스트림과 QSP 모델을 통합하는 복잡한 작업의 이점을 누리고 있습니다. 이 작업에는 도메인 지식과 데이터 엔지니어링 기술 모두 필요합니다. 플랫폼 소프트웨어와 종합적인 자문 서비스를 결합한 공급업체는 프로젝트 후반 단계에서 더 높은 시장 점유율을 확보할 수 있는 유리한 입장에 있습니다.
대형 제약사들이 고도의 사내 데이터센터를 운영하고 있기 때문에 On-Premise형 도입은 여전히 매출의 46.90%를 차지하고 있습니다. 그러나 기업들이 유연한 컴퓨팅과 설비 투자 축소를 중시함에 따라, 구독 서비스는 연평균 성장률(CAGR) 18.70%로 성장하고 있습니다. 바이오시뮬레이션 시장은 규제 대상 워크로드가 GMP(우수 제조 관리 기준) 지침을 준수하는 검증된 클라우드 환경으로 이전되는 생명과학 업계 전반의 주요 추세를 반영하고 있습니다. 알고리즘의 지속적인 업데이트와 내장된 규정 준수 기능은 전문 IT 인력을 보유하지 않은 중소규모의 후원 기업에게 매력적입니다.
보안과 데이터 주권은 여전히 일부 기업이 On-Premise 환경을 유지하는 이유로 남아 있으며, 특히 독자적인 단일클론 항체 서열이나 지역 개인정보 보호 규정의 적용을 받는 임상시험 데이터를 취급하는 경우 더욱 두드러집니다. 따라서 기밀성이 높은 워크로드는 방화벽 내부에 유지하고, 버스트 처리는 클라우드로 전송하는 하이브리드 모델이 정착되어 있습니다. 이에 반해, 플랫폼 제공업체는 환경 간에 원활하게 이동할 수 있는 컨테이너화된 배포를 제공하며, 어느 환경에서든 동일한 검증 문서를 보장합니다. 전자 기록 관리에 관한 규제 당국의 지침이 명확해짐에 따라, 주요 시험 모델에서의 클라우드 활용이 더욱 촉진될 것입니다.
지역별 분석
2025년에는 모델 기반 개발에 대한 FDA의 적극적인 태도와 현지에서 풍부한 벤처 자금의 지원에 힘입어, 북미가 매출 점유율의 44.10%를 차지하며 주도적인 위치를 차지했습니다. 이에 이어 유럽이 뒤를 잇고 있으며, EMA의 종합적인 PBPK 지침, 안전한 클라우드 도입을 촉진하는 강력한 데이터 개인정보 보호법, 그리고 소프트웨어 공급업체와 연구 병원 간의 견고한 산업 협력 등이 원동력이 되고 있습니다. 두 지역 모두 복잡한 생물학적 제제를 위해 QSP를 조기에 도입한 기업이 많이 있습니다.
아시아태평양은 규제 조화와 확대되는 바이오시밀러 파이프라인의 혜택을 받아 22.60%라는 가장 높은 연평균 성장률(CAGR)을 기록하고 있습니다. 일본의 PMDA는 2024년 초까지 35개의 바이오시밀러 제품을 승인했으며, 그중 일부는 임상 데이터 세트의 축소를 정당화하기 위해 모델링을 활용했습니다. 중국의 의약품 혁신에 관한 다년 계획은 전 세계의 플랫폼 제공업체들을 유치하고 있으며, 이는 지역 센터 설립으로 이어지고 있습니다. 한편, 인도의 신흥 바이오테크놀러지 허브는 비용 효율적인 모델 구축을 위한 역량을 강화하고 있습니다. 인건비가 저렴하고 데이터 사이언스자가 증가함에 따라, 현지 기업들은 전용 바이오시뮬레이션 센터를 운영할 수 있게 되어 지역의 자립성을 높이고 있습니다.
라틴아메리카와 중동 및 아프리카는 현재 시장 점유율이 낮지만, 다국적 기업들이 가상 설문조사 방식을 다양한 대상 집단으로 확대함에 따라 이에 대한 관심이 높아지고 있습니다. 기술 이전 프로그램이 현지 노하우를 육성하고 있으며, 클라우드 인프라의 확장이 진입 장벽을 낮추고 있습니다. 앞으로 실세계 데이터의 접근성이 확대됨에 따라, 이러한 서비스가 미치지 못하는 시장에서 바이오시뮬레이션의 잠재력이 최대한 발휘될 것입니다.
기타 혜택 :
- 엑셀 형식 시장 예측(ME) 시트
- 3개월간의 애널리스트 지원
자주 묻는 질문
목차
제1장 서론
제2장 조사 방법
제3장 주요 요약
제4장 시장 구도
제5장 시장 규모 및 성장 예측
제6장 경쟁 구도
제7장 시장 기회 및 향후 전망
KTH 26.06.19According to Mordor Intelligence, biosimulation market size in 2026 is estimated at USD 5.22 billion, growing from 2025 value of USD 4.47 billion with 2031 projections showing USD 11.3 billion, growing at 16.72% CAGR over 2026-2031.

This report Segments the Industry Into by Product (Software, Services), Delivery Model (Subscription, Ownership / On-Premise), Application (Preclinical and Clinical Drug Development, and More), by End User (Pharmaceutical and Biotechnology Companies, and More), and Geography (North America, Europe, Asia-Pacific, Middle-East and Africa, South America). The Market Forecasts are Provided in Terms of Value (USD).
Global Biosimulation Market Trends and Insights
Increasing Healthcare-Sector IT Budgets
Life-sciences CIO surveys show that a majority of firms raised technology allocations in 2024, with one quarter prioritizing artificial-intelligence projects. Larger budgets translate into stronger demand for integrated biosimulation platforms that merge PBPK, QSP, and AI algorithms. Pfizer and Novo Nordisk publicly report measurable cost savings tied to cloud-native modeling investments, reinforcing the business case for broader rollouts across the biosimulation market. Elevated spending also accelerates cloud infrastructure upgrades that permit extensive virtual twin studies and real-time collaboration among globally dispersed teams. The trend supports sustained double-digit growth for the biosimulation market over the medium term.
Growing Adoption of Biosimulation Platforms by Regulators
Regulatory momentum has reached a critical threshold. The FDA notes that QSP-based submissions now double every 1.4 years, while its permanent MIDD-paired-meeting program offers structured advice on quantitative models. The ICH M15 guideline, finalized in 2024, harmonizes international expectations for model-informed drug development and reduces uncertainty for sponsors. The EMA and PMDA publish detailed PBPK guidance, and agencies increasingly accept simulation data in lieu of animal studies for monoclonal antibodies. This official endorsement creates a feedback loop: each successful filing builds confidence, prompting still more sponsors to embed biosimulation into development plans.
Limited Awareness Among Clinicians & Trial Teams
Many trial investigators remain unfamiliar with quantitative modeling outputs, hindering full integration of virtual insights into protocol design and decision making. Educational curricula often lack advanced pharmacometrics modules, and operational staff face tight timelines that favor traditional practices. Companies respond with internal academies and e-learning modules, yet adoption still varies by therapeutic area and geography. The gap is widest in emerging markets where digital infrastructure lags and local regulators are only beginning to reference ICH M15. Until practical know-how spreads, some sponsors will under-utilize biosimulation's potential.
Other drivers and restraints analyzed in the detailed report include:
- Escalating Drug-Development Costs
- Cloud-Based High-Performance Computing Cuts Simulation TCO
- Shortage of Skilled PBPK/QSP Modelers
For complete list of drivers and restraints, kindly check the Table Of Contents.
Segment Analysis
Software solutions held 67.10% revenue in 2025, reflecting the preference for integrated modeling environments that streamline visualization, verification, and regulatory reporting. Certara's Phoenix release and Dassault Systemes' BIOVIA upgrades underscore a race to embed AI modules that speed compound screening. The biosimulation market continues to reward vendors that couple PBPK and QSP engines with intuitive dashboards and extensive compound libraries. Services, while smaller in absolute value, grow steadily as sponsors seek consulting expertise to customize workflows and interpret complex outputs reinforcing growth in the biosimulation market.
Services, though niche today, are projected to post an 18.05% CAGR by 2031 as real-time biosensor data feed directly into digital twins for chronic-disease management. This expansion broadens the biosimulation market beyond drug development into clinical decision support. Services providers benefit from the complexity of integrating sensor streams with QSP models, a task that demands both domain knowledge and data-engineering skills. Vendors that combine platform software with wraparound advisory offerings are positioned to capture higher share of wallet in late-stage projects.
Ownership-based deployments still account for 46.90% revenue because large pharmaceutical companies maintain sophisticated internal data centers. However, subscription services grow at 18.70% CAGR as firms value elastic compute and lower capital outlay. The biosimulation market reflects a larger life-sciences trend in which regulated workloads shift to validated cloud environments certified for Good Practice guidelines. Continuous algorithm updates and embedded compliance features appeal to small and mid-sized sponsors that lack specialist IT staff.
Security and data-sovereignty remain reasons for some enterprises to remain on-premise, especially when handling proprietary monoclonal-antibody sequences or trial data subject to regional privacy rules. Hybrid models therefore persist, with sensitive workloads staying behind the firewall and burst compute sent to the cloud. Platform providers respond with containerized deployments that move seamlessly between environments, ensuring identical validation documentation in either setting. Increased clarity from regulators regarding electronic-records controls will further unlock cloud use for pivotal-study models.
Geography Analysis
North America dominated with 44.10% revenue share in 2025, supported by the FDA's proactive stance on model-informed development and deep local venture funding. Europe follows, fueled by the EMA's extensive PBPK guidance, robust data-privacy laws that encourage secure cloud adoption, and strong industrial ties between software vendors and research hospitals. Both regions host many early adopters of QSP for complex biologics.
Asia-Pacific registers the fastest 22.60% CAGR, benefiting from regulatory harmonization and an expanding biosimilar pipeline. Japan's PMDA approved 35 biosimilar products by early 2024, several of which leveraged modeling to justify abbreviated clinical datasets. China's multi-year plan for pharmaceutical innovation has attracted global platform providers to establish regional centers, while India's emerging biotech corridor adds capacity for cost-efficient model building. Lower labor costs and a growing pool of data scientists enable local firms to operate dedicated biosimulation centers, reinforcing regional independence.
Latin America, the Middle East, and Africa contribute smaller shares today but display accelerating interest as multinational sponsors extend virtual-study methodology to diverse populations. Technology-transfer programs seed local know-how, and cloud infrastructure rollouts lower entry barriers. Over time, broader real-world-data availability will unlock the full potential of biosimulation in these underserved markets.
- Certara
- Dassault Systemes (BIOVIA)
- Simulations Plus
- Schrodinger
- Genedata
- Leadscope
- Entelos
- In Silico Biosciences
- Pharmaceutical Product Development
- Compugen
- Applied BioMath
- GNS Healthcare
- VeriSIM Life
- Insilico Medicine
- Syntekabio
- Simcyp
- Garuda Therapeutics
- Ansys (subsidiary MEDINI)
- Cadence Design Systems
- EMD Serono
Additional Benefits:
- The market estimate (ME) sheet in Excel format
- 3 months of analyst support
TABLE OF CONTENTS
1 Introduction
- 1.1 Study Assumptions & Market Definition
- 1.2 Scope of the Study
2 Research Methodology
3 Executive Summary
4 Market Landscape
- 4.1 Market Overview
- 4.2 Market Drivers
- 4.2.1 Increasing Healthcare-Sector IT Budgets
- 4.2.2 Growing Adoption of Biosimulation Platforms by Regulators
- 4.2.3 Escalating Drug-Development Costs
- 4.2.4 Cloud-Based High-Performance Computing Cuts Simulation TCO
- 4.2.5 FDA MIDD Program Mainstreams Model-Based Submissions
- 4.2.6 Expansion of Real-World-Data-Driven 'Virtual-Twin' Studies
- 4.3 Market Restraints
- 4.3.1 Limited Awareness Among Clinicians & Trial Teams
- 4.3.2 Shortage of Skilled PBPK/QSP Modelers
- 4.3.3 Lack of Global Data-Format & Model-Validation Standards
- 4.3.4 Regulatory Uncertainty Around AI-Generated Models
- 4.4 Porter's Five Forces Analysis
- 4.4.1 Threat of New Entrants
- 4.4.2 Bargaining Power of Buyers
- 4.4.3 Bargaining Power of Suppliers
- 4.4.4 Threat of Substitutes
- 4.4.5 Competitive Rivalry
5 Market Size & Growth Forecasts (Value in USD)
- 5.1 By Product
- 5.1.1 Software
- 5.1.2 Services
- 5.2 By Delivery Model
- 5.2.1 Subscription
- 5.2.2 Ownership / On-premise
- 5.3 By Application
- 5.3.1 Pre-clinical & Clinical Drug Development
- 5.3.2 Drug Discovery & Lead Optimization
- 5.3.3 Precision-medicine & Companion-diagnostics Design
- 5.4 By End User
- 5.4.1 Pharmaceutical & Biotechnology Companies
- 5.4.2 Contract Research Organizations
- 5.4.3 Academic & Research Institutes
- 5.5 By Geography
- 5.5.1 North America
- 5.5.1.1 United States
- 5.5.1.2 Canada
- 5.5.1.3 Mexico
- 5.5.2 Europe
- 5.5.2.1 Germany
- 5.5.2.2 United Kingdom
- 5.5.2.3 France
- 5.5.2.4 Italy
- 5.5.2.5 Spain
- 5.5.2.6 Rest of Europe
- 5.5.3 Asia-Pacific
- 5.5.3.1 China
- 5.5.3.2 Japan
- 5.5.3.3 India
- 5.5.3.4 Australia
- 5.5.3.5 South Korea
- 5.5.3.6 Rest of Asia-Pacific
- 5.5.4 Middle East & Africa
- 5.5.4.1 GCC
- 5.5.4.2 South Africa
- 5.5.4.3 Rest of Middle East & Africa
- 5.5.5 South America
- 5.5.5.1 Brazil
- 5.5.5.2 Argentina
- 5.5.5.3 Rest of South America
- 5.5.1 North America
6 Competitive Landscape
- 6.1 Market Concentration
- 6.2 Market Share Analysis
- 6.3 Company Profiles (includes Global level Overview, Market level overview, Core Segments, Financials as available, Strategic Information, Market Rank/Share for key companies, Products & Services, and Recent Developments)
- 6.3.1 Certara
- 6.3.2 Dassault Systemes (BIOVIA)
- 6.3.3 Simulations Plus
- 6.3.4 Schrodinger
- 6.3.5 Genedata
- 6.3.6 Leadscope
- 6.3.7 Entelos
- 6.3.8 In Silico Biosciences
- 6.3.9 Pharmaceutical Product Development
- 6.3.10 Compugen
- 6.3.11 Applied BioMath
- 6.3.12 GNS Healthcare
- 6.3.13 VeriSIM Life
- 6.3.14 Insilico Medicine
- 6.3.15 Syntekabio
- 6.3.16 Simcyp
- 6.3.17 Garuda Therapeutics
- 6.3.18 Ansys (subsidiary MEDINI)
- 6.3.19 Cadence Design Systems
- 6.3.20 EMD Serono
7 Market Opportunities & Future Outlook
- 7.1 White-space & Unmet-need Assessment
