
|
시장보고서
상품코드
2061592
교통 센서 시장 : 시장 점유율 분석, 업계 동향 및 통계, 성장 예측(2026-2031년)Traffic Sensors - Market Share Analysis, Industry Trends & Statistics, Growth Forecasts (2026 - 2031) |
||||||
 Mordor Intelligence
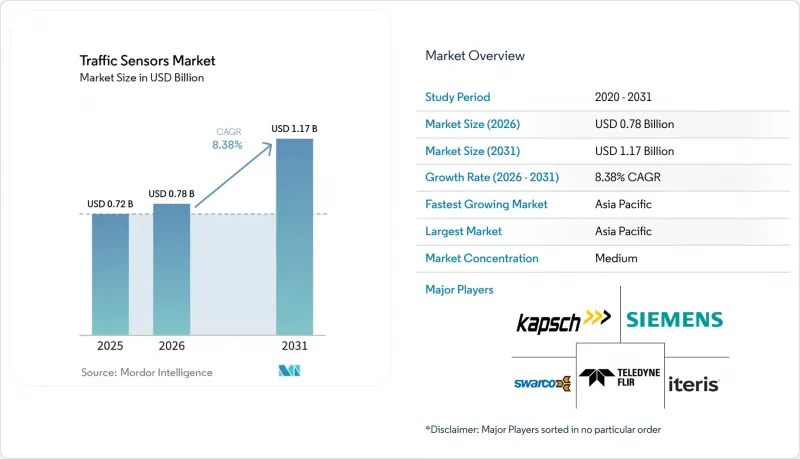
Mordor Intelligence에 의하면, 교통 센서 시장 규모는 2025년 7억 2,000만 달러로 평가되었고, 2026년에는 7억 8,000만 달러로 추정되고, 2026-2031년 CAGR 8.38%로 성장을 지속할 전망이며, 2031년에는 11억 7,000만 달러에 이를 것으로 예측됩니다.
본 보고서는 센서 유형별(유도 루프 등), 용도별(주행 중 중량 측정 등), 설치 방식별(침입형(도로 내) 등), 설치 장소별(도시 교차로 등), 최종 용도 부문별(정부 및 도로 관리 기관 등), 연결 기술별(유선 등) 및 지역별로 분류되어 있습니다. 시장 전망은 금액(달러) 기준으로 제시되어 있습니다.
세계의 교통 센서 시장 동향 및 인사이트
도시화 및 교통 체증의 압박
대도시권의 교통 정체는 뉴욕에 매년 200억 달러의 비용을 초래하고 있으며, 이에 따라 이동 시간을 최대 25% 단축하고 이산화탄소 배출량을 최대 20% 감축하기 위한 대규모 센서 도입이 추진되고 있습니다(trafficmobilityreviewboard). 34억 달러 규모의 연방 고속도로 안전 개선 기금을 통해, 사망 사고를 줄이기 위해 도로 개선 사업에 감지 기능이 도입되고 있습니다. 중국에서 진행 중인 약 800건의 스마트 시티 시범 사업은 차량, 보행자, 마이크로모빌리티 이용자를 아우르는 도입을 더욱 가속화하며, 교통 센서 시장을 단순한 도로 차량의 범위를 넘어 확장시키고 있습니다.
스마트 시티 및 ITS에 대한 자금 투자가 급증하고 있습니다.
미국의 SMART 보조금 프로그램은 2024년에 34개 프로젝트에 5,000만 달러를 지원하여, 다수의 센서가 설치된 교차로와 엣지 서버 도입의 선례를 만들었습니다. '호라이즌 유럽'은 상호 운용 가능한 감지 시스템을 의무화하는 디지털 교통 인프라에 2억 5,400만 유로(2억 7,600만 달러)를 배정했습니다. 알렉산드리아시의 500만 달러 규모 스마트 모빌리티 계획과 같은 도시 차원의 노력은 자금이 빠르게 지자체로 유입되고 있음을 보여줍니다.
초기 도입 시의 막대한 설비 투자
ITS America의 추산에 따르면, 미국 내 25만 곳의 교차로에 V2X 기술을 도입하는 데 65억 달러가 소요되며, 포장비, 인건비, 유지관리비 등으로 인해 그 부담은 더욱 커지고 있습니다. 오클라호마주의 40달러짜리 프로토타입과 같은 저비용 무선 노드가 진입 장벽을 낮추고 있음에도 불구하고, 개발도상국들은 자금 조달 격차에 직면해 있어 도입이 지연되고 있습니다. 로드아일랜드주의 275만 9,000달러 규모의 교량 모니터링 계약과 같은 사례는 개별 자산이라 할지라도 막대한 자본 투자가 필요함을 여실히 보여주고 있습니다.
부문별 분석
2025년 시점에서 유도 루프는 교통 센서 시장 점유율 37.35%를 유지했으나, LiDAR의 연평균 성장률(CAGR) 12.02%는 비침습적이고 고해상도 매핑으로의 전환을 시사하고 있습니다. 사업자들이 차량 분류와 보행자 안전을 통합한 솔루션을 요구하는 가운데, LiDAR 솔루션에 부수되는 교통 센서 시장 규모는 루프 센서를 능가할 것으로 예측됩니다. Seyond의 시스템은 차량 인식 정확도 99%, 보행자 인식률 92%를 달성하여 루프 방식의 대체 솔루션을 쉽게 능가하고 있습니다. 악천후 시에는 레이더와 열화상 카메라가 LiDAR를 보완하며, 주행 중 중량 측정(WIM)에는 압전 어레이가 여전히 필수적입니다. 여러 측정 방식을 결합한 엣지 지원 센서는 라이프사이클 비용을 절감하면서도 더 풍부한 데이터를 수집할 수 있어, 연방 정부의 SMART 가이드라인에서 우선순위로 꼽히고 있습니다.
LiDAR 시장의 성장세는 부품 가격 하락, 소형화, 그리고 자동차 등급의 신뢰성에 힘입어 가속화되고 있습니다. 기존의 루프식 센서는 노면 마모나 차선 추가에 대응하지 못하고 자전거를 감지하지 못하기 때문에 다중 모드 교통망에 대한 적응성에 한계가 있습니다. 적외선 및 자력계 솔루션은 비용이나 설치 장소에 제약이 있는 경우에 한해 제한적인 역할을 합니다. 다양한 공급업체 생태계가 등장하고 있지만, 기관들이 원시 데이터 제공보다 턴키 방식의 분석을 선호하기 때문에 통합 역량은 여전히 차별화 요소로 작용하고 있습니다.
2025년에는 신호등이 설치된 교차로에서 기존의 루프식 센서가 주류를 이루고 있어, 고정형 센서가 매출의 53.40%를 차지한 것으로 평가되었고, 휴대용 센서는 연평균 성장률(CAGR) 11.84%를 나타낼 것으로 전망됩니다. 교통 센서 시장에서는 차선 폐쇄나 아스팔트 절삭 작업을 피할 수 있으며 신속하게 설치할 수 있는 태양광 발전식 유닛에 대한 수요가 증가하고 있습니다. 오클라호마주의 40달러짜리 무선 노드는 자금이 제한적인 지역에서도 비용 경쟁력을 갖추고 있음을 보여줍니다. 현재 휴대용 LiDAR 키트가 건설 현장의 상황 파악을 지원하고 있으며, 이를 통해 시공업체의 안전 규정 준수가 용이해지고 있습니다.
교통 관리자들은 건설 단계, 행사 또는 임시 버스 전용 차선에 맞추어 센서를 재배치할 수 있는 유연성을 중요하게 생각합니다. 도로 표면에 영향을 주지 않는 도로 설치형 장비는 포장 도로의 무결성을 훼손하지 않으면서, 다중 차선에 대한 커버리지와 진단 기능을 제공합니다. 장기적으로는 루프 개량을 통해 데이터 정확도를 높이고 수명 주기 비용을 절감할 수 있는 레이더와 카메라의 결합 방식으로 전환되고 있습니다.
지역별 분석
아시아태평양은 2025년 매출의 34.70%를 차지했으며, 2031년까지 연평균 성장률(CAGR) 11.93%로 성장을 지속할 전망입니다. '중국 제조 2025' 프로그램을 기반으로 한 중국의 스마트시티 시범 사업을 통해, 도시 인프라 예산이 AI 기반 감지 기술에 지속적으로 투입되고 있습니다. 일본의 첨단 교통 시스템 분야는 정부 부처가 승인한 프로젝트에서 교통 흐름 예측 및 시각화 기술이 통합됨에 따라, 2033년까지 72억 3,900만 달러 규모 시장 성장을 목표로 하고 있습니다. 1조 4,000억 달러 규모의 인도 국가 인프라 계획은 다모달 물류 모니터링에 대한 수요 증가를 뒷받침하고 있습니다.
북미는 성숙한 도입 기반을 갖추고 있으나, 개조 및 업그레이드에 대한 투자를 지속하고 있습니다. 뉴욕에서 연간 1억 달러 규모의 SMART 예산 배정과 혼잡통행료 제도가 에지 지원 장비로의 교체를 촉진하고 있습니다. 차선 폐쇄를 최소화해야 하는 조달 프로젝트에서는 개보수에 적합한 비침습형 센서가 주류를 이루고 있습니다. 캐나다는 연방과 주 정부 간의 비용 분담을 통해 회랑 관리를 현대화하고 있는 반면, 멕시코는 USMCA의 무역 흐름과 연계된 화물 회랑에 주력하고 있습니다.
유럽에서는 센서 프로젝트가 탈탄소화 목표와 연계되어 있습니다. '호라이즌 유럽' 및 10억 유로 규모의 '연결, 협동 및 자동화 모빌리티(CCAM)' 프로그램이 다중 모드 감지의 상호 운용성을 지원하고 있습니다. 독일과 영국은 향후 자율주행 기술 도입에 적합한 차세대 센서를 탑재한 철도 및 고속도로에 자금을 투자하고 있습니다. 중동 및 아프리카에서는 주요 스마트시티 계획과 연계된 선택적 도입 사례가 나타나고 있지만, 석유 수출국들은 중량물 운송 회랑을 보호하기 위해 통행료 징수 시스템과 주행 중 중량 측정 네트워크에 자금을 지원하고 있습니다.
기타 혜택 :
- 엑셀 형식 시장 예측(ME) 시트
- 3개월간의 애널리스트 지원
자주 묻는 질문
목차
제1장 서론
제2장 조사 방법
제3장 주요 요약
제4장 시장 구도
제5장 시장 규모 및 성장 예측
제6장 경쟁 구도
제7장 시장 기회 및 향후 전망
AJY 26.06.22According to Mordor Intelligence, the traffic sensors market size is expected to grow from USD 0.72 billion in 2025 to USD 0.78 billion in 2026 and is forecast to reach USD 1.17 billion by 2031 at 8.38% CAGR over 2026-2031.
This report is Segmented by Sensor Type (Inductive Loop, and More), Application ( Weigh in Motion and More), Installation Method (Intrusive (In-Road) and More), Deployment Location (Urban Intersections and More), End-Use Sector (Government and Road Agencies and More), Connectivity Technology (Wired and More) and by Geography. The Market Forecasts are Provided in Terms of Value (USD).
Global Traffic Sensors Market Trends and Insights
Urbanisation & Congestion Pressure
Metropolitan congestion costs New York USD 20 billion each year, prompting large-scale sensor roll-outs that shorten travel times by as much as 25% and trim CO2 output up to 20% trafficmobilityreviewboard. Federal Highway Safety Improvement funds of USD 3.4 billion embed detection into roadway upgrades to cut fatalities. China's nearly 800 smart-city pilots further accelerate deployments that span vehicles, pedestrians and micromobility users, broadening the traffic sensors market beyond road vehicles alone
Smart-City & ITS Funding Surge
The USD SMART Grants program disbursed USD 50 million across 34 projects in 2024, setting precedents for sensor-rich intersections and edge servers .Horizon Europe earmarked EUR 254 million (USD 276 million) to digital transport infrastructure that mandates interoperable detection. City-level initiatives, such as Alexandria's USD 5 million smart-mobility plan, confirm that funding is cascading rapidly to municipal procurement
High Up-Front Deployment CAPEX
ITS America estimates USD 6.5 billion is needed to equip 250,000 U.S. intersections with V2X technology, a burden intensified by paving, labor and maintenance costs . Developing economies face financing gaps that delay roll-outs, although low-cost wireless nodes such as Oklahoma's USD 40 prototype ease entry barriers Contracts like Rhode Island's USD 2.759 million bridge monitoring deal highlight the sizable capital commitment even for individual assets
Other drivers and restraints analyzed in the detailed report include:
- Mandated Real-Time Data for Tolling & Congestion Pricing
- Edge-AI Low-Power Non-Intrusive Sensors
- Data-Privacy & Cyber-Security Compliance Costs
For complete list of drivers and restraints, kindly check the Table Of Contents.
Segment Analysis
Inductive loops retained 37.35% traffic sensors market share in 2025, yet LiDAR's 12.02% CAGR signals a pivot to non-intrusive, high-resolution mapping. The traffic sensors market size attached to LiDAR solutions is projected to outpace loops as operators seek vehicle classification and pedestrian safety in one package. Seyond's system posts 99% vehicle accuracy and 92% pedestrian recognition, outperforming loop-based alternatives simpl.. Radar and thermal imaging complement LiDAR in adverse weather, while piezoelectric arrays remain vital for weigh-in-motion. Edge-ready sensors that combine modalities collect richer data with lower lifecycle cost, a priority under federal SMART guidance
LiDAR's upward curve is reinforced by falling component prices, smaller form factors and automotive-grade reliability. Traditional loops struggle with pavement wear and lane additions, and their inability to detect cyclists limits suitability for multimodal grids. Infrared and magnetometer solutions hold niche roles where cost or site constraints dictate. A diverse supplier ecosystem is emerging, yet integration skill remains a differentiator as agencies favor turnkey analytics over raw feed delivery.
Intrusive installs made up 53.40% revenue in 2025 as legacy loops dominate signalized junctions, but portable sensors are forecast for 11.84% CAGR. The traffic sensors market increasingly rewards quick-deploy, solar-powered units that avoid lane closures and asphalt cutting. Oklahoma's USD 40 wireless node underscores cost competitiveness even for cash-constrained districts. Portable LiDAR kits now underpin work-zone situational awareness, easing contractor compliance with safety mandates.
Traffic managers prioritize flexibility to realign sensors with construction phases, events or pop-up bus lanes. Non-intrusive over-road gear delivers multi-lane coverage and diagnostics without disturbing pavement integrity. Long-term, loop retrofits shift toward radar-camera combos delivering higher data fidelity and lower lifetime spend.
Geography Analysis
Asia-Pacific generated 34.70% 2025 revenue and posts a 11.93% CAGR through 2031. China's smart-city pilots, anchored in the Made in China 2025 program, keep urban infrastructure budgets flowing toward AI-enabled detection. Japan's advanced traffic systems sector targets USD 7.239 billion by 2033 as Ministry-approved projects integrate flow prediction and visualization. India's USD 1.4 trillion National Infrastructure Pipeline underlines rising demand for multimodal logistics monitoring .
North America commands mature install bases yet continues to invest in retrofit upgrades. USD 100 million annual SMART allocations and congestion pricing in New York spur edge-ready replacements. Retrofit-friendly, non-intrusive sensors dominate procurements that must minimize lane closures. Canada modernizes corridor management through federal-provincial cost sharing, whereas Mexico focuses on freight corridors linked to USMCA trade flows.
Europe links sensor projects to decarbonization targets. Horizon Europe and the EUR 1 billion Connected, Cooperative and Automated Mobility program fund multi-modal detection interoperability. Germany and the UK channel funds into rail and high-speed roadways that embed next-gen sensors suitable for future autonomous deployment. Middle East and Africa exhibit selective adoption tied to flagship smart-city schemes, though oil-exporting states fund toll and weigh-in-motion networks to safeguard heavy-load corridors.
- Kapsch TrafficCom AG
- Siemens AG
- FLIR (Teledyne)
- Iteris Inc.
- Q-Free ASA
- SWARCO AG
- International Road Dynamics
- Sensys Networks Inc.
- Kistler Group
- Bosch Security & Safety Systems
- Axis Communications
- Smartmicro GmbH
- SICK AG
- EFKON GmbH
- Citilog (Swarco)
- Raytheon Technologies
- Sensata Technologies
- LeddarTech Inc.
- IHI Corporation
- Acyclica (FLIR)
Additional Benefits:
- The market estimate (ME) sheet in Excel format
- 3 months of analyst support
TABLE OF CONTENTS
1 INTRODUCTION
- 1.1 Study Assumptions and Market Definition
- 1.2 Scope of the Study
2 RESEARCH METHODOLOGY
3 EXECUTIVE SUMMARY
4 MARKET LANDSCAPE
- 4.1 Market Overview
- 4.2 Market Drivers
- 4.2.1 Urbanisation and Congestion Pressure
- 4.2.2 Smart-City and ITS Funding Surge
- 4.2.3 Mandated Real-Time Data for Tolling and Congestion Pricing
- 4.2.4 Electrification-Linked Grid-Aware Traffic Management
- 4.2.5 Edge-AI Low-Power Non-Intrusive Sensors
- 4.2.6 Multimodal Micromobility Detection Standards
- 4.3 Market Restraints
- 4.3.1 High Up-Front Deployment CAPEX
- 4.3.2 Data-Privacy & Cyber-Security Compliance Costs
- 4.3.3 Climate-Driven Sensor Degradation (Heat and Salinity)
- 4.3.4 Fragmented Protocols Hindering Interoperability
- 4.4 Value / Supply-Chain Analysis
- 4.5 Regulatory Landscape
- 4.6 Technological Outlook
- 4.7 Porters Five Forces
- 4.7.1 Threat of New Entrants
- 4.7.2 Bargaining Power of Buyers
- 4.7.3 Bargaining Power of Suppliers
- 4.7.4 Threat of Substitutes
- 4.7.5 Competitive Rivalry
5 MARKET SIZE & GROWTH FORECASTS (VALUE)
- 5.1 By Sensor Type
- 5.1.1 Inductive Loop
- 5.1.2 Piezoelectric
- 5.1.3 Bending Plate
- 5.1.4 Magnetometer
- 5.1.5 Image / Video
- 5.1.6 Radar-Based
- 5.1.7 Infrared
- 5.1.8 LiDAR
- 5.2 By Installation Method
- 5.2.1 Intrusive (In-Road)
- 5.2.2 Non-Intrusive (Over-Road / Roadside)
- 5.2.3 Portable / Temporary
- 5.3 By Application
- 5.3.1 Traffic Monitoring and Flow Optimisation
- 5.3.2 Weigh-In-Motion
- 5.3.3 Vehicle Classification and Profiling
- 5.3.4 Automated and Dynamic Tolling
- 5.3.5 Incident Detection and Safety Analytics
- 5.4 By Deployment Location
- 5.4.1 Urban Intersections
- 5.4.2 Highways and Expressways
- 5.4.3 Bridges and Tunnels
- 5.4.4 Parking Facilities
- 5.5 By End-Use Sector
- 5.5.1 Government and Road Agencies
- 5.5.2 Toll Operators / PPP Concessions
- 5.5.3 Smart-City Solution Integrators
- 5.5.4 Logistics and Fleet Operators
- 5.6 By Connectivity Technology
- 5.6.1 Wired (CAN, Ethernet)
- 5.6.2 Wireless (DSRC / C-V2X)
- 5.6.3 Cellular-IoT (NB-IoT / LTE-M / 5G)
- 5.6.4 LPWAN (LoRa / Sigfox)
- 5.7 By Geography
- 5.7.1 North America
- 5.7.1.1 United States
- 5.7.1.2 Canada
- 5.7.1.3 Mexico
- 5.7.2 South America
- 5.7.2.1 Brazil
- 5.7.2.2 Argentina
- 5.7.2.3 Rest of South America
- 5.7.3 Europe
- 5.7.3.1 Germany
- 5.7.3.2 United Kingdom
- 5.7.3.3 France
- 5.7.3.4 Spain
- 5.7.3.5 Italy
- 5.7.3.6 Rest of Europe
- 5.7.4 APAC
- 5.7.4.1 China
- 5.7.4.2 Japan
- 5.7.4.3 India
- 5.7.4.4 Australia
- 5.7.4.5 Rest of APAC
- 5.7.5 Middle East and Africa
- 5.7.5.1 GCC
- 5.7.5.2 South Africa
- 5.7.5.3 Rest of Middle East and Africa
- 5.7.1 North America
6 COMPETITIVE LANDSCAPE
- 6.1 Strategic Moves
- 6.2 Market Share Analysis
- 6.3 Company Profiles (includes Global level Overview, Market level overview, Core Segments, Financials as available, Strategic Information, Market Rank/Share for key companies, Products & Services, and Recent Developments)
- 6.3.1 Kapsch TrafficCom AG
- 6.3.2 Siemens AG
- 6.3.3 FLIR (Teledyne)
- 6.3.4 Iteris Inc.
- 6.3.5 Q-Free ASA
- 6.3.6 SWARCO AG
- 6.3.7 International Road Dynamics
- 6.3.8 Sensys Networks Inc.
- 6.3.9 Kistler Group
- 6.3.10 Bosch Security & Safety Systems
- 6.3.11 Axis Communications
- 6.3.12 Smartmicro GmbH
- 6.3.13 SICK AG
- 6.3.14 EFKON GmbH
- 6.3.15 Citilog (Swarco)
- 6.3.16 Raytheon Technologies
- 6.3.17 Sensata Technologies
- 6.3.18 LeddarTech Inc.
- 6.3.19 IHI Corporation
- 6.3.20 Acyclica (FLIR)
7 MARKET OPPORTUNITIES AND FUTURE OUTLOOK
- 7.1 White-Space and Unmet-Need Assessment