
|
시장보고서
상품코드
2061600
파이프라인 무결성 관리 시장 : 시장 점유율 분석, 업계 동향 및 통계, 성장 예측(2026-2031년)Pipeline Integrity Management - Market Share Analysis, Industry Trends & Statistics, Growth Forecasts (2026 - 2031) |
||||||
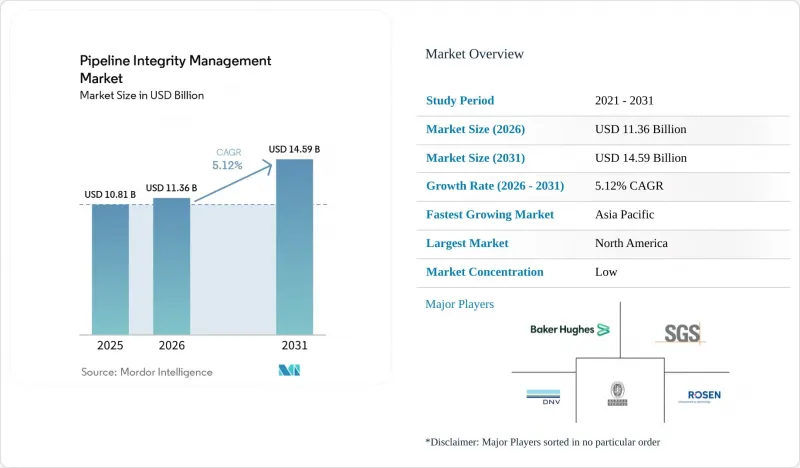
Mordor Intelligence에 의하면, 파이프라인 무결성 관리 시장 규모는 2025년 108억 1,000만 달러로 평가되었고, 2026년에는 113억 6,000만 달러로 추정되고, 2026-2031년 CAGR 5.12%로 성장을 지속할 전망이며, 2031년까지 145억 9,000만 달러에 이를 것으로 예측됩니다.
본 보고서는 제품 유형별(천연가스, LNG, 기타), 서비스 유형별(검사 서비스, 세척 서비스, 디지털 모니터링 및 분석 등), 단계별(신규 건설 파이프라인 및 가동 중, 기존 파이프라인), 솔루션 유형별(하드웨어, 소프트웨어, 서비스), 설치 장소별(육상 및 해상), 지역별(북미, 유럽, 아시아태평양 등)로 분류되어 있습니다.
세계의 파이프라인 무결성 관리 시장 동향 및 인사이트
OECD 회원국들의 파이프라인 네트워크 노후화로 인해 대대적인 개보수 작업이 진행되고 있습니다.
1950년대부터 1960년대에 걸쳐 미국 전역에 설치된 250만 마일 이상의 파이프라인 중 절반 이상이 현재 설계 수명을 초과하여, 스마트 피그ging, 음극 방청 시스템의 업그레이드, 그리고 실시간 부식 모니터링에 대한 지속적인 수요를 이끌고 있습니다. 이와 유사한 개보수 수요는 캐나다와 유럽으로도 확산되고 있으며, 혹독한 기후와 구형 강재 등급이 위험 요인으로 작용하고 있습니다. 사업자들은 예방적 건전성 관리 프로그램이 거래소보다 비용이 훨씬 적게 들고, 규제 당국의 승인도 신속하게 얻을 수 있다는 점을 인식하고 있습니다. 사고 이후 여론 감시가 강화되면서, 예측 유지보수의 사업적 타당성이 더욱 확고해지고 있습니다. 이러한 개보수 주기는 파이프라인 무결성 관리 시장 전반의 서비스 제공업체들에게 수십 년에 걸친 수익원을 보장해 주고 있습니다.
엄격한 건전성 관련 규제가 규정 준수 투자를 촉진
PHMSA의 2024-2025년 규정에서는 메탄 감지 범위 확대, 더욱 엄격한 수리 기준, 그리고 검사 빈도 증가가 의무화되어 있어, 이에 따라 사업자들은 첨단 평가 기법을 도입해야 하는 상황에 직면해 있습니다. 캐나다의 CSA Z662 규격도 이러한 추세를 반영하여, 문서화된 건전성 프로그램과 제3자에 의한 검증을 의무화하고 있습니다. 현재 규정 준수 관련 지출은 파이프라인 무결성 관리 시장의 견고한 기반을 형성하고 있으며, 상품 가격 변동으로부터 서비스 수요를 보호하고 있습니다. 측정 가능한 누출 감소 및 위험 완화 효과를 입증할 수 있는 공급업체는 확실한 경쟁 우위를 누리고 있습니다.
업스트림 및 미드스트림 부문의 설비 투자(CAPEX)의 주기성
가격이 하락하면 투자가 줄어들고, 선택적 검사나 디지털화 업그레이드가 미뤄지게 됩니다. 사업자들은 최소한의 규정 준수에 주력함에 따라, 파이프라인 무결성 관리 시장의 단기 수익은 감소할 것입니다. 구독형 소프트웨어를 제공하고 다양한 업종으로 사업을 확장하고 있는 벤더는 경기 침체기를 보다 원활하게 극복할 수 있습니다.
부문별 분석
2025년에는 천연가스 파이프라인이 매출의 46.35%를 차지했으며, 파이프라인 무결성 관리 시장의 기반을 형성하고 있습니다. 확립된 규격, 방대한 부설 거리, 그리고 정기적인 피그 검사가 지속적인 수요를 뒷받침하고 있습니다. 전 세계 액화 및 재기화 능력의 확대에 따라, LNG 관련 파이프라인 시장은 연평균 성장률(CAGR) 6.29%로 가장 빠르게 성장하고 있습니다. 극저온 환경에서는 특수강이나 단열재가 필요하기 때문에 검사의 난이도가 높아지고 있습니다. 원유 및 정제 제품 파이프라인은 그 다음으로 큰 시장 규모를 차지하고 있으며, 유출 방지 및 특수한 부식 위험에 대한 엄격한 감시를 받고 있습니다. 작업자의 교차 교육 및 제품 카테고리를 아우르는 데이터 분석의 재사용이 가능한 공급업체는 효율성을 높이고 있습니다.
LNG 붐은 극저온 기술, 파열 전 누출(LBB) 모델링, 그리고 급속한 증기 구름 확산 분석에 대한 전문 지식을 갖춘 공급업체들을 끌어모으고 있습니다. 통합업체는 라이프타임 디지털 트윈을 지원하기 위해 건설 과정에서 영구적인 센서를 설치하고 있습니다. LNG가 에너지 전환 포트폴리오의 필수적인 요소로 자리 잡음에 따라, 파이프라인 무결성 관리 시장에서의 점유율은 꾸준히 확대될 전망이며, 이는 조기에 역량을 구축한 기업들에게 보상이 될 것입니다.
2025년에는 검사 서비스가 매출의 39.05%를 차지했으며, 여전히 세계 표준 하에서 필수적인 요소로 남아 있습니다. 자속 누설, 초음파, EMAT 도구는 파손 전에 부식이나 균열을 감지하기 때문에 서비스 라인업의 핵심을 이루고 있습니다. 그러나 클라우드 대시보드가 원시 데이터를 실용적인 위험 점수로 변환함에 따라, 디지털 모니터링 및 분석 시장은 연평균 성장률(CAGR) 8.07%로 성장하고 있습니다. 사업자들은 비용이 많이 드는 전 구경 검사를 미루기 위해 지속적인 모니터링을 도입하고 있으며, 이에 따라 센서 통합 및 AI 모델 훈련에 대한 수요가 증가하고 있습니다.
세척, 수리 및 음극 방식 프로그램이 서비스 구성을 보완하며, 이들은 각각 주행 거리나 경과 연수에 따라 그 규모가 확대됩니다. 기계적 서비스 및 소프트웨어 분석을 결합한 공급업체는 더 장기적인 계약을 확보하고 있습니다. 성과 기반 가격 책정으로의 전환이 가속화되면서, 파이프라인 무결성 관리 시장에서 요금은 누출률 감소 및 가동 시간 향상과 연동되는 추세입니다.
지역별 분석
북미는 2025년 기준 매출 점유율 38.85%를 유지하고 있으며, 이는 세계 최대 규모의 노후화된 파이프라인망과 PHMSA의 엄격한 감독 체제에 힘입은 결과입니다. 개보수 투자는 고해상도 균열 감지 도구, 메탄 전용 누출 감지 시스템, 그리고 AI를 활용한 시추 프로그램에 중점을 두고 있습니다. 캐나다 역시 북극권 기후로 인해 유사한 노후화 문제에 직면해 있는 반면, 멕시코의 신규 간선 파이프라인에는 처음부터 기준이 되는 스마트 피그 주행 및 광섬유 기술이 적용되어 있습니다.
아시아태평양은 중국, 인도 및 동남아시아 국가들이 가스 및 LNG 네트워크를 확장하고 있어 7.56%라는 가장 높은 연평균 성장률(CAGR)을 기록하고 있습니다. 프로젝트 소유주는 감시 시스템을 구축하기 위해 FEED(기본 설계) 단계에서 건전성 설계 서비스를 계약했습니다. 국내 공급업체들은 최첨단 도구를 활용하면서 현지 조달률 목표를 달성하기 위해 전 세계 전문가들과 협력하고 있습니다. 일본과 한국의 수소 실증 회랑은 더 많은 기회를 열어줄 것입니다.
유럽의 성숙한 네트워크에서는 수소 혼합 의무화의 확대에 따라 재료 검증 및 재시험이 필요해지고 있습니다. 노르웨이의 해상 간선 파이프라인에서는 고압 환경에서의 보수 체계가 요구되고 있습니다. 중동에서는 초심해 파이프라인의 상태 관리 및 블루 수소 허브에 연결되는 CO2 파이프라인에 대한 투자가 진행되고 있지만, 아프리카의 신규 네트워크에서는 처음부터 턴키 방식의 상태 관리 패키지가 선호되고 있습니다. 남미에서는 브라질의 프레스솔트층 유정망과 아르헨티나의 셰일가스 수출 회랑에 주력하고 있습니다. 이러한 지역별 동향이 맞물려 파이프라인 무결성 관리 시장의 지속적인 성장을 뒷받침하고 있습니다.
기타 혜택 :
- 엑셀 형식 시장 예측(ME) 시트
- 3개월간의 애널리스트 지원
자주 묻는 질문
목차
제1장 서론
제2장 조사 방법
제3장 주요 요약
제4장 시장 구도
제5장 시장 규모 및 성장 예측
제6장 경쟁 구도
제7장 시장 기회 및 향후 전망
AJY 26.06.22According to Mordor Intelligence, the pipeline integrity management market size is expected to grow from USD 10.81 billion in 2025 to USD 11.36 billion in 2026 and is forecast to reach USD 14.59 billion by 2031 at 5.12% CAGR over 2026-2031.

This report is Segmented by Product Type (Natural Gas, LNG, and More), Service Type (Inspection Services, Cleaning Services, Digital Monitoring and Analytics, and More), Phase (New-Build Pipelines and Operational/Brown-Field Pipelines), Solution Type (Hardware, Software, and Services), Location of Deployment (On-Shore and Off-Shore), and Geography (North America, Europe, Asia-Pacific, and More).
Global Pipeline Integrity Management Market Trends and Insights
Aging Pipeline Networks in OECD Create a Retrofit Wave
More than half of the 2.5 million mi of U.S. pipe installed in the 1950s-1960s now exceeds design life, driving continuous demand for smart pigging, cathodic-protection upgrades, and real-time corrosion monitoring. Similar retrofit needs span Canada and Europe, where harsh climates and legacy steel grades heighten risk. Operators find that proactive integrity programs cost significantly less than replacement and are approved by regulators more quickly. Heightened public scrutiny after incidents strengthens the business case for predictive maintenance. The retrofit cycle sustains a decades-long revenue stream for service providers across the pipeline integrity management market.
Stringent Integrity-Related Regulations Drive Compliance Investment
PHMSA's 2024-2025 rules mandate expanded methane detection, stricter repair criteria, and increased inspection frequency, prompting operators to adopt advanced assessment methods. Canada's CSA Z662 mirrors the trend, requiring documented integrity programs and third-party verification. Compliance spending now forms a solid foundation under the pipeline integrity management market, insulating service demand from fluctuations in commodity prices. Vendors that can demonstrate measurable leak reduction and risk mitigation gains enjoy a clear competitive advantage.
CAPEX Cyclicality of Upstream & Midstream Spending
Investment falls when prices soften, delaying discretionary inspections and digital upgrades. Operators focus on bare-minimum compliance, trimming near-term revenue in the pipeline integrity management market. Vendors with subscription software and multi-sector exposure ride out downturns more smoothly.
Other drivers and restraints analyzed in the detailed report include:
- On-going Build-out of Long-haul Gas Lines in APAC & MEA
- Off-shore Ultra-deepwater Projects Surge Beyond 1,500 Meters
- High Initial Cost of Advanced ILI Tools
For complete list of drivers and restraints, kindly check the Table Of Contents.
Segment Analysis
Natural-gas pipelines captured 46.35% revenue in 2025, anchoring the pipeline integrity management market. Established codes, vast installed mileage, and routine pigging sustain recurring demand. LNG-related lines grow at the fastest rate, with a 6.29% CAGR, as global liquefaction and regasification capacity expands. Cryogenic temperatures necessitate special steel and insulation requirements, thereby increasing inspection complexity. Crude oil and refined products pipelines follow in value, facing strict scrutiny for spill prevention and specialized corrosion threats. Providers able to cross-train crews and reuse data analytics across product categories enhance efficiency.
The LNG boom attracts vendors with expertise in cryogenic technology, leak-before-break modeling, and rapid vapor cloud dispersion analysis. Integrators embed permanent sensors during build-out to support lifetime digital twins. As LNG becomes integral to energy transition portfolios, its share of the pipeline integrity management market size is poised to widen steadily, rewarding early capability builders.
Inspection services generated 39.05% of the revenue in 2025 and remain compulsory under global codes. Magnetic flux leakage, ultrasonics, and EMAT tools detect corrosion and cracks before failure, anchoring the services lineup. Yet, digital monitoring and analytics grow at an 8.07% CAGR as cloud dashboards transform raw signals into actionable risk scores. Operators adopt continuous monitoring to defer costly full-bore inspections, lifting demand for sensor integration and AI model training.
Cleaning, repair, and cathodic-protection programs round out the service mix, each scaling with mileage and age. Providers bundling mechanical services with software analytics secure stickier contracts. The shift toward outcome-based pricing accelerates, tying fees to leak-rate reduction or uptime gains inside the pipeline integrity management market.
Geography Analysis
North America retained 38.85% revenue share in 2025, backed by the world's largest roster of aging lines and rigorous PHMSA oversight. Retrofit spending focuses on high-resolution cracking tools, methane-focused leak-detection, and AI-driven dig programs. Canada faces similar aging challenges in Arctic climates, while Mexico's new trunk lines incorporate baseline smart-pig runs and fiber optics from the outset.
The Asia Pacific region records the fastest 7.56% CAGR as China, India, and Southeast Asian nations expand their gas and LNG grids. Project owners contract integrity design services during FEED to embed monitoring systems. Domestic vendors partner with global specialists to meet local content targets while accessing cutting-edge tools. Hydrogen demonstration corridors in Japan and South Korea further widen the opportunity.
Europe's mature network encounters rising hydrogen-blend mandates, prompting material verification and retesting. Norway's offshore arteries demand hyperbaric repair readiness. The Middle East invests in ultra-deepwater integrity and CO2 pipelines linked to blue hydrogen hubs, whereas Africa's greenfield networks favor turnkey integrity packages from the outset. South America concentrates on Brazil's pre-salt flowlines and Argentina's shale export corridors. These regional dynamics collectively support the durable expansion of the pipeline integrity management market.
- Baker Hughes Company
- SGS SA
- Bureau Veritas SA
- DNV AS
- TD Williamson Inc.
- Emerson Electric Co.
- ROSEN Group
- TUV Rheinland AG
- Intertek Group plc
- Applus+ Servicios Tecnologicos
- Quest Integrity Group
- Infosys Ltd.
- EnerMech Ltd.
- MATCOR Inc.
- PwC Asset Integrity Services
- Fluor Corporation
- Wood plc
- Aker Solutions ASA
- TechnipFMC plc
- Oceaneering International Inc.
Additional Benefits:
- The market estimate (ME) sheet in Excel format
- 3 months of analyst support
TABLE OF CONTENTS
1 Introduction
- 1.1 Study Assumptions & Market Definition
- 1.2 Scope of the Study
2 Research Methodology
3 Executive Summary
4 Market Landscape
- 4.1 Market Overview
- 4.2 Market Drivers
- 4.2.1 Aging pipeline networks in OECD create a retrofit wave
- 4.2.2 Stringent integrity-related regulations (PHMSA, CSA Z662)
- 4.2.3 On-going build-out of long-haul gas lines in APAC & MEA
- 4.2.4 Off-shore ultra-deepwater projects (>1 500 m) surge
- 4.2.5 AI-enabled digital twins slash inspection downtime
- 4.2.6 New hydrogen/CO? pipelines need higher integrity specs
- 4.3 Market Restraints
- 4.3.1 CAPEX cyclicality of upstream & mid-stream spending
- 4.3.2 High initial cost of advanced ILI tools
- 4.3.3 Cyber-security risk slowing IoT sensor rollout
- 4.3.4 Shortage of certified NDE technicians
- 4.4 Supply-Chain Analysis
- 4.5 Regulatory Landscape
- 4.6 Technological Outlook
- 4.7 Porter's Five Forces
- 4.7.1 Bargaining Power of Suppliers
- 4.7.2 Bargaining Power of Buyers
- 4.7.3 Threat of New Entrants
- 4.7.4 Threat of Substitutes
- 4.7.5 Intensity of Rivalry
- 4.8 Oil & Gas Operating Pipeline Length Outlook
- 4.9 Key Midstream Projects Information
5 Market Size & Growth Forecasts
- 5.1 By Product Type
- 5.1.1 Crude Oil
- 5.1.2 Natural Gas
- 5.1.3 Refined Products
- 5.1.4 LNG
- 5.2 By Service Type
- 5.2.1 Inspection Services
- 5.2.2 Cleaning Services
- 5.2.3 Repair and Refurbishment Services
- 5.2.4 Digital Monitoring and Analytics
- 5.2.5 Cathodic-protection Services
- 5.3 By Phase
- 5.3.1 New-build Pipelines
- 5.3.2 Operational/Brown-field Pipelines
- 5.4 By Solution Type
- 5.4.1 Hardware (ILI tools, sensors)
- 5.4.2 Software (Integrity platforms)
- 5.4.3 Services (EPC and O&M)
- 5.5 By Location of Deployment
- 5.5.1 On-shore
- 5.5.2 Off-shore
- 5.6 By Geography
- 5.6.1 North America
- 5.6.1.1 United States
- 5.6.1.2 Canada
- 5.6.1.3 Mexico
- 5.6.2 Europe
- 5.6.2.1 Norway
- 5.6.2.2 United Kingdom
- 5.6.2.3 Russia
- 5.6.2.4 Netherlands
- 5.6.2.5 Germany
- 5.6.2.6 Rest of Europe
- 5.6.3 Asia Pacific
- 5.6.3.1 China
- 5.6.3.2 India
- 5.6.3.3 Japan
- 5.6.3.4 South Korea
- 5.6.3.5 ASEAN Countries
- 5.6.3.6 Australia
- 5.6.3.7 Rest of Asia-Pacific
- 5.6.4 South America
- 5.6.4.1 Brazil
- 5.6.4.2 Argentina
- 5.6.4.3 Colombia
- 5.6.4.4 Rest of South America
- 5.6.5 Middle East and Africa
- 5.6.5.1 Saudi Arabia
- 5.6.5.2 United Arab Emirates
- 5.6.5.3 Qatar
- 5.6.5.4 Nigeria
- 5.6.5.5 South Africa
- 5.6.5.6 Rest of Middle East and Africa
- 5.6.1 North America
6 Competitive Landscape
- 6.1 Market Concentration
- 6.2 Strategic Moves (M&A, Partnerships, PPAs)
- 6.3 Market Share Analysis (Market Rank/Share for key companies)
- 6.4 Company Profiles (includes Global level Overview, Market level overview, Core Segments, Financials as available, Strategic Information, Products & Services, and Recent Developments)
- 6.4.1 Baker Hughes Company
- 6.4.2 SGS SA
- 6.4.3 Bureau Veritas SA
- 6.4.4 DNV AS
- 6.4.5 TD Williamson Inc.
- 6.4.6 Emerson Electric Co.
- 6.4.7 ROSEN Group
- 6.4.8 TUV Rheinland AG
- 6.4.9 Intertek Group plc
- 6.4.10 Applus+ Servicios Tecnologicos
- 6.4.11 Quest Integrity Group
- 6.4.12 Infosys Ltd.
- 6.4.13 EnerMech Ltd.
- 6.4.14 MATCOR Inc.
- 6.4.15 PwC Asset Integrity Services
- 6.4.16 Fluor Corporation
- 6.4.17 Wood plc
- 6.4.18 Aker Solutions ASA
- 6.4.19 TechnipFMC plc
- 6.4.20 Oceaneering International Inc.
7 Market Opportunities & Future Outlook
- 7.1 White-space & Unmet-need Assessment

