
|
시장보고서
상품코드
2061962
다중 에이전트 시스템(MAS) 플랫폼 : 시장 점유율 분석, 업계 동향 및 통계, 성장 예측(2026-2031년)Multi-Agent System (MAS) Platform - Market Share Analysis, Industry Trends & Statistics, Growth Forecasts (2026 - 2031) |
||||||
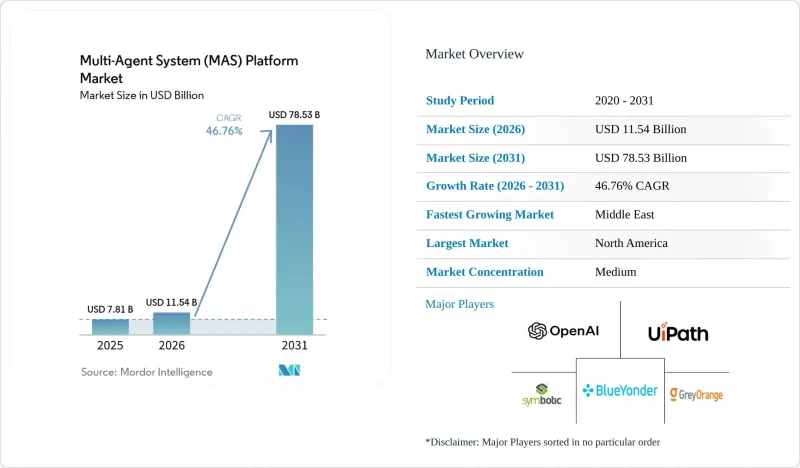
Mordor Intelligence에 의하면, 다중 에이전트 시스템(MAS) 플랫폼 시장 규모는 2025년 78억 1,000만 달러로 평가되었습니다. 2026년 115억 4,000만 달러에서 2031년까지 785억 3,000만 달러로 확대되어 2026년부터 2031년까지 연평균 복합 성장률(CAGR)은 46.76%를 나타낼 것으로 예측됩니다.
본 보고서는 플랫폼 유형(에이전트 개발 프레임워크, 오케스트레이션 플랫폼, 시뮬레이션 및 디지털 트윈 제품군 등), 도입 형태(클라우드, On-Premise/엣지), 최종 사용 산업(제조, 공급망 및 물류 등), 용도(워크플로우 및 프로세스 오케스트레이션 등), 그리고 지역별로 분류되어 있습니다. 시장 전망은 금액(달러) 기준으로 제시되어 있습니다.
세계의 다중 에이전트 시스템(MAS) 플랫폼 시장 동향 및 인사이트
클라우드 네이티브 다중 에이전트 시스템 도입 붐
Kubernetes 호환 오케스트레이션 플랫폼을 통해 개발자는 인프라를 변경하지 않고도 수십 개에서 수천 개의 에이전트로 확장할 수 있습니다. 2025년에 출시된 Microsoft의 AutoGen과 LangGraph Cloud는 YAML 구문을 실행 중인 클러스터로 변환하는 선언형 템플릿을 도입했습니다. 탄력적인 컴퓨팅과 관리형 네트워킹 덕분에 개념 검증(PoC) 주기가 단축되는 반면, 하이퍼스케일러들은 할인된 가격의 추론 가속기를 번들로 제공하여 고객을 자사의 생태계에 묶어두고 있습니다. 금융기관과 물류업체들은 집단 감염 관리 부담이 줄어들어 가치 실현까지 걸리는 시간이 단축되었다고 보고하고 있으며, 이는 다중 에이전트 시스템(MAS) 플랫폼 시장을 견인하는 선순환을 강화하고 있습니다.
창고 자동화 분야의 멀티 로봇 오케스트레이션 수요
현재 풀필먼트 센터에서는 개별 로봇의 기능이 아닌, 전체 로봇 군의 생산성을 최적화하고 있습니다. Locus Robotics는 300곳의 창고에서 6,000대 이상의 자율 주행 로봇을 운영하고 있으며, 수작업 피킹에 비해 주문 처리 시간을 25% 단축하고 있습니다. Symbotic사는 2024년, 월마트의 42개 물류 센터에서 5억 9,330만 달러의 수익을 올렸으며, 오케스트레이션을 통해 두 자릿수의 처리량 향상이 실현될 경우 기업들이 투자 의향이 높다는 사실이 입증되었습니다. 에지에 상주하는 에이전트가 클라우드 지연을 해소하고, 시뮬레이션 기반의 사전 훈련이 도입을 가속화함에 따라, 창고 자동화는 지속적인 성장의 원동력으로 자리매김하고 있습니다.
다중 에이전트 시스템을 다룰 수 있는 인력과 표준의 부족
LinkedIn의 ‘2025년 AI 인재 부족 보고서’에 따르면, 기업의 68%가 에이전트 간 통신 및 분산 강화 학습에 정통한 엔지니어 채용에 어려움을 겪고 있으며, 채용 소요 기간의 중앙값은 90일을 넘습니다. 표준화가 미흡하여 공급업체는 여러 온톨로지를 지원해야 하므로 온보딩 과정이 복잡해지고 있습니다. 또한, 전 세계 전문 인력 양성의 체계는 수요를 따라가지 못하고 있습니다. 이러한 인력 부족으로 인해 임금이 상승하고, 도입 기간이 길어지면서 보급 속도가 둔화되고 있습니다.
부문별 분석
자율 에이전트형 SaaS(Software-as-a-Service) 시장은 2026년부터 2031년까지 47.37% 성장할 것으로 전망됩니다. 이러한 놀라운 성장은 분산 시스템의 복잡성을 단순화하는 턴키 방식의 구독 모델에 대한 구매자들의 선호도가 높아지고 있음을 반영합니다. 기업들이 확장 가능하고 효율적인 솔루션을 추구하는 가운데, 이러한 모델이 SaaS 분야의 다중 에이전트 시스템(MAS) 플랫폼 시장 규모를 과거 평균을 크게 웃도는 수준으로 끌어올리고 있습니다. 2025년 34.63%의 매출 점유율을 유지한 오케스트레이션 플랫폼은 신뢰성, 내구성 및 ‘정확히 한 번만’ 실행되는 기능을 제공하는 벤더들 사이에서 기존 기업들이 확고한 입지를 다지고 있음을 보여줍니다.
순수한 프레임워크는 그 유연성과 사용자 정의 가능성 덕분에 엔지니어 주도형 조직의 지속적인 관심을 받고 있습니다. 그러나 합의 메커니즘이나 장애 감지와 관련된 학습 곡선이 가파르기 때문에 그 보급은 제한적입니다. NVIDIA Omniverse와 같은 시뮬레이션 제품군은 2025 회계연도에 연간 10억 달러의 매출 규모를 달성하며, 실제 배포에 앞서 정책을 가상으로 검증하려는 수요가 증가하고 있음을 여실히 보여주었습니다. 이러한 추세는 실제 환경에서의 용도 운영 시 위험을 줄이고 성능을 최적화하기 위한 시뮬레이션의 중요성을 강조하고 있습니다. CRM 및 ERP 제품군에 에이전트 기능을 통합하는 기존 기업 소프트웨어 기업들의 경쟁 압박으로 인해, 독립형 플랫폼의 이익률은 압박을 받을 것으로 예측됩니다. 그렇긴 하지만, 수직적 전문화와 맞춤형 솔루션은 상품화의 영향을 완화하고 공급업체가 경쟁 우위를 유지하는 데 도움이 됩니다.
2025년에는 클라우드가 매출 점유율의 72.58%를 차지했습니다. 이는 주로 클라우드가 탄력적으로 확장 가능하며 운영을 간소화할 수 있다는 점에 기인합니다. 이러한 우위는 다중 에이전트 시스템(MAS) 플랫폼 시장에서 클라우드 기반 솔루션에 대한 선호도가 높아지고 있음을 여실히 보여주고 있습니다. 그러나 On-Premise 및 엣지 구성은 2031년까지 연평균 성장률(CAGR) 47.21%를 달성할 것으로 전망됩니다. 이러한 급속한 성장으로 인해 클라우드와 기타 구성 요소 간 시장 점유율 격차는 줄어들 것으로 예측됩니다. On-Premise 및 엣지 솔루션의 도입 확대는 특히 제조업이나 병원에서 로컬에서의 데이터 처리가 필요하다는 점에 기인합니다. 이러한 조직들은 국경을 넘는 데이터 전송에 대해 제재를 가하는 유럽연합의 일반 데이터 보호 규정(GDPR(EU 개인정보보호규정)) 등 엄격한 데이터 보호 규정을 준수하는 것을 목표로 하고 있습니다.
양자화 모델 및 비용 효율적인 추론 칩과 같은 기술의 발전 덕분에 로봇, POS 단말기, 산업용 센서에서 에이전트를 100만 토큰당 1센트 미만의 대폭 절감된 비용으로 운영할 수 있게 되었습니다. 이러한 합리적인 가격 덕분에 다중 에이전트 시스템이 다양한 산업 분야에서 활용하기 쉬워졌습니다. 또한, 디바이스 내의 인식 루프와 클라우드 기반 계획 동기화를 결합한 하이브리드 토폴로지는 중앙 집중식 관리를 유지하면서도 지연을 대폭 줄여줍니다. 이러한 하이브리드 시스템은 실시간 의사 결정과 운영 효율성이 요구되는 용도에서 특히 유리합니다. 이러한 전개를 지원하기 위해 Microsoft Azure IoT Edge나 AWS Greengrass와 같은 플랫폼에는 오케스트레이션 확장 기능이 도입되어 있습니다. 이러한 기능 강화로 인해 분산 배포 관리가 간소화되고, 엣지 디바이스와 클라우드 인프라 간의 원활한 통합이 보장됩니다.
지역별 분석
북미는 하이퍼스케일러의 제품 출시와 물류·금융 분야의 조기 도입에 힘입어 2025년 매출의 41.38%를 차지했습니다. OpenAI와 AWS가 체결한 380억 달러 규모의 인프라 파트너십은 해당 지역에서 하이브리드 에이전트 워크로드 확대를 위한 노력을 뒷받침하고 있습니다. 또한, 자율주행 차량과 물류망을 연계하는 미국의 국방 프로그램은 이 기술을 상업적 사용자에게 더욱 타당한 것으로 자리매김하게 하여, 업계 전반에 걸친 보다 광범위한 도입을 촉진하고 있습니다. 유럽에서는 데이터 주권과 알고리즘의 투명성이 중요시되고 있으며, 독일의 자동차 및 산업 자동화 선도 기업이 AI법에 부합하는 에이전트 기반 스케줄링 시스템의 시범 운영을 진행하고 있습니다. 또한, 기업들이 엄격한 데이터 보호 규정을 준수해야 하는 상황에서 GDPR(EU 개인정보보호규정)의 제약 사항 역시 현지화 수요를 촉진하고 있습니다. 정부의 자금 지원 이니셔티브와 대학 주도의 연구 프로젝트가 계속해서 해당 지역의 혁신을 주도하고 있으며, 이는 다중 에이전트 시스템(MAS) 플랫폼 시장 전체의 성장에 꾸준히 기여하고 있습니다.
중동은 2026년부터 2031년까지 47.11%라는 지역별 최고 연평균 성장률(CAGR)을 보일 것으로 전망됩니다. 사우디아라비아의 NEOM이나 아랍에미리트의 두바이 디지털 트윈과 같은 대규모 프로젝트에서는 에너지 관리, 모빌리티, 폐기물 관리를 위해 에이전트가 통합되어 있습니다. 이 지역의 정부계 펀드는 자금을 지원하는 데 그치지 않고 최첨단 지속가능성 목표를 의무화함으로써, 공급업체가 혁신을 일으키고 사업을 확장할 수 있는 유리한 환경을 조성하고 있습니다. 아시아태평양은 중국의 스마트 시티 인프라에 대한 막대한 투자, 일본의 확고한 로봇 산업, 그리고 인도의 풍부한 소프트웨어 개발 인력의 혜택을 누리고 있습니다.
싱가포르의 에이전트 주도형 생태 지구는 지역 계획 담당자들에게 성과 벤치마크가 되고 있으며, 도시 개발에서 에이전트 기반 시스템의 가능성을 보여주고 있습니다. 남미와 아프리카는 현재 시장 규모는 작지만, 광업, 농업, 통신 등의 분야에서 조기 도입이 진행되고 있습니다. 이러한 지역에서는 인프라가 부족한 곳이라 할지라도, 에이전트가 자원 배분의 최적화와 업무 효율 향상에 활용되고 있으며, 그 적응성과 성장 가능성이 부각되고 있습니다.
기타 혜택 :
- 엑셀 형식 시장 예측(ME) 시트
- 3개월간의 애널리스트 지원
자주 묻는 질문
목차
제1장 서론
제2장 조사 방법
제3장 주요 요약
제4장 시장 구도
제5장 시장 규모 및 성장 예측
제6장 경쟁 구도
제7장 시장 기회 및 향후 전망
KTHAccording to Mordor Intelligence, the multi-agent system platform market size is projected to expand from USD 7.81 billion in 2025 and USD 11.54 billion in 2026 to USD 78.53 billion by 2031, registering a CAGR of 46.76% between 2026 and 2031.

This report is Segmented by Platform Type (Agent-Development Frameworks, Orchestration Platforms, Simulation and Digital-Twin Suites, and More), Deployment Mode (Cloud, and On-Premises/Edge), End-Use Industry (Manufacturing, Supply-Chain and Logistics, and More), Application (Workflow and Process Orchestration, and More), and Geography. The Market Forecasts are Provided in Terms of Value (USD).
Global Multi-Agent System (MAS) Platform Market Trends and Insights
Cloud-Native Multi-Agent System Deployment Boom
Kubernetes-compatible orchestration platforms let developers scale from dozens to thousands of agents without rewriting infrastructure. Microsoft's AutoGen and LangGraph Cloud, both launched in 2025, introduced declarative templates that turn YAML descriptions into running clusters. Elastic compute and managed networking shorten proof-of-concept cycles, while hyperscalers bundle discounted inference accelerators that lock customers into their ecosystems. Financial institutions and logistics operators report faster time-to-value once cluster management is offloaded, reinforcing the positive feedback loop that is lifting the multi-agent system platform market.
Warehouse-Automation Demand for Multi-Robot Orchestration
Fulfillment centers now optimize fleet-level productivity rather than individual robot features. Locus Robotics coordinates more than 6,000 autonomous mobile robots across 300 warehouses, cutting order-cycle time by 25% compared with manual picking. Symbotic earned USD 593.3 million from 42 Walmart distribution centers in fiscal 2024, underlining commercial willingness to invest when orchestration delivers double-digit throughput gains. Edge-resident agents avoid cloud latency, and simulation-based pretraining accelerates commissioning, positioning warehouse automation as a durable growth driver.
Scarcity of Multi-Agent-System-Ready Talent and Standards
LinkedIn's 2025 AI Talent Gap Report showed that 68% of enterprises struggle to hire engineers skilled in inter-agent communication and distributed reinforcement learning, stretching median recruitment cycles past 90 days. Fragmented standards complicate onboarding because vendors must support multiple ontologies, while global professional development pipelines lag behind demand. The shortfall inflates salaries and extends implementation timelines, slowing adoption.
Other drivers and restraints analyzed in the detailed report include:
- Convergence of Large-Language-Model-Based Agents and Reinforcement-Learning Frameworks
- Declining Edge-AI Costs Enabling On-Device Agents
- Expanded Cyber-Security Attack Surface at Agent Level
For complete list of drivers and restraints, kindly check the Table Of Contents.
Segment Analysis
Autonomous-agent software-as-a-service offerings are forecast to grow at 47.37% between 2026 and 2031. This significant growth reflects the increasing buyer preference for turnkey subscription models that simplify the complexities of distributed systems. These models are driving the multi-agent system platform market size for SaaS well above historical norms, as businesses seek scalable and efficient solutions. Orchestration platforms, which maintained a 34.63% revenue share in 2025, highlight the strong position of incumbents among vendors that provide reliability, durability, and exactly-once execution capabilities.
Pure-play frameworks continue to attract engineering-led organizations due to their flexibility and customization potential. However, the steep learning curve associated with consensus mechanisms and failure detection has limited their broader adoption. Simulation suites, such as NVIDIA Omniverse, achieved a USD 1 billion annual run rate in fiscal 2025, emphasizing the growing demand for virtual validation of policies before physical deployment. This trend underscores the importance of simulation in reducing risks and optimizing performance in real-world applications. Competitive pressure from enterprise-software incumbents bundling agents into CRM and ERP suites is expected to compress standalone platform margins. Nevertheless, vertical specialization and tailored solutions can help mitigate the effects of commoditization, enabling vendors to maintain a competitive edge.
Cloud retained 72.58% of the revenue share in 2025, primarily due to its ability to scale elastically and simplify operations. This dominance highlights the growing preference for cloud-based solutions in the multi-agent system platform market. However, on-premises and edge configurations are projected to achieve a significant compound annual growth rate (CAGR) of 47.21% through 2031. This rapid growth is expected to narrow the market share gap between cloud and other configurations. The increasing adoption of on-premises and edge solutions is driven by the need for localized data processing, particularly among manufacturers and hospitals. These entities aim to comply with stringent data protection regulations, such as the European Union's General Data Protection Regulation (GDPR), which imposes penalties for cross-border data transfers.
Advancements in technology, such as quantized models and cost-effective inference chips, have enabled robots, point-of-sale devices, and industrial sensors to operate agents at a significantly reduced cost-less than one cent per million tokens. This affordability has expanded the accessibility of multi-agent systems across various industries. Additionally, hybrid topologies that combine on-device perception loops with cloud-based planning synchronization offer substantial latency benefits while maintaining centralized oversight. These hybrid systems are particularly advantageous for applications requiring real-time decision-making and operational efficiency. To support such deployments, platforms like Microsoft Azure IoT Edge and AWS Greengrass have introduced orchestration extensions. These enhancements simplify the management of split deployments, ensuring seamless integration between edge devices and cloud infrastructure.
Geography Analysis
North America captured 41.38% of 2025 revenue, driven by hyperscaler product launches and early adoption in logistics and finance. OpenAI and AWS's USD 38 billion infrastructure partnership underscores regional commitment to scaling hybrid-agent workloads. Additionally, the U.S. defense programs that coordinate autonomous vehicles and logistics chains have further legitimized the technology for commercial buyers, encouraging broader adoption across industries. Europe emphasizes data sovereignty and algorithmic transparency, with automotive and industrial automation leaders in Germany piloting agent-based scheduling systems that align with the AI Act. GDPR limitations are also fueling demand for localized deployments, as businesses seek to comply with stringent data protection regulations. Government funding initiatives and university-led research projects continue to drive innovation in the region, ensuring a steady contribution to the overall growth of the multi-agent system platform market.
The Middle East is forecast to record the fastest regional CAGR at 47.11% between 2026 and 2031. Large-scale projects like Saudi Arabia's NEOM and the United Arab Emirates' Dubai Digital Twin are integrating agents for energy management, mobility, and waste management. Sovereign wealth funds in the region are not only supplying capital but also mandating cutting-edge sustainability targets, creating a fertile environment for vendors to innovate and expand. Asia-Pacific benefits from China's significant investments in smart-city infrastructure, Japan's well-established robotics industry, and India's abundant software development talent.
Singapore's agent-driven eco-district serves as a performance benchmark for regional planners, showcasing the potential of agent-based systems in urban development. South America and Africa, while smaller markets today, are demonstrating early adoption in sectors such as mining, agriculture, and telecommunications. In these regions, agents are being used to optimize resource allocation and improve operational efficiency, even in areas with limited infrastructure, highlighting their adaptability and growth potential.
- OpenAI LLC
- UiPath Inc.
- GreyOrange Inc.
- C3.ai Inc.
- Fetch.ai Foundation Pte Ltd.
- Mindsmiths d.o.o.
- CrewAI Inc.
- Swarms AI Inc.
- HASH.ai Ltd.
- Algovera DAO Ltd.
- Emergence AI Inc.
- AgentVerse Technologies Ltd.
- Temporal Technologies Inc.
- Instadeep Ltd.
- Locus Robotics Corp.
- Blue Yonder Group Inc.
- Manus AI
- Onomatic LLC
- Softeon Inc.
- Symbotic Inc.
- Camunda Services GmbH
- Airt Inc.
- Relevance AI Pty Ltd.
- Anthropic P.B.C.
- Cognizant Technology Solutions Corp.
Additional Benefits:
- The market estimate (ME) sheet in Excel format
- 3 months of analyst support
TABLE OF CONTENTS
1 INTRODUCTION
- 1.1 Study Assumptions and Market Definition
- 1.2 Scope of the Study
2 RESEARCH METHODOLOGY
3 EXECUTIVE SUMMARY
4 MARKET LANDSCAPE
- 4.1 Market Overview
- 4.2 Market Drivers
- 4.2.1 Cloud-Native MAS Deployment Boom
- 4.2.2 Warehouse-Automation Demand for Multi-Robot Orchestration
- 4.2.3 Convergence of LLM-Based Agents and Reinforcement-Learning Frameworks
- 4.2.4 Declining Edge-AI Costs Enabling On-Device Agents
- 4.2.5 Token-Incentivised Open MAS Protocols
- 4.2.6 Emergence of Agent-Alignment Toolkits for Safety-Critical Industries
- 4.3 Market Restraints
- 4.3.1 Scarcity of MAS-Ready Talent and Standards
- 4.3.2 Expanded Cyber-Security Attack Surface at Agent Level
- 4.3.3 GPU and Inference-Chip Supply-Chain Volatility
- 4.3.4 Energy-Efficiency Pressure from ESG Investors
- 4.4 Industry Value-Chain Analysis
- 4.5 Regulatory Landscape
- 4.6 Technological Outlook
- 4.7 Impact of Macroeconomic Factors on the Market
- 4.8 Porter's Five Forces Analysis
- 4.8.1 Threat of New Entrants
- 4.8.2 Bargaining Power of Suppliers
- 4.8.3 Bargaining Power of Buyers
- 4.8.4 Threat of Substitutes
- 4.8.5 Intensity of Competitive Rivalry
5 MARKET SIZE & GROWTH FORECASTS (VALUE)
- 5.1 By Platform Type
- 5.1.1 Agent-Development Frameworks
- 5.1.2 Orchestration Platforms
- 5.1.3 Simulation and Digital-Twin Suites
- 5.1.4 Autonomous-Agent SaaS
- 5.1.5 Other Platform Type
- 5.2 By Deployment Mode
- 5.2.1 Cloud
- 5.2.2 On-Premises / Edge
- 5.3 By End-Use Industry
- 5.3.1 Manufacturing
- 5.3.2 Supply-Chain and Logistics
- 5.3.3 Healthcare and Life-Sciences
- 5.3.4 BFSI
- 5.3.5 Smart Cities and Infrastructure
- 5.4 By Application
- 5.4.1 Workflow and Process Orchestration
- 5.4.2 Multi-Robot Coordination
- 5.4.3 Decision-Support and Planning
- 5.4.4 Simulation and Digital-Twin Modelling
- 5.4.5 Autonomous Trading and Fin-Ops
- 5.5 By Geography
- 5.5.1 North America
- 5.5.1.1 United States
- 5.5.1.2 Canada
- 5.5.1.3 Mexico
- 5.5.2 South America
- 5.5.2.1 Brazil
- 5.5.2.2 Argentina
- 5.5.2.3 Rest of South America
- 5.5.3 Europe
- 5.5.3.1 Germany
- 5.5.3.2 United Kingdom
- 5.5.3.3 France
- 5.5.3.4 Italy
- 5.5.3.5 Spain
- 5.5.3.6 Russia
- 5.5.3.7 Rest of Europe
- 5.5.4 Asia-Pacific
- 5.5.4.1 China
- 5.5.4.2 Japan
- 5.5.4.3 India
- 5.5.4.4 South Korea
- 5.5.4.5 Rest of Asia-Pacific
- 5.5.5 Middle East
- 5.5.5.1 United Arab Emirates
- 5.5.5.2 Saudi Arabia
- 5.5.5.3 Turkey
- 5.5.5.4 Qatar
- 5.5.5.5 Rest of Middle East
- 5.5.6 Africa
- 5.5.6.1 South Africa
- 5.5.6.2 Nigeria
- 5.5.6.3 Egypt
- 5.5.6.4 Rest of Africa
- 5.5.1 North America
6 COMPETITIVE LANDSCAPE
- 6.1 Market Concentration
- 6.2 Strategic Moves
- 6.3 Market Share Analysis
- 6.4 Company Profiles (includes Global Level Overview, Market Level Overview, Core Segments, Financials as available, Strategic Information, Market Rank/Share, Products and Services, Recent Developments)
- 6.4.1 OpenAI LLC
- 6.4.2 UiPath Inc.
- 6.4.3 GreyOrange Inc.
- 6.4.4 C3.ai Inc.
- 6.4.5 Fetch.ai Foundation Pte Ltd.
- 6.4.6 Mindsmiths d.o.o.
- 6.4.7 CrewAI Inc.
- 6.4.8 Swarms AI Inc.
- 6.4.9 HASH.ai Ltd.
- 6.4.10 Algovera DAO Ltd.
- 6.4.11 Emergence AI Inc.
- 6.4.12 AgentVerse Technologies Ltd.
- 6.4.13 Temporal Technologies Inc.
- 6.4.14 Instadeep Ltd.
- 6.4.15 Locus Robotics Corp.
- 6.4.16 Blue Yonder Group Inc.
- 6.4.17 Manus AI
- 6.4.18 Onomatic LLC
- 6.4.19 Softeon Inc.
- 6.4.20 Symbotic Inc.
- 6.4.21 Camunda Services GmbH
- 6.4.22 Airt Inc.
- 6.4.23 Relevance AI Pty Ltd.
- 6.4.24 Anthropic P.B.C.
- 6.4.25 Cognizant Technology Solutions Corp.
7 MARKET OPPORTUNITIES AND FUTURE OUTLOOK
- 7.1 White-Space and Unmet-Need Assessment
