
|
시장보고서
상품코드
2062045
몰입형 분석 시장 : 점유율 분석, 업계 동향과 통계, 성장 예측(2026-2031년)Immersive Analytics - Market Share Analysis, Industry Trends & Statistics, Growth Forecasts (2026 - 2031) |
||||||
 Mordor Intelligence
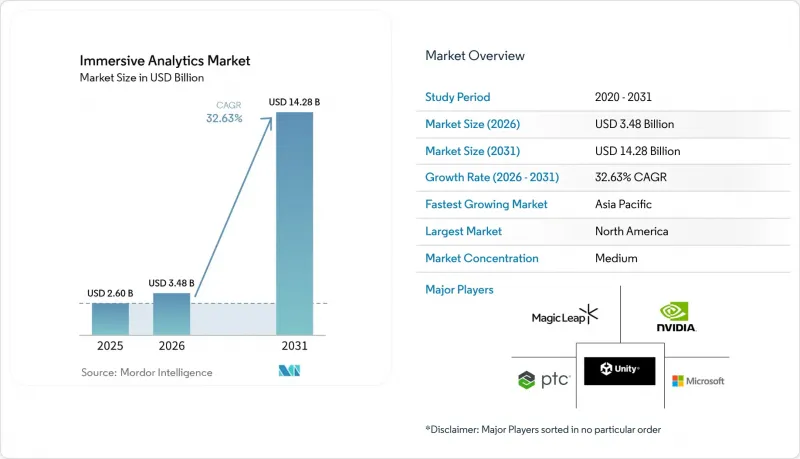
Mordor Intelligence에 의하면, 몰입형 분석 시장 규모는 2025년 26억 달러에서 2026년에는 34억 8,000만 달러로 확대되어 2031년까지 142억 8,000만 달러에 이를 것으로 예측됩니다.
2026년부터 2031년까지 연평균 성장률(CAGR) 32.63%로 성장할 것으로 전망됩니다.
본 보고서는 구성 요소(소프트웨어, 하드웨어, 서비스), 기술(증강현실(AR) 등), 도입 모델(클라우드, On-Premise 등), 상호작용 방식(제스처 기반 등), 최종 사용자 산업(헬스케어 및 생명과학, 제조·산업, 소매 및 전자상거래 등) 및 지역별로 분류되어 있습니다. 시장 전망은 금액(달러) 기준으로 제시되어 있습니다.
전 세계 몰입형 분석 시장 동향과 인사이트
기업들의 디지털 트윈 도입 가속화
물리적 자산과 가상 복제본의 거의 실시간 동기화를 통해, 디지털 트윈은 몰입형 분석을 위한 실시간 데이터 플랫폼으로 거듭나고 있습니다. IoT 텔레메트리, 시뮬레이션, 3D 시각화를 결합한 제조업체는 투자 회수 기간의 중앙값이 18개월로 나타나, 기존 대시보드에 비해 2배 빠른 속도로 투자 회수를 달성했습니다. ABB Genix와 같은 플랫폼의 등장으로 경보 지연 시간이 2초 미만으로 단축되었으며, 이를 통해 유지보수 팀은 가동 중단이 발생하기 전에 장비의 고장 확률을 종합적으로 확인할 수 있게 되었습니다. 일본의 ‘Ouranos 생태계’를 포함한 정부 주도의 이니셔티브는 공장 간 상호 운용성을 추구하며, 고립된 시범 프로젝트가 아닌 다국적 차원의 확장을 가능하게 하고 있습니다. 그 결과, 희소 센서 데이터와 물리 모델을 융합하기 위한 데이터 동화 알고리즘을 정교화한 벤더가 몰입형 분석 시장에서 두각을 나타낼 것입니다.
XR 헤드마운트 디스플레이의 단가 하락
엔터프라이즈급 혼합현실(MR) 헤드셋은 현재 2022년 가격의 불과 몇 분의 일 수준에 판매되고 있습니다. Meta Quest 3는 500달러 미만의 가격으로 판매되면서도 워크스테이션급 화질을 구현해냈으며, Apple Vision Pro와 같은 하이엔드 모델은 고품질 광학 시스템을 탑재한 제품이라도 1년 만에 100만 대를 판매할 수 있음을 입증했습니다. 디스플레이 제조업체들은 스마트폰용 OLED 생산 라인을 전용하고 있으며, 무어의 법칙을 뛰어넘는 속도로 가격 하락을 가속화하고 있습니다. 러기드 태블릿과 동등한 가격 수준이 됨에 따라, 소매, 교육, 건설 분야의 중견 기업들도 마침내 팀 전체에 이를 도입할 수 있게 되었으며, 시범 운영 규모를 훨씬 뛰어넘는 몰입형 분석 시장을 주도할 대규모 주문이 가능해졌습니다.
제작 인력 부족
공간 디자인, 데이터 엔지니어링, 그리고 도메인 지식이 하나의 역할에 공존하는 경우는 드물기 때문에 기업들은 2D 대시보드를 몰입형 레이아웃으로 전환하는 데 어려움을 겪고 있습니다. XR2Learn 등 유럽연합(EU)의 프로그램들은 인재 공급망 확대를 목표로 하고 있지만, 수요를 충족시킬 만큼 신속하게 인재를 배출해 내지는 못하고 있습니다. Microsoft Mesh에 노코드 에디터가 탑재되어 있음에도 불구하고, 기업들은 세부 조정을 위해 여전히 Unity나 언리얼 전문가들을 채용하고 있으며, 이것이 프로젝트의 병목 현상이 되고 있습니다. 대학에서는 막대 그래프나 산점도가 주를 이루기 때문에 재교육이 필수적입니다. 인재 풀이 두터워질 때까지는 채용 비용과 리드타임이 도입을 지연시켜 몰입형 분석 시장의 성장률을 저해하는 요인이 될 것입니다.
부문별 분석
2025년, 구독형 플랫폼이 기업의 데이터 웨어하우스에 직접 통합됨에 따라 소프트웨어는 몰입형 분석 시장의 51.78%를 차지했습니다. 각 벤더사는 애널리스트들이 도구를 전환할 필요 없이 Tableau나 Power BI 내에 3D 캔버스를 삽입할 수 있는 플러그인을 출시했습니다. 도입 프로젝트에서는 기존 SQL을 공간 쿼리로 변환하는 작업이 빈번하게 이루어지고 있으며, 이것이 서비스 매출의 두 자릿수 성장을 이끌고 있습니다. 조직들이 변경 관리 로드맵, 보안 강화 및 맞춤형 워크플로 로직을 필요로 함에 따라, 몰입형 분석 서비스 시장은 연평균 성장률(CAGR) 33.23%로 급속히 성장할 것으로 전망됩니다. 하드웨어는 광학 시스템, 센서 및 연산 처리 측면에서 여전히 필수적이지만, BYH(Bring-Your-Own-Headset) 정책으로 인해 설비 투자 증가세가 둔화되면서 그 가치는 소프트웨어 생태계로 이동하고 있습니다.
지속적인 미들웨어 혁신 또한 소프트웨어의 우위를 뒷받침하고 있습니다. Unity의 로보틱스 커넥터는 실제 환경의 텔레메트리 데이터와 씬 그래프를 99.99%의 정확도로 동기화하여, 공장이 코드를 리팩토링할 필요 없이 업데이트된 디지털 트윈을 확인할 수 있도록 합니다. Immersion Analytics는 정보의 혼동을 일으키지 않으면서 한 번에 6개의 변수를 표시하는 레이어드 글로우 및 반투명화 기술에 대한 특허를 보유하고 있습니다. 로우코드 개발 템플릿이 보편화됨에 따라, 몰입형 분석 시장에서는 소프트웨어의 지속 사용률이 하드웨어의 교체 주기를 앞지르게 되어, 구독 중심의 수익 구조가 더욱 공고해질 것입니다.
2025년에는 현장 작업자가 매뉴얼이나 품질 지표를 기계 화면에 중첩하여 표시하는 핸즈프리 오버레이 기능을 중시함에 따라, 증강현실(AR)이 44.82%의 점유율을 차지했습니다. 그러나 센서에서 수집된 데이터와 3D 시뮬레이션을 융합함으로써 변전소의 디지털 트윈과 열 데이터를 결합해 변압기의 스트레스 상태를 감지하는 등의 예측 작업이 가능해짐에 따라, 혼합현실(MR)용 몰입형 분석 시장은 연평균 성장률(CAGR) 33.03%로 더욱 빠르게 확대될 전망입니다. 외부 요인으로 인한 주의 산만이 집중력을 방해하는 조종사나 외과의사의 훈련에서는 가상현실(VR) ‘코쿤’이 여전히 인기를 끌고 있지만, 이러한 격리된 환경은 상황적 맥락이 필요한 운영 대시보드의 활용을 제한하고 있습니다.
디바이스 로드맵을 보면, 각 모달리티가 경쟁하기보다는 서로 융합되어 가고 있음을 알 수 있습니다. Apple Vision Pro 사용자는 물리적 포스트잇 옆에 분석 대시보드를 고정할 수 있으며, Meta가 개방형 Quest 하드웨어에 주력함에 따라 타사 개발자들은 모든 몰입형 시나리오를 지원할 수 있게 됩니다. 따라서 기업들은 기기 간 동기화를 요구하고 있으며, 벤더들은 상태를 유지한 채 VR 헤드셋에서 AR 글래스로, 그리고 2D 브라우저로 세션을 이어갈 수 있는 클라우드 오케스트레이션 계층을 구축해야 하는 압박을 받고 있습니다. 이러한 상호 운용성은 몰입형 분석 시장의 경쟁사들에게 필수적인 요건이 될 것입니다.
지역별 분석
북미는 2025년 매출의 35.62%를 차지하며, 교통 안전 조사 및 국방 시험 환경에 디지털 트윈을 도입하기 위한 연방 정부의 예산 배정이 이를 뒷받침하고 있습니다. 초당파적인 ‘몰입형 기술 리더십 법’은 이 기술을 국가 경쟁력의 핵심 요소로 격상시켜, 보조금 지원 및 부처 간 협력을 가능하게 하고 있습니다. 캐나다의 광산 업체와 임업 종사자들은 외딴 지역에서의 작업을 안전하게 수행하기 위해 몰입형 지하 모델에 의존하고 있는 반면, 멕시코의 자동차 산업 클러스터에서는 공간 품질 대시보드를 생산 라인 옆의 SAP 시스템에 직접 통합하고 있습니다. 기업 고객들 또한 고밀도 5G 구축과 저지연 렌더링 팜을 호스팅하는 하이퍼스케일 클라우드 노드의 혜택을 누리고 있습니다.
아시아태평양은 2031년까지 연평균 성장률(CAGR)이 33.74%에 달하고, 가장 빠르게 성장하는 지역이 될 것으로 전망됩니다. 일본의 ‘PLATEAU’ 프로젝트는 이미 236개 지자체에 3D 도시 모델을 제공하고 있으며, 2027년까지 500개 지자체로 확대하는 것을 목표로 하고 있습니다. 이는 도시 재해 시뮬레이션 및 인프라 계획을 추진하기 위한 공공 데이터 자산입니다. 중국 상하이에서는 트윈 맵을 활용해 폐기물 수거 및 전기 자전거 충전을 관리하는 한편, 역학 분석에 데이터를 제공함으로써 도시 차원의 활용 사례를 입증하고 있습니다. 인도의 Jio True5G 네트워크는 현재 5,500개 도시를 커버하고 있으며, 외딴 지역의 변전소에서도 몰입형 현장 서비스 오버레이를 구현하고 있습니다. 한국과 호주는 스마트 팩토리와 광산 트윈에 대한 투자를 확대하며, 지역 전체의 성장세를 뒷받침하고 있습니다.
유럽은 2025년에 중간 수준의 점유율에 그쳤으나, 정책적 호재에 힘입어 성장이 가속화될 것으로 예측됩니다. ‘유럽 가상 세계 파트너십’은 2억 유로(2억 2,600만 달러)의 공동 자금을 조성했으며, ‘디지털 유럽 테스트베드’는 1,700만 유로(1,920만 달러)를 국경을 초월한 샌드박스에 투자하고 있습니다. 이러한 프로그램은 개방형 표준 API를 의무화함으로써 벤더 중립성을 촉진하고 구매자의 신뢰를 높이고 있습니다. 벨기에, 핀란드, 네덜란드에서 진행 중인 ‘x-CITE CitiVerse’ 등의 시범 사업을 통해 시민들이 구역 지정안을 3D로 시각화할 수 있게 되면서, 일반 시민들의 이해도가 높아지고 있습니다. 남미, 중동 및 아프리카는 절대적인 지출 규모 면에서는 뒤처져 있지만, 정부계 펀드나 석유 및 가스·광업과 같은 자원 부문의 사례를 활용하여 지역 전체로 확대 가능한 선도적인 프로젝트에 대한 자금 조달을 진행하고 있습니다.
기타 혜택:
- 엑셀 형식 시장 예측(ME) 시트
- 3개월간의 애널리스트 지원
자주 묻는 질문
목차
제1장 서론
제2장 조사 방법
제3장 주요 요약
제4장 시장 구도
제5장 시장 규모와 성장 예측
제6장 경쟁 구도
제7장 시장 기회와 향후 전망
JHS 26.06.19According to Mordor Intelligence, the immersive analytics market size is expected to increase from USD 2.6 billion in 2025 to USD 3.48 billion in 2026 and reach USD 14.28 billion by 2031, growing at a CAGR of 32.63% over 2026-2031.
This report is Segmented by Component (Software, Hardware, and Services), Technology (Augmented Reality, and More), Deployment Model (Cloud, On-Premises, and More), Interaction Modality (Gesture-Based, and More), End-User Industry (Healthcare and Life Sciences, Manufacturing and Industrial, Retail and E-Commerce, and More), and Geography. The Market Forecasts are Provided in Terms of Value (USD).
Global Immersive Analytics Market Trends and Insights
Accelerating Enterprise Digital Twins Adoption
Near-real-time synchronization of physical assets with virtual replicas is turning digital twins into a live data substrate for immersive analytics. Manufacturers that combined IoT telemetry, simulation, and 3D visualization recorded median payback periods of 18 months, twice as fast as legacy dashboards. Platform launches such as ABB Genix deliver sub-2-second alerting latencies, so maintenance crews can overlay failure probabilities on equipment before downtime occurs. Government-backed initiatives, including Japan's Ouranos Ecosystem, are addressing cross-factory interoperability, enabling multinational deployments rather than isolated pilots. As a result, vendors that refine data-assimilation algorithms to fuse sparse sensors with physics models will stand out in the immersive analytics market.
Falling Unit Costs of XR Head-Mounted Displays
Enterprise-grade mixed-reality headsets now retail for a fraction of 2022 prices. Meta Quest 3 ships for under USD 500 yet rivals workstation-class visuals, and high-end options such as the Apple Vision Pro have proved that premium optics can still move one million units in one year. Display makers are reutilizing smartphone OLED fabs, pushing price declines faster than Moore's Law. Cost parity with rugged tablets means mid-market firms in retail, education, and construction can finally equip entire teams, unlocking volume orders that lift the immersive analytics market far beyond pilot scale.
Limited Availability of Authoring Talent
Spatial design, data engineering, and domain knowledge rarely coexist in one role, so enterprises struggle to convert 2D dashboards into immersive layouts. European Union programs such as XR2Learn aim to widen the pipeline, but will not graduate cohorts fast enough to meet demand. Even with no-code editors in Microsoft Mesh, firms still hire Unity or Unreal specialists for fine-tuning, creating project bottlenecks. Universities focus on bar charts and scatter plots, so retraining is essential. Until the talent pool deepens, hiring costs and lead times will slow rollouts and shave points off the growth of the immersive analytics market.
Other drivers and restraints analyzed in the detailed report include:
- Expansion of 5G and Edge Computing Infrastructure
- Integration of Generative AI for Real-Time Insights
- Hardware-Induced Motion Sickness and Fatigue
For complete list of drivers and restraints, kindly check the Table Of Contents.
Segment Analysis
Software accounted for 51.78% of the immersive analytics market in 2025 as subscription platforms integrated directly into enterprise data warehouses. Vendors released plug-ins that embed 3D canvases inside Tableau and Power BI so analysts avoid switching tools. Implementation projects often involve translating legacy SQL into spatial queries, which drive double-digit growth in service revenue. The immersive analytics services market is projected to grow briskly, with a 33.23% CAGR, as organizations need change management roadmaps, security hardening, and custom workflow logic. Hardware remains essential for optics, sensors, and compute, yet bring-your-own-headset policies dampen capital-expenditure growth and shift value to software ecosystems.
Ongoing middleware innovation also sustains the software lead. Unity's robotics connector synchronizes real-world telemetry with scene graphs at 99.99% accuracy, allowing factories to see updated digital twins without code refactoring. Immersion Analytics patented layered glow and translucency techniques that display half a dozen variables at once without information collapse. As low-code authoring templates become commonplace, the immersive analytics market will see software retention rates edge higher than hardware refresh cycles, reinforcing a subscription-centric revenue mix.
Augmented reality held 44.82% share in 2025 because line workers value hands-free overlays that superimpose manuals or quality metrics onto machinery. However, the immersive analytics market for mixed reality will expand faster, with a CAGR of 33.03%, as blending sensor feeds with 3D simulations enables predictive tasks, such as fusing thermal data with substation twins to spot transformer stress. Virtual-reality cocoons remain popular for training pilots or surgeons where external distractions hinder focus, but their isolation limits operational dashboards that require situational context.
Device roadmaps hint that modalities are converging rather than competing. Apple Vision Pro users pin analytics dashboards beside physical sticky notes, and Meta's focus on open Quest hardware lets third-party developers target any immersive scenario. Enterprises, therefore, demand cross-device synchronization, prompting vendors to architect cloud orchestration layers that hand off a session from VR headsets to AR glasses and back to 2D browsers without losing state. That interoperability will become table stakes for contenders in the immersive analytics market.
Geography Analysis
North America generated 35.62% of 2025 revenue, backed by federal appropriations that embed digital twins into transportation safety studies and defense testbeds. A bipartisan Leadership in Immersive Technology Act elevates the technology to national-competitiveness status, unlocking grants and coordination across agencies. Canadian miners and foresters rely on immersive subsurface models to safely staff remote operations, while Mexico's automotive clusters integrate spatial quality dashboards directly into line-side SAP systems. Enterprise buyers also benefit from dense 5G rollouts and hyperscale cloud nodes that host low-latency rendering farms.
Asia-Pacific is forecast to be the fastest-growing region, with a 33.74% CAGR through 2031. Japan's PLATEAU project already offers 3D city models for 236 municipalities and aims for 500 by 2027, a public data asset that fuels urban disaster simulations and infrastructure planning. China's Shanghai twin maps waste collection and e-bike charging while feeding epidemiological analyses, proving out city-scale use cases. India's Jio True5G blanket now covers 5,500 cities, enabling immersive field-service overlays in far-flung substations. South Korea and Australia invest in smart factories and mining twins, rounding out regional momentum.
Europe held a mid-tier share in 2025, yet policy tailwinds portend acceleration. The European Partnership for Virtual Worlds commits EUR 200 million (USD 226 million) in joint funding, and the Digital Europe Test Beds funnel EUR 17 million (USD 19.2 million) into cross-border sandboxes. These programs mandate open-standard APIs, encouraging vendor neutrality and boosting buyer confidence. Pilots such as the x-CITE CitiVerse in Belgium, Finland, and the Netherlands let citizens visualize zoning proposals in 3D, widening public familiarity. South America, the Middle East, and Africa trail in absolute spend but leverage sovereign-wealth funds and commodity-sector use cases, oil, gas, and mining, to finance lighthouse projects that can scale regionally.
- Microsoft Corporation
- NVIDIA Corporation
- Unity Software Inc.
- Magic Leap, Inc.
- PTC Inc.
- Alphabet Inc. (Google)
- Apple Inc.
- Meta Platforms, Inc.
- Siemens AG
- Dassault Systemes SE
- Varjo Technologies Oy
- HTC Corporation
- Qualcomm Technologies, Inc.
- Lenovo Group Limited
- Amazon Web Services, Inc.
- Autodesk, Inc.
- Ultraleap Ltd.
- Ultrahaptics IP Two Limited
- CrunchFish AB
- Tobii AB
Additional Benefits:
- The market estimate (ME) sheet in Excel format
- 3 months of analyst support
TABLE OF CONTENTS
1 INTRODUCTION
- 1.1 Study Assumptions and Market Definition
- 1.2 Scope of the Study
2 RESEARCH METHODOLOGY
3 EXECUTIVE SUMMARY
4 MARKET LANDSCAPE
- 4.1 Market Overview
- 4.2 Market Drivers
- 4.2.1 Accelerating Enterprise Digital Twins Adoption
- 4.2.2 Falling Unit Costs of XR Head-Mounted Displays
- 4.2.3 Expansion of 5G and Edge Computing Infrastructure
- 4.2.4 Integration of Generative AI for Real-Time Insights
- 4.2.5 Open-Source Spatial Analytics Frameworks Maturing
- 4.2.6 Rise of Analytics as a Feature in Industrial IoT Platforms
- 4.3 Market Restraints
- 4.3.1 Limited Availability of Authoring Talent
- 4.3.2 Hardware-Induced Motion Sickness and Fatigue
- 4.3.3 Immature Enterprise Security Standards for XR Data
- 4.3.4 High Customization Costs for Domain-Specific Workflows
- 4.4 Impact of Macroeconomic Factors on the Market
- 4.5 Industry Value Chain Analysis
- 4.6 Regulatory Landscape
- 4.7 Technological Outlook
- 4.8 Porter's Five Forces Analysis
- 4.8.1 Bargaining Power of Suppliers
- 4.8.2 Bargaining Power of Buyers
- 4.8.3 Threat of New Entrants
- 4.8.4 Threat of Substitutes
- 4.8.5 Intensity of Competitive Rivalry
5 MARKET SIZE AND GROWTH FORECASTS (VALUE)
- 5.1 By Component
- 5.1.1 Software
- 5.1.2 Hardware
- 5.1.3 Services
- 5.2 By Technology
- 5.2.1 Augmented Reality (AR)
- 5.2.2 Virtual Reality (VR)
- 5.2.3 Mixed Reality (MR)
- 5.2.4 3D Desktop / Spatial-Computing Displays
- 5.3 By Deployment Model
- 5.3.1 Cloud
- 5.3.2 On-Premises
- 5.3.3 Edge / On-Device
- 5.4 By Interaction Modality
- 5.4.1 Gesture-Based
- 5.4.2 Voice / NLP
- 5.4.3 Eye-Tracking
- 5.4.4 Haptic / Force-Feedback
- 5.4.5 Multimodal Fusion
- 5.5 By End-User Industry
- 5.5.1 Healthcare and Life Sciences
- 5.5.2 Manufacturing and Industrial
- 5.5.3 Retail and e-Commerce
- 5.5.4 Energy and Utilities
- 5.5.5 Education and Research
- 5.5.6 Media, Entertainment and Sports
- 5.5.7 Defense and Aerospace
- 5.5.8 Financial Services
- 5.6 By Geography
- 5.6.1 North America
- 5.6.1.1 United States
- 5.6.1.2 Canada
- 5.6.1.3 Mexico
- 5.6.2 South America
- 5.6.2.1 Brazil
- 5.6.2.2 Argentina
- 5.6.2.3 Rest of South America
- 5.6.3 Europe
- 5.6.3.1 United Kingdom
- 5.6.3.2 Germany
- 5.6.3.3 France
- 5.6.3.4 Italy
- 5.6.3.5 Rest of Europe
- 5.6.4 Asia-Pacific
- 5.6.4.1 China
- 5.6.4.2 Japan
- 5.6.4.3 India
- 5.6.4.4 South Korea
- 5.6.4.5 Rest of Asia-Pacific
- 5.6.5 Middle East and Africa
- 5.6.5.1 Middle East
- 5.6.5.1.1 United Arab Emirates
- 5.6.5.1.2 Saudi Arabia
- 5.6.5.1.3 Rest of Middle East
- 5.6.5.2 Africa
- 5.6.5.2.1 South Africa
- 5.6.5.2.2 Egypt
- 5.6.5.2.3 Rest of Africa
- 5.6.5.1 Middle East
- 5.6.1 North America
6 COMPETITIVE LANDSCAPE
- 6.1 Market Concentration
- 6.2 Strategic Moves
- 6.3 Market Share Analysis
- 6.4 Company Profiles (includes Global Level Overview, Market Level Overview, Core Segments, Financials as available, Strategic Information, Market Rank/Share, Products and Services, Recent Developments)
- 6.4.1 Microsoft Corporation
- 6.4.2 NVIDIA Corporation
- 6.4.3 Unity Software Inc.
- 6.4.4 Magic Leap, Inc.
- 6.4.5 PTC Inc.
- 6.4.6 Alphabet Inc. (Google)
- 6.4.7 Apple Inc.
- 6.4.8 Meta Platforms, Inc.
- 6.4.9 Siemens AG
- 6.4.10 Dassault Systemes SE
- 6.4.11 Varjo Technologies Oy
- 6.4.12 HTC Corporation
- 6.4.13 Qualcomm Technologies, Inc.
- 6.4.14 Lenovo Group Limited
- 6.4.15 Amazon Web Services, Inc.
- 6.4.16 Autodesk, Inc.
- 6.4.17 Ultraleap Ltd.
- 6.4.18 Ultrahaptics IP Two Limited
- 6.4.19 CrunchFish AB
- 6.4.20 Tobii AB
7 MARKET OPPORTUNITIES AND FUTURE OUTLOOK
- 7.1 White-Space and Unmet-Need Assessment