
|
시장보고서
상품코드
2062103
세정 규사 : 시장 점유율 분석, 업계 동향 및 통계, 성장 예측(2026-2031년)Washed Silica Sand - Market Share Analysis, Industry Trends & Statistics, Growth Forecasts (2026 - 2031) |
||||||
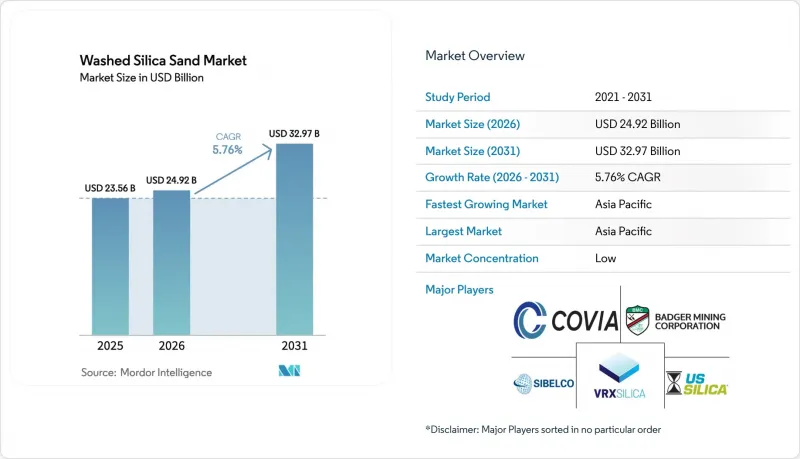
Mordor Intelligence에 의하면, 세정 규사 시장 규모는 2025년 235억 6,000만 달러로 평가되었습니다. 2026년 249억 2,000만 달러로 확대되어 2026-2031년에 걸쳐 CAGR은 5.76%를 나타내, 2031년까지 329억 7,000만 달러에 이를 것으로 예측됩니다.

본 보고서는 순도(표준 고순도(99-99.95%), 산업용 순도(95-99%), 기타), 입자 크기(극대립(1mm 초과), 기타), 용도(유리 제조, 주조·금속 주조, 기타), 지역(아시아태평양, 북미, 유럽, 남미, 중동 및 아프리카)에 따라 분류되어 있습니다. 시장 전망은 금액(달러) 기준으로 제시되어 있습니다.
세계의 세정 규사 시장 동향 및 분석
반도체 팹에서의 초고순도 석영에 대한 수요
스프루스 파인에서는 2025년에 완료된 2억 달러 규모의 확장 공사와 2027년에 예정된 5억 달러 규모의 2단계 공사를 통해 HPQ 생산량이 두 배로 증가했으나, 애널리스트들은 반도체 팹 및 태양전지 잉곳 제조업체들이 순도 사양을 99.9999%(5나인) 이상으로 높임에 따라, 2050년까지 수요가 40배 증가할 것으로 여전히 예측했습니다. 2025년, 전 세계 금속 실리콘의 85%, 폴리실리콘의 95%를 중국이 차지하고 있다는 사실은 OECD 국가들공급 리스크를 더욱 부각시키고 있습니다. 2024년 허리케인 헬렌으로 인한 공급 차질은 단일 공급원에 대한 의존이 초래하는 취약성을 여실히 드러냈으며, 이를 계기로 EU와 미국은 3년 이내에 노르웨이와 포르투갈의 석영 광산을 가동시키겠다는 전략을 추진하게 되었습니다. 2025년부터 건설이 진행되고 있는 Sinova Global의 테네시주 금속 실리콘 공장은 북미 공급원의 다각화를 위한 로드맵을 제시하고 있습니다. 이러한 움직임들이 맞물리면서, 반도체용 석영은 세정 규사 시장의 장기적인 수요를 지탱하는 핵심 요소로 자리매김할 것입니다.
아시아태평양의 플로트 유리 용해로 확대
2025년 12월 기준, 중국 본토의 일일 용해 능력은 가동 중인 216개 생산라인에서 15만 4,555톤에 달했으나, 부동산 시장의 침체로 인해 가동률은 78% 미만으로 떨어졌습니다. 공업정보화부는 현재 신규 생산라인에 대해 1.25 : 1의 갱신 비율을 의무화하고 있으며, BIPV(건축일체형 태양광 발전) 및 자동차용 유리 생산을 위한 저철분 용광로에 대한 투자를 유도하고 있습니다. 호주 퀸즐랜드주에서 진행 중인 12억 호주 달러 규모의 GlassKote 프로젝트는 2026년 초에 일일 700톤의 생산 능력을 추가했으며, 한편 일일 1,000톤 규모의 자매 공장은 2026년 중반까지 아랍에미리트에서 가동을 시작했습니다. 이러한 프로젝트를 통해 Fe₂O₃ 함량이 0.03 중량% 이하인 실리카에 대한 지속적인 구매 계약이 체결되었습니다. 인도 및 아세안 기업들도 마찬가지로, 국내 설치 목표를 달성하기 위해 태양광 유리 생산 능력을 확대하고 있으며, 세정 규사 시장에서 해당 지역의 주도적 입지를 강화하고 있습니다.
다중 운송 수단 비용의 급등
아틀라스 에너지 솔루션즈의 실세 가격은 2025년에 톤당 21달러까지 하락하여, 2024년 대비 17% 떨어졌습니다. 이는 출하량이 9% 증가했음에도 불구하고 발생한 것으로, 운임이 이익률을 압박하고 있음을 여실히 보여주고 있습니다. 2026년의 혹독한 겨울 폭풍으로 인해 철도 운송이 마비되면서 EBITDA가 600만 달러 감소한 것은 계절적 위험에 대한 노출을 여실히 보여줍니다. 해상 운송 측면에서는 2026년 1분기까지 연료비 급등으로 인해 벌크선 용선료가 전년 대비 28% 상승하면서 장거리 수출의 경쟁력이 약화되었습니다. 운송 거리가 100km를 초과할 경우 FOB 가격의 2배에 달할 가능성이 있으므로, 구매자는 가능한 한 현지 조달을 하도록 권장받고 있습니다. 자본 집약적인 컨베이어 벨트나 현장의 습식 플랜트는 이러한 가격 변동 위험을 헤지해 주지만, 중견 생산자들 시장 진입 장벽을 높이고 있습니다.
부문별 분석
초고순도(SiO₂ 99.99% 이상)의 생산량은 여전히 적지만, 반도체용 폴리실리콘 및 석영 도가니 제조업체들이 총 금속 불순물 50ppm 이하의 기준을 요구하고 있기 때문에 전략적으로 중요한 위치를 차지하고 있습니다. 표준 고순도(SiO₂ 99-99.95%)는 2025년에 39.12%의 시장 점유율을 유지하며, 플로트 유리 및 파운드리 고객에게 공급되고 있으며, 예측 기간(2026-2031년) 동안 연평균 성장률(CAGR) 6.11%를 나타낼 것으로 전망됩니다. 시벨코(Sibelco)의 스프루스 파인(Spruce Pine) 복합 시설은 2025년에 HPQ(고순도 석영) 생산 능력을 두 배로 늘리고, 2027년까지 다시 두 배로 늘릴 예정이지만, 단일 거점에 대한 의존 위험은 여전히 두드러지며, 노르웨이의 에브예-이벨란드(Evje-Iveland) 페그마타이트 지대 등 유럽 내 공급원의 다각화를 요구하는 목소리가 높아지고 있습니다. 시노바 세계(Sinova Global)이 재가동한 채석장과 테네시주의 제련소는 2028년까지 국내 버퍼 생산 능력을 확대될 전망입니다.
고도 정제 기술, 염소 소성, 자기 분리, 플라즈마 아크 처리와 같은 기술로 인해 증산에 필요한 자본 비용은 톤당 400달러를 초과하여 시장 진입 장벽이 높아지고 있습니다. 따라서 허리케인으로 인한 혼란이나 지정학적 충격은 이 가격대에서 특히 큰 가격 탄력성을 초래하고 있습니다. 상위 3개 HPQ 공급업체가 장악하고 있는 세정 규사 시장 점유율은 2031년까지 75% 이상을 유지할 것으로 예상되며, 이는 밸류체인 내 이 부문에서 나타나는 과점적 역학을 여실히 보여주고 있습니다.
지역별 분석
아시아태평양은 2025년에 전 세계 매출의 46.78%를 차지했으며, 2031년까지 연평균 성장률(CAGR) 6.09%를 나타낼 것으로 전망됩니다. 중국의 일일 15만 4,555톤에 달하는 플로트 유리 생산 능력, 인도의 대규모 인프라 프로젝트, 아세안(ASEAN)의 태양광 발전 공급망이 수요의 기반을 형성하고 있지만, 중국 공업정보화부(MIIT)가 시행한 더욱 엄격한 설비 갱신 규정에 따라 투기적인 건설은 억제되고 있습니다. 아랍에미리트(UAE)의 일일 생산량 1,000톤 규모의 저철분 플로트 유리 공장은 2026년 중반부터 걸프 지역의 소비를 주도할 것입니다. 일본과 한국은 국내에 HPQ(고순도 석영) 공급원이 없기 때문에 미국과 향후 EU공급에 의존하고 있어, 반도체용 석영 조달에 지리적 복잡성을 더하고 있습니다.
북미는 퍼미안 분지에서의 수압 파쇄(프래킹)에 힘입어 여전히 2위의 생산지로 자리 잡고 있습니다. 아틀라스 에너지 솔루션즈(Atlas Energy Solutions) 한 회사만 해도 2025년에 2,160만 톤을 운송했으나, 물류 경쟁 심화와 시추 장비 수 감소의 영향으로 가격은 전년 대비 17% 하락했습니다. 시벨코사의 스프루스-파인 광산이 HPQ 수출 시장을 주도하고 있지만, MSHA(광산 안전 보건국)가 정한 2026년 4월의 규정 준수 기한으로 인해 소규모 광산의 비용이 증가하면서 산업 재편이 진행되고 있습니다.
유럽에서는 칼렛(재활용 유리)의 비중이 높아 버진 모래 수요가 제한되고 있어, 성장세가 완만합니다. 그러나 핀란드의 모래 배터리 시범 사업은 2027년 이후 북유럽 수요를 끌어올릴 가능성이 있는 신흥 에너지 저장 시장을 부각시키고 있습니다. 콰르츠베르케(Quartzwerke)사가 독일 거점에서 추진 중인 태양광 발전 사업 확장은 제품의 탄소 발자국을 25% 줄여주어, 자동차 산업 및 친환경 건축 분야의 구매자들에게 매력적인 선택지입니다.
중동 및 아프리카에서는 해수 담수화에 따른 여과용 모래 수요가 견조한 데다, 파이프라인 건설 수요도 더해지고 있습니다. 남미 시장은 여전히 세분화되어 있으며, 고순도 등급의 경우 수입에 의존하고 있지만, 건설용 골재 수요는 안정적입니다.
기타 혜택
- 엑셀 형식 시장 예측(ME) 시트
- 3개월간의 애널리스트 지원
자주 묻는 질문
목차
제1장 서론
제2장 조사 방법
제3장 주요 요약
제4장 시장 구도
제5장 시장 규모 및 성장 예측
제6장 경쟁 구도
제7장 시장 기회 및 향후 전망
KTH 26.06.22According to Mordor Intelligence, the washed silica sand market size is expected to grow from USD 23.56 billion in 2025 to USD 24.92 billion in 2026 and is forecast to reach USD 32.97 billion by 2031 at 5.76% CAGR over 2026-2031.
This report is Segmented by Purity (Standard High Purity (99-99. 95%), Industrial Purity (95-99%), and More), Particle Size (Very Coarse (Greater Than 1 Mm), and More), Application (Glass Manufacturing, Foundry and Metal Casting, and More), and Geography (Asia-Pacific, North America, Europe, South America, and Middle East and Africa). The Market Forecasts are Provided in Terms of Value (USD).
Global Washed Silica Sand Market Trends and Insights
Semiconductor Fabs' Ultra-Pure Quartz Appetite
HPQ output doubled at Spruce Pine following a USD 200 million expansion completed in 2025 and a USD 500 million second phase due for 2027, yet analysts still expect a 40-fold increase in demand by 2050 as chip fabs and solar ingot pullers escalate purity specifications to five-nines and beyond. China's 85% share of global silicon metal and 95% dominance in polysilicon in 2025 accentuates OECD supply risk. Hurricane Helene's 2024 disruption highlighted single-source vulnerability, spurring EU and US strategies to bring Norwegian and Portuguese quartz deposits online within three years. Sinova Global's Tennessee silicon metal plant, under construction since 2025, provides a North American diversification pathway. Collectively, these moves keep semiconductor-grade quartz at the core of long-run demand for the washed silica sand market.
Asia-Pacific Float-Glass Furnace Expansions
Daily melt capacity in mainland China stood at 154,555 t in December 2025 across 216 operating lines, despite utilization sliding below 78% because of real-estate weakness. The Ministry of Industry and Information Technology now enforces a 1.25:1 replacement ratio on new lines, steering investment toward low-iron furnaces for BIPV and automotive glazing. Australia's AUD 1.2 billion GlassKote project in Queensland will add 700 tons/day in early 2026, while a 1,000 tons per day sister plant is scheduled for the UAE by mid-2026. These projects create sustained off-take agreements for silica with Fe2O3 below 0.03 weight%. India and ASEAN players likewise scale solar glass capacity to meet domestic installation targets, reinforcing regional leadership in the washed silica sand market.
Multimodal Freight Inflation
Atlas Energy Solutions' realized price declined to USD 21/ton in 2025, down 17% from 2024, even as shipped volumes rose 9%, highlighting freight's drag on margins. Harsh 2026 winter storms cut EBITDA by USD 6 million because rail service stalled, underscoring seasonal exposure. On the ocean side, bulk charter rates rallied 28% year-on-year through Q1 2026 as bunker costs spiked, making long-haul exports less competitive. Delivered cost can double FOB prices once transport exceeds 100 km, incentivizing buyers to procure locally whenever possible. Capital-heavy conveyor belts and on-site wet-plants hedge this volatility but raise barriers to replication by mid-tier producers.
Other drivers and restraints analyzed in the detailed report include:
- Rise of In-Basin Wet-Sand Logistics
- Desalination Boom in Middle East & North America
- Cullet Substitution in Container Glass
For complete list of drivers and restraints, kindly check the Table Of Contents.
Segment Analysis
Ultra-high purity (greater than or equal to 99.99% SiO2) volumes remain small but strategic because semiconductor polysilicon and quartz crucible makers require impurity thresholds below 50 ppm total metallics. Standard high-purity (99-99.95% SiO2) retained 39.12% share in 2025, servicing float glass and foundry customers with 6.11% CAGR expected for the forecast period (2026-2031). Sibelco's Spruce Pine complex doubled HPQ capacity in 2025 and will again by 2027, yet single-site risk remains pronounced, reinforcing calls for diversified European sources such as Norway's Evje-Iveland pegmatite belt. Sinova Global's reopened quarry and Tennessee smelter add domestic buffer capacity by 2028.
Intensive purification technologies, chlorination roasting, magnetic separation, and plasma arc treatment, push capital needs beyond USD 400/ton for incremental capacity, raising entry hurdles. Hurricane disruptions and geopolitical shocks, therefore, exert outsized price elasticity within this bracket. The washed silica sand market share controlled by the top three HPQ suppliers is projected to hold above 75% through 2031, underscoring oligopolistic dynamics in this slice of the value chain.
Geography Analysis
Asia-Pacific captured 46.78% of global revenue in 2025 with 6.09% CAGR projected through 2031. China's 154,555 tons/day float-glass capacity, India's massive infrastructure projects, and ASEAN's solar supply chains anchor demand even as stricter MIIT replacement rules curb speculative builds. The UAE's 1,000 tons/day low-iron float plant catalyzes Gulf consumption starting mid-2026. Japan and South Korea, lacking domestic HPQ, depend on U.S. and future EU supplies, adding geographic complexity to semiconductor quartz sourcing.
North America remains the second-largest cluster, buoyed by Permian Basin hydraulic fracturing. Atlas Energy Solutions alone moved 21.6 million tons in 2025, yet pricing slid 17% year-on-year, reflecting competitive logistics and flagging rig counts. Sibelco's Spruce Pine dominates HPQ exports, but MSHA's April 2026 compliance deadlines raise costs for smaller mines, pushing consolidation.
Europe shows tempered growth as high cullet ratios limit virgin demand. Finland's sand-battery pilots, however, showcase emerging storage markets likely to lift northern European offtake from 2027 onward. Quarzwerke's PV expansion at German sites cuts product carbon footprint by 25%, appealing to automotive and green-building buyers.
The Middle East and Africa combine strong desalination-led filtration needs with pipeline construction. South America remains fragmented, reliant on imports for high-purity grades but steady in construction aggregates.
- Adwan Chemical Industries Co. Ltd. (ACIC)
- Australian Silica Quartz Group Ltd
- Badger Mining Corporation
- Cairominerals
- Covia Holdings LLC.
- EUROQUARZ GmbH
- JFE Mineral & Alloy Co. Ltd
- Mitsubishi Corporation (Cape Flattery Silica)
- Preferred Sands LLC
- Quarzwerke GmbH
- Sibelco
- Silica Services, LLC.
- Superior Silica Sands LLC
- TERENGGANU SILICA CONSORTIUM SDN. BHD
- U.S. Silica Holdings Inc.
- VRX Silica Limited
Additional Benefits:
- The market estimate (ME) sheet in Excel format
- 3 months of analyst support
TABLE OF CONTENTS
1 Introduction
- 1.1 Study Assumptions and Market Definition
- 1.2 Scope of the Study
2 Research Methodology
3 Executive Summary
4 Market Landscape
- 4.1 Market Overview
- 4.2 Market Drivers
- 4.2.1 Semiconductor fabs' ultra-pure quartz appetite
- 4.2.2 Asia-Pacific float-glass furnace expansions
- 4.2.3 Rise of in-basin wet-sand logistics (cost cuts)
- 4.2.4 Desalination boom in Middel-East and North America
- 4.2.5 Sand-battery thermal storage pilots
- 4.3 Market Restraints
- 4.3.1 Multimodal freight inflation (rail and bulk ships)
- 4.3.2 Cullet substitution in container glass
- 4.3.3 OSHA/MSHA crystalline-silica exposure capex
- 4.4 Value Chain Analysis
- 4.5 Porter's Five Forces Analysis
- 4.5.1 Threat of New Entrants
- 4.5.2 Bargaining Power of Buyers
- 4.5.3 Bargaining Power of Suppliers
- 4.5.4 Threat of Substitutes
- 4.5.5 Competitive Rivalry
5 Market Size and Growth Forecasts (Value)
- 5.1 By Purity
- 5.1.1 Standard High Purity (99-99.95%)
- 5.1.2 Ultra-High Purity (Greater than or equal to 99.99% SiO2)
- 5.1.3 PV-Grade High Purity (99.95-99.99%)
- 5.1.4 Industrial Purity (95-99%)
- 5.2 By Particle Size
- 5.2.1 Medium (355-710 µm)
- 5.2.2 Very Coarse (Greater than 1 mm)
- 5.2.3 Coarse (710-1000 µm)
- 5.2.4 Fine (150-355 µm)
- 5.2.5 Very Fine (Less than 150 µm)
- 5.3 By Application
- 5.3.1 Glass Manufacturing
- 5.3.2 Foundry and Metal Casting
- 5.3.3 Construction Materials
- 5.3.4 Water and Industrial Filtration
- 5.3.5 Oil, Gas and Proppants
- 5.3.6 Ceramics and Refractories
- 5.3.7 Electronics Encapsulation
- 5.4 By Geography
- 5.4.1 Asia-Pacific
- 5.4.1.1 China
- 5.4.1.2 Japan
- 5.4.1.3 India
- 5.4.1.4 South Korea
- 5.4.1.5 ASEAN Countries
- 5.4.1.6 Rest of Asia-Pacific
- 5.4.2 North America
- 5.4.2.1 United States
- 5.4.2.2 Canada
- 5.4.2.3 Mexico
- 5.4.3 Europe
- 5.4.3.1 Germany
- 5.4.3.2 United Kingdom
- 5.4.3.3 France
- 5.4.3.4 Italy
- 5.4.3.5 Spain
- 5.4.3.6 Russia
- 5.4.3.7 NORDIC Countries
- 5.4.3.8 Rest of Europe
- 5.4.4 South America
- 5.4.4.1 Brazil
- 5.4.4.2 Argentina
- 5.4.4.3 Rest of South America
- 5.4.5 Middle-East and Africa
- 5.4.5.1 Saudi Arabia
- 5.4.5.2 South Africa
- 5.4.5.3 Rest of Middle-East and Africa
- 5.4.1 Asia-Pacific
6 Competitive Landscape
- 6.1 Market Concentration
- 6.2 Strategic Initiatives
- 6.3 Market Share(%)/Ranking Analysis
- 6.4 Company Profiles (includes Global Overview, Market Overview, Core Segments, Financials, Strategic Information, Market Rank/Share, Products and Services, and Recent Developments)
- 6.4.1 Adwan Chemical Industries Co. Ltd. (ACIC)
- 6.4.2 Australian Silica Quartz Group Ltd
- 6.4.3 Badger Mining Corporation
- 6.4.4 Cairominerals
- 6.4.5 Covia Holdings LLC.
- 6.4.6 EUROQUARZ GmbH
- 6.4.7 JFE Mineral & Alloy Co. Ltd
- 6.4.8 Mitsubishi Corporation (Cape Flattery Silica)
- 6.4.9 Preferred Sands LLC
- 6.4.10 Quarzwerke GmbH
- 6.4.11 Sibelco
- 6.4.12 Silica Services, LLC.
- 6.4.13 Superior Silica Sands LLC
- 6.4.14 TERENGGANU SILICA CONSORTIUM SDN. BHD
- 6.4.15 U.S. Silica Holdings Inc.
- 6.4.16 VRX Silica Limited
7 Market Opportunities and Future Outlook
- 7.1 White-Space and Unmet-Need Assessment
