|
시장보고서
상품코드
2062166
염화알루미늄 6수화물 시장 : 시장 점유율 분석, 산업 동향 및 통계 데이터, 성장 예측(2026-2031년)Aluminum Chloride Hexahydrate - Market Share Analysis, Industry Trends & Statistics, Growth Forecasts (2026 - 2031) |
||||||
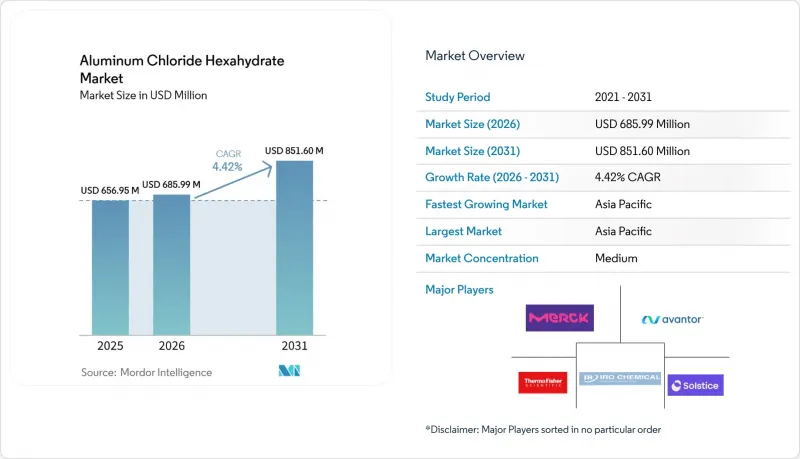
Mordor Intelligence에 의하면, 염화알루미늄 6수화물 시장 규모는 2025년에 6억 5,695만 달러로 평가되었습니다. 2026년에 6억 8,599만 달러로 확대되고, 2031년까지 8억 5,160만 달러에 이를 것으로 예측됩니다.
2026년부터 2031년까지 연평균 성장률(CAGR) 4.42%를 나타낼 것으로 전망됩니다.
본 보고서는 순도(99% 미만, 99%-99.5%, 99.5% 초과), 용도(수처리, 의약품 등), 최종 사용자 산업(화학, 의료 및 생명과학 등), 지역(아시아태평양, 북미, 유럽, 남미, 중동 및 아프리카)별로 분류되어 있습니다. 시장 전망은 금액(달러) 기준으로 제시되어 있습니다.
세계의 염화알루미늄 6수화물 시장 동향 및 분석
신흥 시장의 제약 클러스터에서 API 합성의 확대
서유럽 제약 기업들은 중간체 생산의 60-70%를 아시아로 이전하여 비용을 최대 50%까지 절감하고 있습니다. 이러한 비용 효율화 덕분에, FDA 및 EMA의 잔류물 기준을 준수하는 순도 99-99.5%의 촉매용 등급에 대한 수요가 견조한 추세를 보이고 있습니다. 구자라트주, 하이데라바드, 장쑤성, 저장성에서 신규 API 생산 능력 확충이 연평균 20-30%의 속도로 진행되고 있습니다. 그러나 중국과 인도에서 배출 규제가 강화됨에 따라, 철계나 아연계 대체품보다는 알루미늄계 촉매가 선호되는 추세입니다.
바이오매스에서 화학물질로의 전환 경로에서 루이스산 촉매의 규모 확대
파일럿 규모의 바이오리파이너리에서는 옥수수 줄기와 잎, 바가스에서 5-HMF 및 레브린산으로의 전환이 이루어지고 있으며, 촉매로 염화알루미늄 6수화물의 사용이 증가하고 있습니다. 이는 무기산과 비교하여 보다 온화한 조건에서 리그닌의 에테르 결합을 절단할 수 있는 특성 때문입니다. 이러한 공정의 경제적 실현 가능성은 이 고용해성 촉매의 회수에 달려 있습니다. 현재의 막 시스템에서는 제품 1kg당 0.15-0.25달러의 추가 비용이 발생하고 있습니다. 그 결과, 2028년 이후 유럽에서 통합형 폐쇄 루프 프로젝트가 성숙기에 접어들면서, 보다 광범위한 도입이 진행될 것으로 예측됩니다.
벌크 응집 과정에서 명반 및 폴리염화알루미늄의 대체
PAC는 알루미늄 투여량을 절반으로 줄이면서도 COD/BOD 수치를 60-80% 저감합니다. 이를 통해 EU 지침 2020/2184에서 정한 잔류 알루미늄 상한치인 200µg/L을 준수하면서도, 수도 유틸리티자의 경우 1m³당 0.02-0.04달러의 비용 절감 효과를 얻을 수 있습니다. 마찬가지로, 중국의 GB 15892-2020도 PAC의 적용을 지지하고 있습니다. 현재 PAC의 가격은 톤당 180-220달러이지만, 6수화물은 250-300달러로, 이것이 상품 수요에 영향을 미치고 있습니다.
부문별 분석
2025년에는 API, 섬유, 수처리 분야의 안정적인 수요에 힘입어 순도 99-99.5% 제품이 매출의 53.11%를 차지했습니다. 중국과 인도의 규모의 경제 효과로 인해, 염화알루미늄 6수화물의 가격은 1.20-1.50 달러/kg 범위에서 형성되고 있습니다. 99.5%를 초과하는 초고순도 부문은 심공융 전지에서의 용도 확대와 EU의 REACH 규정에 따른 촉매 요건 충족에 힘입어 연평균 성장률(CAGR) 4.87%를 나타낼 것으로 전망됩니다. 여러 생산자들은 수익성이 높은 틈새 시장에 집중하기 위해 1kg당 0.30-0.50달러의 추가 비용을 들여 등급별 결정화 장비를 도입하여 중급 등급 제품의 품질 향상을 도모하고 있습니다. 순도 99% 미만의 부문은 남아시아 지방자치단체의 입찰에서 PAC로의 대체가 진행되고 있기 때문에 현재는 전체 물량의 불과 12-15%에 불과합니다.
규제 요건의 강화가 이 부문의 동향을 좌우하고 있습니다. EU와 중국이 정한 비소 함유량 상한선(1 ppm 미만)으로 인해 저품위 로트의 수익성이 저하되면서, 생산 능력 확충이나 시장 철수가 촉진되고 있습니다.
지역별 분석
2025년 매출의 47.78%를 차지한 아시아태평양은 2031년까지 연평균 성장률(CAGR) 5.76%를 나타낼 것으로 전망됩니다. 중국에서는 수직 통합을 통해 kg당 1.10-1.40달러의 원가를 실현하고 있지만, 배출 규제가 강화됨에 따라 소규모 공장의 폐쇄가 진행되고 있으며, 그 결과 평균 순도가 높아지고 있습니다. 인도에서는 구자라트 주와 하이데라바드 회랑 지역에서 국내 수요 증가를 배경으로 API 생산 능력이 연간 20-30%의 속도로 확대되고 있습니다. 2026년에 가동을 시작한 베트남의 3만 톤 규모 PAC 복합 시설은 응집제 지출의 일부를 이 시설로 전환하는 동시에, PAC의 주요 원료인 육수화물에 대한 해당 지역 수요를 증가시킬 것으로 예측됩니다.
북미에서는 CMO의 국내 복귀와 EPA의 그린 케미스트리 장려 정책이 고순도 제품 수요를 견인하고 있지만, PAC로의 전환으로 인해 수처리용 제품의 생산량은 안정화되고 있습니다. USMCA의 혜택을 받고 있는 멕시코에서는 자동차용 도료 및 포장용 등급에 중점을 두고 생산 능력을 점진적으로 확대되고 있습니다. 유럽에서는 REACH 기준에 따라 순도 99.5% 이상의 규격 채택이 장려되고 있습니다. 머크사가 생명과학 분야에 30억 유로를 투자하고 있다는 사실은 규제 대상인 틈새 시장에 주력하고 있음을 반영합니다. 그러나 남유럽 지방자치단체의 입찰 활동은 PAC의 대체로 인해 감소 추세를 보이고 있습니다.
남미 및 중동 및 아프리카에서는 브라질의 펄프·제지 부문과 걸프 연안 국가들의 물 부족 대책 노력이 성장을 뒷받침하고 있습니다. 그러나 환율 변동과 물류상의 문제가 성장 속도를 제한하고 있습니다.
기타 혜택 :
- 엑셀 형식 시장 예측(ME) 시트
- 3개월간의 애널리스트 지원
자주 묻는 질문
목차
제1장 서론
제2장 분석 방법
제3장 주요 요약
제4장 시장 구도
제5장 시장 규모 및 성장률 예측
제6장 경쟁 구도
제7장 시장 기회 및 향후 전망
KTH 26.06.24According to Mordor Intelligence, the aluminum chloride hexahydrate market size is projected to be USD 656.95 million in 2025, USD 685.99 million in 2026, and reach USD 851.60 million by 2031, growing at a CAGR of 4.42% from 2026 to 2031.

This report is Segmented by Purity (Less Than 99%, Between 99% To 99. 5%, Greater Than 99. 5%), Application (Water Treatment, Pharmaceuticals, and More), End-User Industry (Chemical, Healthcare and Life-Sciences, and More), and Geography (Asia-Pacific, North America, Europe, South America, Middle East and Africa). The Market Forecasts are Provided in Terms of Value (USD).
Global Aluminum Chloride Hexahydrate Market Trends and Insights
Expanding API Synthesis in Emerging-Market Pharmaceutical Clusters
Western drugmakers have relocated 60-70% of their intermediate production to Asia, reducing costs by up to 50%. This cost efficiency has resulted in a steady demand for catalytic grades with purity levels of 99-99.5% that adhere to FDA and EMA residue limits. The addition of new API capacities in Gujarat, Hyderabad, Jiangsu, and Zhejiang is increasing at an annual rate of 20-30%. However, stricter discharge regulations in China and India are influencing the preference for aluminum catalysts instead of ferric or zinc alternatives.
Scale-Up of Lewis-Acid Catalysis for Biomass-to-Chemicals Routes
Pilot biorefineries are converting corn stover and bagasse into 5-HMF and levulinic acid, with aluminum chloride hexahydrate being increasingly selected as a catalyst. This is driven by its ability to cleave lignin ether bonds under milder conditions compared to mineral acids. The economic feasibility of these processes depends on the recovery of this highly soluble catalyst. Current membrane systems contribute an additional cost of USD 0.15-0.25 per kg of product. Consequently, broader adoption is expected to follow the maturation of integrated, closed-loop projects in Europe after 2028.
Substitution by Alum and Polyaluminum Chloride in Bulk Coagulation
PAC reduces COD/BOD levels by 60-80% with half the aluminum dose. This results in cost savings for utilities of USD 0.02-0.04 per m3 while complying with the EU Directive 2020/2184's residual-Al cap of 200 µg/L. Similarly, China's GB 15892-2020 supports PAC's application. Currently, PAC is priced at USD 180-220 per MT, compared to USD 250-300 for hexahydrate, which impacts commodity demand.
Other drivers and restraints analyzed in the detailed report include:
- Commercialization of AlCl3-Based Deep-Eutectic Electrolytes for Next-Gen Batteries
- Growth of Precision Additive-Manufacturing Feedstocks
- Tight Anhydrous AlCl3 Supply Chains Causing Price Volatility
For complete list of drivers and restraints, kindly check the Table Of Contents.
Segment Analysis
In 2025, the 99-99.5 % purity segment accounted for 53.11 % of the revenue, driven by consistent demand in API, textiles, and water treatment. Economies of scale in China and India have supported pricing within the range of USD 1.20-1.50 /kg for aluminum chloride hexahydrate. The greater than 99.5 % ultra-high-purity segment is projected to grow at a 4.87 % CAGR, supported by increasing applications in deep-eutectic batteries and compliance with EU REACH catalyst mandates. Several producers have adopted fractional-crystallization units to enhance mid-grade stock at an additional cost of USD 0.30-0.50 /kg, focusing on higher-margin niches. The <99 % purity segment now represents only 12-15 % of the total volume, as PAC continues to replace it in southern-Asia municipal tenders.
Stricter regulatory requirements are shaping this segmental dynamic. Arsenic limits set by the EU and China, capped at <1 ppm, have reduced the viability of low-grade lots, prompting capacity upgrades or market exits.
Geography Analysis
Asia-Pacific, which accounts for 47.78% of 2025 sales, is projected to grow at a 5.76% CAGR through 2031. In China, vertical integration achieves costs of USD 1.10-1.40/kg, but stricter discharge regulations are leading to the closure of smaller plants, resulting in higher purity averages. In India, the Gujarat and Hyderabad corridors are increasing API capacity by 20-30% annually, driven by rising local demand. Vietnam's 30,000-ton PAC complex, expected to become operational in 2026, is anticipated to shift some coagulation expenditures while increasing the region's demand for high-grade hexahydrate, a key PAC feedstock catalyst.
In North America, the reshoring of CMOs and EPA's green-chemistry incentives are driving demand for high-purity products, although water-treatment volumes are stabilizing due to the PAC shift. Mexico, benefiting from the USMCA, is gradually expanding its capacity with a focus on automotive paints and packaging grades. In Europe, REACH criteria are encouraging the adoption of>99.5% purity standards. Merck's EUR 3 billion investment in life sciences reflects the focus on regulated niches. However, southern Europe's municipal tenders are experiencing reduced activity due to PAC substitutions.
In South America and the Middle East-Africa, growth is supported by Brazil's pulp-and-paper sector and water-scarcity initiatives in the Gulf. Nevertheless, currency fluctuations and logistical challenges are limiting the pace of growth.
- Alpha Chemika
- Avantor, Inc.
- GFS Chemicals Inc
- Solstice Advanced Materials Inc.
- IRO GROUP INC
- Jinan Haohua Industry
- Merck KGaA
- Otto Chemie Pvt. Ltd.
- Sisco Research Laboratories Pvt. Ltd.
- Spectrum Chemical
- Strem Chemicals
- Thermo Fisher Scientific Inc.
- Tianjin Kaifeng
- YIXING BLUWAT CHEMICALS CO., LTD.
Additional Benefits:
- The market estimate (ME) sheet in Excel format
- 3 months of analyst support
TABLE OF CONTENTS
1 Introduction
- 1.1 Study Assumptions and Market Definition
- 1.2 Scope of the Study
2 Research Methodology
3 Executive Summary
4 Market Landscape
- 4.1 Market Overview
- 4.2 Market Drivers
- 4.2.1 Expanding API synthesis in emerging-market pharmaceutical clusters
- 4.2.2 Scale-up of Lewis-acid catalysis for biomass-to-chemicals routes
- 4.2.3 Commercialization of AlCl3-based deep-eutectic electrolytes for next-gen batteries
- 4.2.4 Growth of precision additive-manufacturing feedstocks
- 4.2.5 Mandates for high-purity catalysts in green fine-chemicals production
- 4.3 Market Restraints
- 4.3.1 Substitution by alum and poly-aluminum chloride in bulk coagulation
- 4.3.2 Tight anhydrous AlCl3 supply chains causing price volatility
- 4.3.3 Shift toward "aluminum-free" consumer-care formulations
- 4.4 Value Chain Analysis
- 4.5 Porter's Five Forces
- 4.5.1 Bargaining Power of Suppliers
- 4.5.2 Bargaining Power of Buyers
- 4.5.3 Threat of New Entrants
- 4.5.4 Threat of Substitutes
- 4.5.5 Competitive Rivalry
5 Market Size and Growth Forecasts (Value)
- 5.1 By Purity
- 5.1.1 Less than 99 %
- 5.1.2 Between 99 % to 99.5 %
- 5.1.3 Greater than 99.5 %
- 5.2 By Application
- 5.2.1 Water Treatment
- 5.2.2 Pharmaceuticals
- 5.2.3 Cosmetics and Antiperspirants
- 5.2.4 Dyes and Pigments
- 5.2.5 Catalyst and Chemical Synthesis
- 5.2.6 Others
- 5.3 By End-user Industry
- 5.3.1 Chemical
- 5.3.2 Healthcare and Life-sciences
- 5.3.3 Personal-care and Cosmetics
- 5.3.4 Textile
- 5.3.5 Pulp and Paper
- 5.3.6 Others
- 5.4 By Geography
- 5.4.1 Asia-Pacific
- 5.4.1.1 China
- 5.4.1.2 India
- 5.4.1.3 Japan
- 5.4.1.4 South Korea
- 5.4.1.5 ASEAN Countries
- 5.4.1.6 Rest of Asia-Pacific
- 5.4.2 North America
- 5.4.2.1 United States
- 5.4.2.2 Canada
- 5.4.2.3 Mexico
- 5.4.3 Europe
- 5.4.3.1 Germany
- 5.4.3.2 United Kingdom
- 5.4.3.3 France
- 5.4.3.4 Italy
- 5.4.3.5 Spain
- 5.4.3.6 Russia
- 5.4.3.7 Rest of Europe
- 5.4.4 South America
- 5.4.4.1 Brazil
- 5.4.4.2 Argentina
- 5.4.4.3 Rest of South America
- 5.4.5 Middle-East and Africa
- 5.4.5.1 Saudi Arabia
- 5.4.5.2 South Africa
- 5.4.5.3 Rest of Middle-East and Africa
- 5.4.1 Asia-Pacific
6 Competitive Landscape
- 6.1 Market Concentration
- 6.2 Strategic Moves
- 6.3 Market Share(%)/Ranking Analysis
- 6.4 Company Profiles (includes Global Overview, Market Overview, Core Segments, Financials, Strategic Information, Products and Services, and Recent Developments)
- 6.4.1 Alpha Chemika
- 6.4.2 Avantor, Inc.
- 6.4.3 GFS Chemicals Inc
- 6.4.4 Solstice Advanced Materials Inc.
- 6.4.5 IRO GROUP INC
- 6.4.6 Jinan Haohua Industry
- 6.4.7 Merck KGaA
- 6.4.8 Otto Chemie Pvt. Ltd.
- 6.4.9 Sisco Research Laboratories Pvt. Ltd.
- 6.4.10 Spectrum Chemical
- 6.4.11 Strem Chemicals
- 6.4.12 Thermo Fisher Scientific Inc.
- 6.4.13 Tianjin Kaifeng
- 6.4.14 YIXING BLUWAT CHEMICALS CO., LTD.
7 Market Opportunities and Future Outlook
- 7.1 White-space and unmet-need assessment
