

|
시장보고서
상품코드
2062178
소음 모니터링 : 시장 점유율 분석, 업계 동향 및 통계, 성장 예측(2026-2031년)Noise Monitoring - Market Share Analysis, Industry Trends & Statistics, Growth Forecasts (2026 - 2031) |
||||||
 Mordor Intelligence
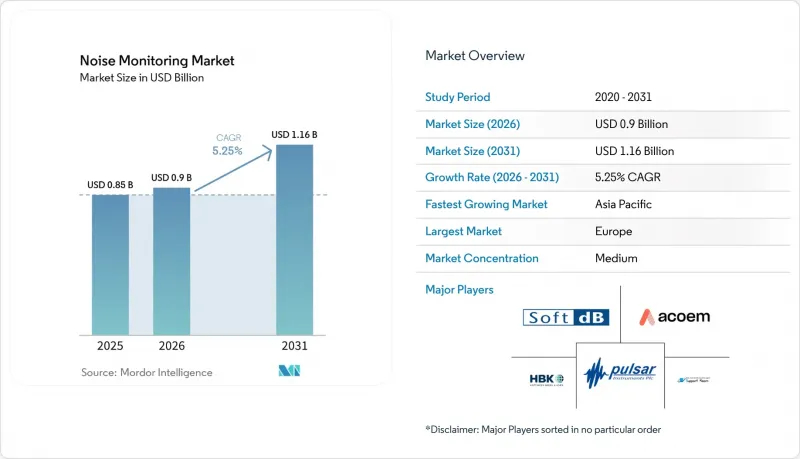
Mordor Intelligence에 의하면, 소음 모니터링 시장 규모는 2025년 8억 5,000만 달러로 평가되었습니다. 2026년 9억 달러에서 2031년까지 11억 6,000만 달러로 확대되어 2026-2031년에 걸쳐 CAGR은 5.25%를 나타낼 것으로 예측됩니다.
본 보고서는 구성 요소(하드웨어, 소프트웨어, 서비스), 제품 유형(고정형/상설형, 휴대형, 웨어러블형 선량계, 원격 키오스크, 기타), 기술(실시간, IoT 지원, 클라우드 기반 분석, AI를 활용한 예측 분석, 기타), 용도(건설, 산업, 기타), 지역별로 분류되어 있습니다. 시장 전망은 금액(달러) 기준으로 제시되어 있습니다.
세계의 소음 모니터링 시장 동향 및 인사이트
환경 소음 규제 강화
새로운 규제에 따라, 과거에는 선택 사항이었던 모니터링이 조달 요건으로 전환되고 있습니다. 아일랜드의 지침 초안에서는 CNOSSOS-EU 조사 기법, 최신 입력 데이터, 완화 대상 지역의 검증이 의무화되어 있으며, 이에 따라 고정밀 센서 및 모델링 도구에 대한 수요가 확대되고 있습니다. 미국에서는 연방도로청이 주 차원의 현황 조사 작성 및 ±3dB 이내의 모델 검증을 제안하고 있으며, 각 기관에 대해 승인된 소프트웨어로 데이터를 전송하는 연속적인 네트워크의 도입을 추진하고 있습니다. 뉴욕시의 2026년 자동 API 업로드 의무화 등 지방 자치 단체의 규정은 클라우드 연동형 기기의 도입을 더욱 가속화하고 있습니다. IEC 61672-1 및 EN ISO 3744 : 2010 인증을 취득한 공급업체는 공공 입찰에서 우대 조치를 받을 수 있습니다.
스마트 시티의 성장과 도시의 확장
소음 센서는 현재 교통, 대기질, 미기후 데이터도 추적하는 다중 매개변수 플랫폼에 통합되어 있습니다. 바르셀로나의 ‘TRAFFIC-NOISE’ 프로젝트는 음향 및 시각 분석을 연계하여 교통 체증을 실시간으로 관리하고 있으며, 지자체들이 개별 측정 기기가 아닌 통합 시스템을 도입하는 경향을 보이고 있습니다. 호주의 ‘OpenAIR’ 프로그램은 13개 지방 자치단체에 네트워크로 연결된 센서에 자금을 지원하고 있으며, 개방형 프로토콜을 채택함으로써 미래를 내다보는 조달을 실시했습니다. 조기 도입 기업들은 기존 도시 운영 시스템에 호환되며 즉시 사용할 수 있는 API와 대시보드 위젯을 제공하는 공급업체를 선호하고 있으며, 경쟁 구도를 소프트웨어의 개방화로 변화시키고 있습니다.
높은 초기 투자 비용과 유지 관리 비용
클래스 1 측정 기기, 교정 완료된 마이크, 보안이 강화된 클라우드 구독 서비스는 소규모 지자체의 예산을 압박합니다. 뉴욕시가 정한, 실외 사용에 적합하고 규정된 설치 높이를 충족하는 장비의 사양은 고성능 하드웨어와 정기적인 재교정이 수명 주기 비용을 증가시키는 실제 사례를 보여줍니다. 공급업체 측은 광업 부문의 플릿 기반 가격 책정 등, 설비 투자(Capex)를 운영 비용(OpEx)으로 전환하는 구독형 모델로 대응하고 있습니다. 그러나 신흥 시장에서는 여전히 정확도가 낮은 대안이 선택되는 경향이 있어, 정책 결정의 근거가 되는 데이터가 누락될 위험을 초래하고 있습니다.
부문별 분석
고객들이 턴키 방식의 규정 준수 대응 및 분석을 요구하는 가운데, 서비스 부문의 성장률이 하드웨어 부문을 앞지르고 있습니다. 2025년에는 소음 모니터링 시장에서 장비 판매가 주류를 이루었으나, 교정, 클라우드 대시보드, 전문가에 의한 데이터 분석과 같은 정기 계약의 성장률이 이를 상회할 것으로 예측되어, 서비스 전체 시장 점유율을 끌어올릴 전망입니다. Cirrus Research가 확장한 NoiseTools 제품군은 소프트웨어 업그레이드를 통해 기존 장치의 활용도를 높이고, 추가 판매 기회를 창출하는 좋은 사례입니다. 유럽의 환경청 등 정부 기관들은 데이터 처리 및 머신러닝 시범 사업에 전용 예산을 배정하고 있어, 전문 컨설팅 회사에 대한 수요를 뒷받침하고 있습니다.
서비스 제공업체는 장기 계약을 활용하여 하드웨어 임대, 원격 진단, 규격 준수 감사를 패키지로 묶어, 하드웨어 교체 주기가 수익에 미치는 영향을 완화하고 있습니다. 이러한 전환을 통해 공급업체의 인센티브와 고객의 성과가 일치하게 되어, 소음 모니터링 시장 전반에 걸쳐 더 높은 이익률과 견고한 관계가 뒷받침되고 있습니다.
도시 지역의 소음 지도 작성에는 여전히 유선 네트워크가 필수적이지만, 산업보건 프로그램에서는 웨어러블형 선량계가 점차 보급되고 있습니다. 항공기 정비, 광산 운반, 제조 현장 등에서 이동하며 작업하는 근로자에 대한 지속적인 노출 추적을 통해, 개인의 소음 노출량을 기록하는 클립형 센서의 도입이 가속화되고 있습니다. 뉴욕시 주택에서 50피트 이내에서 진행되는 프로젝트에 관한 규정 등, 건설 현장 규제가 강화됨에 따라 내후성 마이크가 장착된 견고한 고정형 스테이션이 여전히 선호되고 있습니다.
웨어러블 기기는 개별 피폭 한도 준수를 확인하고, 작업자에게 진동 및 소리 피드백을 실시간으로 제공함으로써 이러한 네트워크를 보완합니다. 블루투스 연결과 클라우드 동기화를 통합하는 업체들은 웨어러블 기기를 기업 안전 플랫폼의 확장 기능으로 자리매김하고, 지역 모니터와의 데이터 연동을 원활하게 하여, 대상인 소음 모니터링 시장의 확대를 도모하고 있습니다.
지역별 분석
유럽은 ‘환경 소음 지침’에 따른 5년 주기의 보고 체계와, 도시들에게 소음 지도 및 공공 행동 계획의 갱신을 의무화하는 표준화된 CNOSSOS-EU 조사 기법을 통해 전 세계 매출을 뒷받침하고 있습니다. 이탈리아의 고속도로 소음 저감 프로그램이나 스코틀랜드의 조용한 지역 지정과 같은 국가 차원의 노력이 향후 발전 전망을 더욱 밝게 하고 있습니다.
아시아태평양은 스마트 시티 시범 사업과 메가 프로젝트에 힘입어 가장 빠르게 성장하고 있는 지역입니다. 호주의 OpenAIR 네트워크와 시드니 공과대학교의 소음 카메라 검사는 저비용 센서와 고급 분석 기능을 결합한 정부 자금 지원 도입 사례의 모범적인 사례입니다. 동남아시아와 인도에서 급속한 도시화가 진행됨에 따라, 합리적인 가격에 확장성이 뛰어난 노드 및 클라우드 대시보드를 찾는 지자체 고객이 증가하고 있습니다.
북미에서는 연방 정부의 지침 개정과 엄격한 도시 조례가 호재로 작용하고 있습니다. 뉴욕시의 지속적인 모니터링 규정은 즉각적인 조달을 촉진하고 있는 반면, 연방도로청(FHWA)이 조만간 도입할 예정인 재고 관리 의무화에 따라 주 정부 기관들은 향후 수년에 걸쳐 하드웨어와 소프트웨어를 구매하기 위한 준비를 진행하고 있습니다. 남미, 중동 및 아프리카는 매출액 면에서는 뒤처지고 있지만, 환경 허가가 지속적인 소음 기록에 좌우되는 광업 지역이나 인프라 회랑에서 성장세를 보이고 있습니다. 지역별 규격의 다양성은 하드웨어를 전면적으로 교체하지 않고도 펌웨어나 보고서 템플릿을 적용할 수 있는 모듈형 플랫폼에 대한 수요를 견인하고 있으며, 소음 모니터링 시장에서 공급업체의 이익률을 지켜주고 있습니다.
기타 혜택
- 엑셀 형식 시장 예측(ME) 시트
- 3개월간의 애널리스트 지원
자주 묻는 질문
목차
제1장 서론
제2장 조사 방법
제3장 주요 요약
제4장 시장 구도
제5장 시장 규모 및 성장 예측
제6장 경쟁 구도
제7장 시장 기회 및 향후 전망
KTH 26.06.22According to Mordor Intelligence, the noise monitoring market size is projected to expand from USD 0.85 billion in 2025 and USD 0.90 billion in 2026 to USD 1.16 billion by 2031, registering a 5.25% CAGR between 2026 and 2031.
This report is Segmented by Component (Hardware, Software, and Services), Product Type (Fixed/Permanent, Portable, Wearable Dosimeters, Remote Kiosks, and More), Technology (Real-Time, IoT-Enabled, Cloud-Based Analytics, AI-Powered Predictive Analytics, and More), Application (Construction, Industrial, and More), and Geography. Market Forecasts are Provided in Terms of Value (USD).
Global Noise Monitoring Market Trends and Insights
Stricter Environmental Noise Regulations
New regulations convert once-optional monitoring into a procurement requirement. Ireland's draft guidance mandates CNOSSOS-EU methodology, recent input data, and validation of candidate mitigation areas, which expands demand for precision sensors and modeling tools. In the United States, the Federal Highway Administration proposes state-level inventories and model validation within +-3 dB, pushing agencies to deploy continuous networks that feed approved software. Municipal rules such as New York City's 2026 mandate for automated API uploads further accelerate the adoption of cloud-integrated devices. Vendors that certify to IEC 61672-1 and EN ISO 3744:2010 secure preferential status in public tenders.
Growth of Smart Cities and Urban Expansion
Noise sensors are now embedded within multiparameter platforms that also track traffic, air quality, and micro-climate data. Barcelona's TRAFFIC-NOISE project links acoustic and visual analytics to manage congestion in real time, illustrating how municipalities buy integrated stacks rather than stand-alone meters. Australia's OpenAIR program funds networked sensors across 13 local councils, using open protocols to future-proof procurement. Early adopters prefer suppliers offering ready-to-consume APIs and dashboard widgets that fit existing city operating systems, reshaping competition toward software openness.
High Capital and Maintenance Costs
Class 1 instrumentation, calibrated microphones, and secure cloud subscriptions strain small-city budgets. New York City's specification for outdoor-rated devices with compliant mounting heights illustrates how premium hardware and periodic recalibration inflate lifecycle cost. Vendors respond with subscription models that convert capex to opex, such as fleet-based pricing in the mining sector. Yet emerging markets still gravitate toward lower-accuracy alternatives, risking data gaps that undermine policy decisions.
Other drivers and restraints analyzed in the detailed report include:
- Expansion of Construction and Infrastructure Projects
- Rising Public Awareness of Noise-Related Health Impacts
- Data-Privacy Hurdles in Continuous Monitoring
For complete list of drivers and restraints, kindly check the Table Of Contents.
Segment Analysis
Services outpace hardware as clients seek turnkey compliance and analytics. Although equipment sales dominated the noise monitoring market in 2025, recurring contracts for calibration, cloud dashboards, and expert interpretation are forecast to grow faster, pushing the overall services share upward. Cirrus Research's expanded NoiseTools suite exemplifies how software upgrades anchor installed devices and create upsell paths. Government agencies such as the European Environment Agency earmark dedicated budgets for data processing and machine-learning pilots, reinforcing demand for specialized consultancies.
Service providers leverage long-term agreements to bundle hardware leasing, remote diagnostics, and standards compliance audits, buffering revenue against hardware refresh cycles. This migration aligns vendor incentives with customer outcomes, supporting higher margins and stickier relationships across the noise monitoring market.
Fixed networks remain indispensable for urban noise maps, yet wearable dosimeters are gaining traction in occupational health programs. Continuous exposure tracking for mobile workers in aviation maintenance, mining haulage, and manufacturing floors accelerates uptake of clip-on sensors that log personal sound dose. New regulations in construction hotspots, such as New York City's rule for projects within 50 feet of residences, still favour rugged fixed stations with weatherproof microphones.
Wearables complement these networks by confirming individual compliance with exposure limits and delivering real-time vibration or sound feedback to workers. Vendors integrating Bluetooth connectivity and cloud synchronization position wearables as an extension of enterprise safety platforms, smoothing data correlation with area monitors and widening the addressable noise monitoring market.
Geography Analysis
Europe anchors global revenues through the Environmental Noise Directive's five-year reporting cadence and standardized CNOSSOS-EU methodology, which obliges cities to refresh noise maps and public action plans. National initiatives such as Italy's highway abatement program and Scotland's designation of quiet areas reinforce pipeline visibility.
Asia-Pacific is the fastest-growing region, buoyed by smart-city pilots and megaprojects. Australia's OpenAIR network and the University of Technology Sydney's noise-camera trial exemplify government-funded deployments that blend low-cost sensors with advanced analytics. Rapid urbanization across Southeast Asia and India adds municipal customers focused on affordable, scalable nodes and cloud dashboards.
North America benefits from updated federal guidance and stringent city ordinances. New York City's continuous monitoring rule spurs immediate procurement, while the Federal Highway Administration's forthcoming inventory mandate primes state departments for multiyear hardware and software purchases. South America and the Middle East and Africa trail in revenue but show momentum in mining belts and infrastructure corridors where environmental permits hinge on continuous sound logging. Regional diversity in standards drives demand for modular platforms that adapt firmware and reporting templates without wholesale hardware swaps, safeguarding vendor margins within the noise monitoring market.
- Hottinger Bruel & Kjaer GmbH
- Acoem Group
- Larson Davis (PCB Piezotronics)
- RION Co., Ltd.
- Svantek
- Cirrus Research
- NTi Audio
- Casella (IDEAL Industries)
- Pulsar Instruments Plc
- G.R.A.S Sound and Vibration
- Norsonic AS
- Soft dB
- SINUS Messtechnik
- Extech Instruments (FLIR)
- TES Electrical Electronic Corp.
- AWA Instruments
- NoiseMeters Inc.
- Bruitparif
- 3M Personal Safety Division
- Castle Group Ltd.
Additional Benefits:
- The market estimate (ME) sheet in Excel format
- 3 months of analyst support
TABLE OF CONTENTS
1 INTRODUCTION
- 1.1 Study Assumptions and Market Definition
- 1.2 Scope of the Study
2 RESEARCH METHODOLOGY
3 EXECUTIVE SUMMARY
4 MARKET LANDSCAPE
- 4.1 Market Overview
- 4.2 Market Drivers
- 4.2.1 Stricter Environmental Noise Regulations
- 4.2.2 Growth of Smart Cities and Urban Expansion
- 4.2.3 Expansion of Construction and Infrastructure Projects
- 4.2.4 Rising Public Awareness of Noise-Related Health Impacts
- 4.2.5 ESG-Linked Acoustic Compliance Mandates
- 4.2.6 Real-Time Noise Data for Dynamic Traffic Management
- 4.3 Market Restraints
- 4.3.1 High Capital and Maintenance Costs
- 4.3.2 Data-Privacy Hurdles in Continuous Monitoring
- 4.3.3 Interoperability Gaps in Multi-Vendor IoT Networks
- 4.3.4 Shortage of Acoustic-Data Analytics Talent
- 4.4 Industry Value-Chain Analysis
- 4.5 Impact of Macroeconomic Factors on the Market
- 4.6 Regulatory Landscape
- 4.7 Technological Outlook
- 4.8 Porter's Five Forces Analysis
- 4.8.1 Threat of New Entrants
- 4.8.2 Bargaining Power of Suppliers
- 4.8.3 Bargaining Power of Buyers
- 4.8.4 Threat of Substitutes
- 4.8.5 Competitive Rivalry
5 MARKET SIZE AND GROWTH FORECASTS (VALUE)
- 5.1 By Component
- 5.1.1 Hardware
- 5.1.2 Software
- 5.1.3 Services
- 5.2 By Product Type
- 5.2.1 Fixed/Permanent Noise Monitoring Systems
- 5.2.2 Portable Noise Monitoring Systems
- 5.2.3 Wearable Personal Noise Dosimeters
- 5.2.4 Remote Noise Monitoring Kiosks
- 5.2.5 Other Product Types
- 5.3 By Technology
- 5.3.1 Real-Time Noise Monitoring
- 5.3.2 IoT-Enabled Smart Monitoring
- 5.3.3 Cloud-Based Noise Analytics Platforms
- 5.3.4 AI-Powered Predictive Acoustic Analytics
- 5.3.5 Other Technologies
- 5.4 By Application
- 5.4.1 Construction and Demolition Sites
- 5.4.2 Industrial Manufacturing Facilities
- 5.4.3 Transportation Hubs and Corridors
- 5.4.4 Urban / Community Noise Mapping
- 5.4.5 Mining and Energy Operations
- 5.4.6 Entertainment and Event Venues
- 5.4.7 Other Applications
- 5.5 By Geography
- 5.5.1 North America
- 5.5.1.1 United States
- 5.5.1.2 Canada
- 5.5.1.3 Mexico
- 5.5.2 Europe
- 5.5.2.1 Germany
- 5.5.2.2 United Kingdom
- 5.5.2.3 France
- 5.5.2.4 Italy
- 5.5.2.5 Spain
- 5.5.2.6 Rest of Europe
- 5.5.3 Asia-Pacific
- 5.5.3.1 China
- 5.5.3.2 Japan
- 5.5.3.3 India
- 5.5.3.4 South Korea
- 5.5.3.5 Australia
- 5.5.3.6 Rest of Asia-Pacific
- 5.5.4 South America
- 5.5.4.1 Brazil
- 5.5.4.2 Argentina
- 5.5.4.3 Rest of South America
- 5.5.5 Middle East and Africa
- 5.5.5.1 Middle East
- 5.5.5.1.1 Saudi Arabia
- 5.5.5.1.2 United Arab Emirates
- 5.5.5.1.3 Rest of Middle East
- 5.5.5.2 Africa
- 5.5.5.2.1 South Africa
- 5.5.5.2.2 Egypt
- 5.5.5.2.3 Rest of Africa
- 5.5.5.1 Middle East
- 5.5.1 North America
6 COMPETITIVE LANDSCAPE
- 6.1 Market Concentration
- 6.2 Strategic Moves
- 6.3 Market Share Analysis
- 6.4 Company Profiles (includes Global Level Overview, Market Level Overview, Core Segments, Financials as available, Strategic Information, Market Rank/Share, Products and Services, Recent Developments)
- 6.4.1 Hottinger Bruel & Kjaer GmbH
- 6.4.2 Acoem Group
- 6.4.3 Larson Davis (PCB Piezotronics)
- 6.4.4 RION Co., Ltd.
- 6.4.5 Svantek
- 6.4.6 Cirrus Research
- 6.4.7 NTi Audio
- 6.4.8 Casella (IDEAL Industries)
- 6.4.9 Pulsar Instruments Plc
- 6.4.10 G.R.A.S Sound and Vibration
- 6.4.11 Norsonic AS
- 6.4.12 Soft dB
- 6.4.13 SINUS Messtechnik
- 6.4.14 Extech Instruments (FLIR)
- 6.4.15 TES Electrical Electronic Corp.
- 6.4.16 AWA Instruments
- 6.4.17 NoiseMeters Inc.
- 6.4.18 Bruitparif
- 6.4.19 3M Personal Safety Division
- 6.4.20 Castle Group Ltd.
7 MARKET OPPORTUNITIES AND FUTURE OUTLOOK
- 7.1 White-Space and Unmet-Need Assessment


