
|
시장보고서
상품코드
2062217
하이드레이트 저해제 : 시장 점유율 분석, 산업 동향 및 통계 데이터, 성장 예측(2026-2031년)Hydrate Inhibitors - Market Share Analysis, Industry Trends & Statistics, Growth Forecasts (2026 - 2031) |
||||||
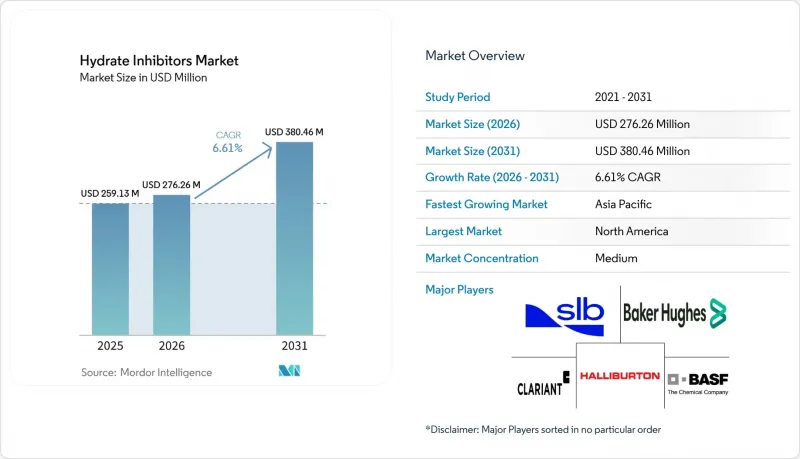
Mordor Intelligence에 의하면, 하이드레이트 저해제 시장 규모는 2025년 2억 5,913만 달러로 평가되었습니다. 2026년에는 2억 7,626만 달러로 확대되어 2031년까지 3억 8,046만 달러에 이르고 2026-2031년 CAGR은 6.61%를 나타낼 전망입니다.

본 보고서는 유형별(열역학적 하이드레이트 저해제 등), 형태별(액체·고체), 용도별(해저 파이프라인·수송 등), 최종 사용자 산업별(석유 및 가스 업스트림 공정, 미드스트림 공정·수송 등), 지역별(아시아태평양, 북미, 유럽, 남미, 중동 및 아프리카)로 분류되어 있습니다. 시장 전망은 금액(달러) 기준으로 제시되어 있습니다.
세계의 하이드레이트 저해제 시장 동향 및 인사이트
장거리 해저 타이백의 확대
근해 유전이 고갈됨에 따라, 50킬로미터를 넘는 초장거리 해저 타이백이 표준화되고 있습니다. 2026년 멕시코만에서 가동을 시작할 예정인 셰넌도어(Shenandoah) 프로젝트에서 클라리언트(Clariant)가 적용한 화학 기술은 2만 psi를 초과하는 압력 하에서도 유량을 확보하기 위해 응집 방지제를 지속적으로 주입해야 한다는 진화하는 운영 요건을 여실히 보여주고 있습니다. 중량비 1-3%에서 작용하는 저용량 억제제는 벌크 MEG에 비해 해상 저장량을 최대 50%까지 줄여주며, 헬리콥터를 이용한 보급 비용을 절감합니다. 전전기식 해저 레이아웃에서는 해저에 약품 탱크를 설치하여, 실시간 원격 계측을 통해 주입량을 조절할 수 있도록 하고 있습니다. 이 개념은 에니(Eni)사의 졸(Zol) 가스전에서 성공적으로 도입되어, 자동화된 피드백 루프를 통해 연간 MEG 소비량을 8-12% 절감했습니다. 약 40킬로미터를 초과하는 타이백의 경우, 약품은 파이프-인-파이프 단열 방식보다 비용 대비 효과가 높아, 첨단 하이드레이트 제어 솔루션에 대한 수요를 촉진하고 있습니다.
LNG 간선 및 가스 파이프라인 건설 확대
중국, 인도, 동남아시아에서는 새로운 LNG 수입 터미널이 가동을 시작했으며, 2024년부터 2026년 사이에 총 수십억 입방미터 규모의 재기화 용량이 추가될 예정입니다. 이 터미널들은 계절적인 기온 하락으로 인해 하이드레이트가 쉽게 형성되는 습하고 몬순의 영향을 많이 받는 지역을 가로지르는 광범위한 육상 파이프라인에 연결되어 있습니다. 그 결과, 2026년 3월에 완공된 인도의 동서 3,000킬로미터에 달하는 파이프라인망에서 볼 수 있듯이, 연중 내내 억제제를 주입하는 것이 표준 운영 요건이 되었습니다. 인도네시아의 연간 16억 입방미터 규모의 겐틴 FLNG와 같은 부유식 LNG 선박은 해상에는 열용량이 없기 때문에 운동 에너지형 억제제에만 의존하고 있습니다. 카타르의 LNG 확장 계획에는 육상에서 글리콜 재생 처리를 수행하는 전용 MEG 공급 루프가 포함되어 있으며, 이를 통해 가스전 가동 기간 동안 LNG 1톤당 화학약품 비용을 약 20% 절감할 수 있습니다.
업스트림 부문의 설비 투자 주기성은 브렌트 원유 가격과 연동됩니다.
브렌트 원유 가격이 배럴당 60달러 아래로 떨어지면, 사업자들은 단일 예산 주기 내에서 새로운 해저 타이백 프로젝트를 연기하는 경우가 많으며, 그 결과 화학물질 조달량이 즉시 감소합니다. 반대로, 가격 회복은 설계 및 조달 프로세스의 재개에 시간이 소요되기 때문에 일반적으로 18-24개월의 지연이 지난 후에야 비로소 프로젝트 승인을 촉진합니다. 예를 들어, 셰브론사는 가격 예측을 바탕으로 2026년 심해 사업 예산이 10-15% 변동할 가능성이 있다고 밝혔으며, 이는 하이드레이트 저해제 입찰에 직접적인 영향을 미치고 있습니다. 북미의 셰일 사업은 더욱 신속하게 대응합니다. 유정 수가 감소함에 따라 가스 집합 파이프라인의 이용률이 낮아져, 생산자는 1분기 이내에 억제제 투여량을 두 자릿수만큼 줄일 수 있게 됩니다.
부문별 분석
열역학적 억제제는 육상 가스 처리 루프에서 입증된 효능 덕분에 2025년 하이드레이트 저해제 시장 점유율의 43.13%를 차지했습니다. 이 공정에서 회수된 MEG는 최대 95%의 재활용 효율을 달성하고 있습니다. 친환경·생분해성 억제제 시장 규모는 2031년까지 연평균 성장률(CAGR) 7.44%로 확대될 것으로 전망됩니다. 이는 OECD 301B 기준에 따라 68.9%의 생분해성을 보임과 동시에 항응집 기능을 유지한 올레산 디나트륨계 계면활성제에 의해 뒷받침된 것입니다. Innospec 등공급업체는 초고압 유정을 위해 API 17TR6 인증을 받은 저용량 화학 약품을 공급하고 있으며, 이를 통해 배럴당 물류 비용을 약 500달러 절감하고 있습니다.
기존 재생 설비가 가동 중인 지역에서는 기존의 메탄올이나 MEG가 여전히 비용 대비 효과가 높은 선택지로 남아 있지만, 북해와 미국 멕시코만에서 배출 규제가 강화됨에 따라 보다 친환경적인 대체품으로의 전환이 서서히 진행되고 있습니다. 수명 연장 프로젝트에 참여하는 운영 담당자들은 비용과 규정 준수 요건의 균형을 맞추기 위해, 시운전 단계에서는 MEG를 사용하고, 정상 운전 단계에서는 생분해성 응집 방지제로 전환하는 이중 억제제 전략을 채택하고 있습니다. 두 약제의 공존은 앞으로도 지속될 전망이지만, 환경 보호가 필요한 지역에서 친환경 제품에 프리미엄 가격을 책정하는 것은 특수 화학제품 공급업체에게 이익률 향상 기회가 늘어날 것임을 시사합니다.
액체 억제제는 2025년 매출의 77.89%를 차지했습니다. 이는 단일 주입 탯줄을 사용하여 하이드레이트, 스케일, 부식 방지제를 동시에 계량 주입할 수 있으므로, 상부 구조물을 단순화할 수 있기 때문입니다. 고체 억제제는 분기별 헬리콥터 운항 횟수를 40% 줄인 북미의 원격 광구 파일럿 사업에 힘입어, 2031년까지 연평균 성장률(CAGR) 7.32%를 기록하며 성장할 것으로 전망됩니다.
폴리머 매트릭스에 봉입된 고체 펠릿은 30-90일에 걸쳐 용해되어, 현장에서 500-1,000 ppm의 억제제 농도를 유지합니다. 이 방식은 액체 탱크를 설치하기 어려운 무인 위성 유전에서 특히 매력적입니다. 그러나 용해 속도의 편차와 지층 손상 위험으로 인해, 더 광범위한 도입에는 한계가 있습니다. 시운전 시에는 액체 억제제를 사용하고, 정상 운전 시에는 펠릿으로 전환하는 하이브리드 방식이 점차 받아들여지고 있습니다.
지역별 분석
북미는 2025년에 33.45%의 시장 점유율을 차지했으며, 이는 멕시코만 심해 생산량과 셰일가스 수송 시스템에 힘입은 결과였습니다. 화학약품 소비량을 10% 가까이 줄인 디지털 투여 플랫폼을 도입함에 따라, 해당 지역의 자산 기반이 밀집해 있음에도 불구하고 절대적인 성장세는 완만해졌습니다.
아시아태평양은 가장 빠르게 성장하는 지역으로, 2031년까지의 연평균 성장률(CAGR)은 7.25%로 예측됩니다. 이러한 성장은 중국의 신규 LNG 터미널과 인도의 총 길이 3,000킬로미터에 달하는 가스 파이프라인에 힘입어 이루어지고 있습니다. 이들 모두 높은 수분 함량이나 온도 변동에 대응하기 위해 24시간 가동되는 MEG 또는 동적 억제제 루프를 갖추도록 설계되었습니다. 또한, 인도네시아와 말레이시아에서 건설 중인 부유식 LNG 선박의 선체에서도 수요가 발생하고 있습니다. 이러한 지역에서는 열처리를 통한 대안이 이용될 수 없기 때문입니다.
홋카이도의 운영사들이 단거리 타이백(연결관)에 단열재를 점점 더 많이 채택하고 있기 때문에 유럽 시장 점유율은 안정적입니다. 그러나 해당 지역에서 새롭게 구축되고 있는 CCS(이산화탄소 포집 및 저장) 파이프라인이 CO₂ 전용 억제제에 대한 새로운 수요를 창출하고 있습니다. 중동 및 아프리카는 카타르의 500킬로미터에 달하는 전용 MEG 시스템과 사우디아라비아의 파이프라인 확장 사업의 혜택을 누리고 있습니다. 남미에서는 진전이 더딘 편이며, 프레솔트층 유전에서는 비용 대비 효과가 가장 높은 유량 확보 방안으로 화학 약품의 물류에 의존하고 있습니다.
기타 혜택 :
- 엑셀 형식 시장 예측(ME) 시트
- 3개월간의 애널리스트 지원
자주 묻는 질문
목차
제1장 서론
제2장 분석 방법
제3장 주요 요약
제4장 시장 구도
제5장 시장 규모 및 성장률 예측
제6장 경쟁 구도
제7장 시장 기회 및 향후 전망
KTH 26.06.24According to Mordor Intelligence, the hydrate inhibitors market size is expected to increase from USD 259.13 million in 2025 to USD 276.26 million in 2026 and reach USD 380.46 million by 2031, growing at a CAGR of 6.61% over 2026-2031.
This report is Segmented by Type (Thermodynamic Hydrate Inhibitors, and More), Form (Liquid and Solid), Application (Subsea Pipelines and Transportation, and More), End-User Industry (Upstream Oil and Gas, Midstream and Transmission, and More), and Geography (Asia-Pacific, North America, Europe, South America and Middle-East and Africa). The Market Forecasts are Provided in Terms of Value (USD).
Global Hydrate Inhibitors Market Trends and Insights
Expansion of Long-Distance Subsea Tie-Backs
Ultra-long tie-backs exceeding 50 kilometers have become standard as near-field reservoirs are depleted. Clariant's chemistry for the 2026 Shenandoah start-up in the Gulf of Mexico highlights the evolving operational requirements, where continuous anti-agglomerant dosing ensures flow at pressures above 20,000 psi. Low-dosage inhibitors, functioning at 1-3% by weight, reduce offshore storage volumes by up to 50% compared to bulk MEG, lowering helicopter resupply costs. All-electric subsea layouts incorporate chemical tanks on the seabed, enabling real-time telemetry to adjust dosing rates. This concept has been successfully implemented at Eni's Zohr gas field, where automated feedback loops reduced annual MEG consumption by 8-12%. For tie-backs extending beyond approximately 40 kilometers, chemicals are more cost-effective than pipe-in-pipe insulation, driving demand for advanced hydrate-control solutions.
Growing LNG Trunk-line and Gas-pipeline Construction
China, India, and Southeast Asia are commissioning new LNG import terminals, collectively adding double-digit billions of cubic meters of regasification capacity between 2024 and 2026. These terminals connect to extensive onshore pipelines traversing humid, monsoon-prone regions where seasonal cooling induces hydrate formation. Consequently, year-round inhibitor injection is a standard operational requirement, as seen in India's 3,000-kilometer east-to-west grid completed in March 2026. Floating LNG vessels, such as Indonesia's 1.6 bcm-per-year Genting FLNG, rely exclusively on kinetic inhibitors due to the absence of thermal mass in offshore locations. Qatar's LNG expansion includes dedicated MEG delivery loops with onshore glycol regeneration, reducing chemical costs per ton of LNG by approximately 20% over the field's lifespan.
Upstream CAPEX Cyclicality Tied to Brent Crude Prices
When Brent crude prices fall below USD 60 per barrel, operators often defer new subsea tie-back projects within a single budgeting cycle, leading to immediate reductions in chemical procurement. Conversely, price recoveries typically stimulate project approvals only after an 18-24-month delay due to the time required for engineering and procurement processes to resume. For example, Chevron has indicated a 10-15% fluctuation in its 2026 deepwater budget based on price forecasts, directly impacting hydrate-inhibitor tenders. North American shale operations respond even more rapidly; declining well counts reduce gathering-line utilization, enabling producers to cut inhibitor dosages by double digits within a single quarter.
Other drivers and restraints analyzed in the detailed report include:
- Emergence of CO2-Rich CCS/CCUS Flowlines
- Shift Toward All-Electric Subsea Architecture
- Regulatory Phase-Out of Persistent Quaternary Surfactants
For complete list of drivers and restraints, kindly check the Table Of Contents.
Segment Analysis
Thermodynamic inhibitors retained 43.13% of the hydrate inhibitors market share in 2025 due to their established effectiveness in onshore gas-processing loops, where recovered MEG achieves up to 95% recycling efficiency. The market size for green/biodegradable inhibitors is anticipated to grow at a 7.44% CAGR through 2031, supported by a disodium oleate surfactant that demonstrated 68.9% biodegradation under OECD 301B standards while maintaining anti-agglomerant functionality. Vendors such as Innospec are offering API 17TR6-validated low-dose chemistries for ultra-high-pressure wells, reducing logistics costs by approximately USD 500 per delivered barrel.
Legacy methanol and MEG will remain cost-effective in regions with existing regeneration units; however, stricter discharge regulations in the North Sea and U.S. Gulf indicate a gradual shift toward greener alternatives. Operators involved in life-extension projects are adopting dual-inhibitor strategies, utilizing MEG during ramp-up phases and transitioning to biodegradable anti-agglomerants for steady-state operations to balance costs with compliance requirements. The coexistence of both chemistries is expected to continue, but the premium pricing of green products in environmentally sensitive regions suggests increasing margin opportunities for specialty suppliers.
Liquid inhibitors accounted for 77.89% of 2025 revenue, as their use simplifies topside architecture by enabling a single injection umbilical to meter hydrate, scale, and corrosion inhibitors simultaneously. Solid inhibitors are projected to grow at a 7.32% CAGR through 2031, driven by remote wellhead pilots in North America that reduced quarterly helicopter runs by 40%.
Solid pellets embedded in polymer matrices dissolve over 30-90 days, maintaining 500-1,000 ppm inhibitor in-situ. This approach is particularly appealing for unmanned satellite fields where liquid tanks are impractical. However, variability in dissolution rates and risks of formation damage limit broader adoption. Hybrid schedules, where operators begin with liquid inhibitors during commissioning and transition to pellets for steady-state operations, are gaining acceptance.
Geography Analysis
North America held a 33.45% market share in 2025, supported by deepwater volumes in the Gulf of Mexico and shale-gas gathering systems. The adoption of digital dosing platforms, which reduced chemical consumption by nearly 10%, moderated absolute growth despite the region's dense asset base.
Asia-Pacific is the fastest-growing region, with a 7.25% CAGR projected through 2031. Growth is driven by China's new LNG terminals and India's 3,000-kilometer gas pipeline, both designed with 24-hour MEG or kinetic-inhibitor loops to handle high water cuts and temperature variations. Additional demand comes from floating LNG hulls under construction in Indonesia and Malaysia, where thermal substitutes are unavailable.
Europe's market share remains stable as North Sea operators increasingly use thermal insulation for short tie-backs. However, the region's emerging CCS pipelines are creating new demand for CO2-specific inhibitors. The Middle-East and Africa benefit from Qatar's 500-kilometer dedicated MEG system and Saudi Arabia's pipeline expansions. South America is progressing slowly, with pre-salt fields relying on chemical logistics as the most cost-effective flow-assurance solution.
- Arkema
- Ashland
- Baker Hughes Company
- BASF
- Clariant
- Ecolab
- Evonik Industries AG
- Halliburton
- Innospec
- Kemira Oyj
- Kuraray
- SLB
- Thermax Limited
Additional Benefits:
- The market estimate (ME) sheet in Excel format
- 3 months of analyst support
TABLE OF CONTENTS
1 Introduction
- 1.1 Study Assumptions and Market Definition
- 1.2 Scope of the Study
2 Research Methodology
3 Executive Summary
4 Market Landscape
- 4.1 Market Overview
- 4.2 Market Drivers
- 4.2.1 Expansion of long-distance subsea tie-backs
- 4.2.2 Growing LNG trunk-line and gas-pipeline construction
- 4.2.3 Emergence of CO2-rich CCS/CCUS flowlines
- 4.2.4 Shift toward all-electric subsea architecture
- 4.2.5 Demand for hydrate inhibitors in hydrogen carrier pipelines (NH3, LOHC)
- 4.3 Market Restraints
- 4.3.1 Upstream CAPEX cyclicality tied to Brent crude prices
- 4.3.2 Regulatory phase-out of persistent quaternary surfactants
- 4.3.3 Thermal subsea insulation competing with chemical inhibitors
- 4.4 Value Chain Analysis
- 4.5 Porter's Five Forces
- 4.5.1 Threat of New Entrants
- 4.5.2 Bargaining Power of Buyers
- 4.5.3 Bargaining Power of Suppliers
- 4.5.4 Threat of Substitutes
- 4.5.5 Competitive Rivalry
5 Market Size and Growth Forecasts (Value)
- 5.1 By Type
- 5.1.1 Thermodynamic Hydrate Inhibitors (THIs)
- 5.1.2 Low-Dosage Hydrate Inhibitors (LDHIs)
- 5.1.3 Green/Biodegradable Inhibitors
- 5.2 By Form
- 5.2.1 Liquid
- 5.2.2 Solid
- 5.3 By Application
- 5.3.1 Subsea Pipelines and Transportation
- 5.3.2 Oil and Gas Production Wells
- 5.3.3 Gas Processing and Separation Plants
- 5.3.4 Liquified Natural Gas (LNG) and Floating Liquefied Natural Gas (FLNG) Facilities
- 5.3.5 Carbon Capture Storage (CCS)/Carbon Capture, Storage, and Utilization (CCUS) and Carbon Dioxide Pipelines
- 5.4 By End-user Industry
- 5.4.1 Upstream Oil and Gas
- 5.4.2 Midstream and Transmission
- 5.4.3 Liquified Natural Gas (LNG) Operators
- 5.4.4 Petrochemical and Gas-to-Liquids
- 5.4.5 Other End-user Industries (Marine, Power, Industrial Refrigeration)
- 5.5 By Geography
- 5.5.1 Asia-Pacific
- 5.5.1.1 China
- 5.5.1.2 India
- 5.5.1.3 Japan
- 5.5.1.4 South Korea
- 5.5.1.5 ASEAN Countries
- 5.5.1.6 Rest of Asia-Pacific
- 5.5.2 North America
- 5.5.2.1 United States
- 5.5.2.2 Canada
- 5.5.2.3 Mexico
- 5.5.3 Europe
- 5.5.3.1 Germany
- 5.5.3.2 United Kingdom
- 5.5.3.3 France
- 5.5.3.4 Italy
- 5.5.3.5 Spain
- 5.5.3.6 Russia
- 5.5.3.7 NORDIC Countries
- 5.5.3.8 Rest of Europe
- 5.5.4 South America
- 5.5.4.1 Brazil
- 5.5.4.2 Argentina
- 5.5.4.3 Rest of South America
- 5.5.5 Middle-East and Africa
- 5.5.5.1 Saudi Arabia
- 5.5.5.2 South Africa
- 5.5.5.3 Rest of Middle-East and Africa
- 5.5.1 Asia-Pacific
6 Competitive Landscape
- 6.1 Market Concentration
- 6.2 Strategic Moves
- 6.3 Market Share (%)/Ranking Analysis
- 6.4 Company Profiles (includes Global level Overview, Market level overview, Core Segments, Financials as available, Strategic Information, Products and Services, and Recent Developments)
- 6.4.1 Arkema
- 6.4.2 Ashland
- 6.4.3 Baker Hughes Company
- 6.4.4 BASF
- 6.4.5 Clariant
- 6.4.6 Ecolab
- 6.4.7 Evonik Industries AG
- 6.4.8 Halliburton
- 6.4.9 Innospec
- 6.4.10 Kemira Oyj
- 6.4.11 Kuraray
- 6.4.12 SLB
- 6.4.13 Thermax Limited
7 Market Opportunities and Future Outlook
- 7.1 White-space and Unmet-need Assessment
