
|
시장보고서
상품코드
2062270
클라우드 FinOps 시장 : 시장 점유율 분석, 업계 동향 및 통계, 성장 예측(2026-2031년)Cloud FinOps - Market Share Analysis, Industry Trends & Statistics, Growth Forecasts (2026 - 2031) |
||||||
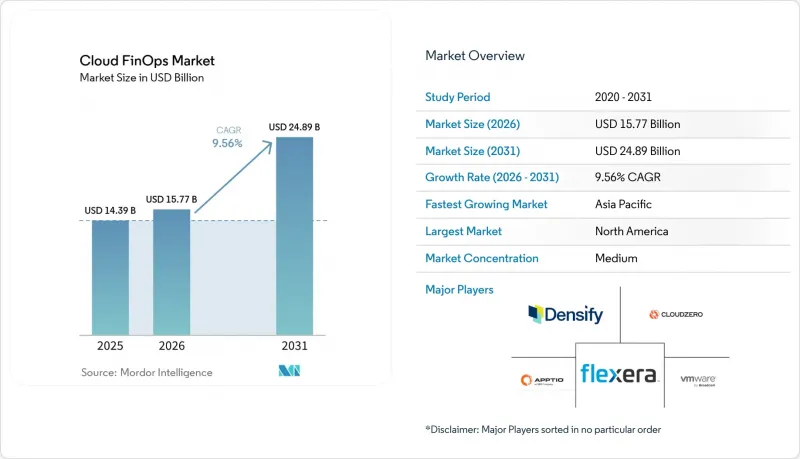
Mordor Intelligence에 의하면, 클라우드 FinOps 시장 규모는 2025년 143억 9,000만 달러로 평가되었고, 2026년 157억 7,000만 달러로 추정되고, 2031년까지 248억 9,000만 달러로 확대될 전망이며, 2026-2031년 연평균 복합 성장률(CAGR)은 9.56%를 나타낼 것으로 예측됩니다.
본 보고서는 구성 요소별(소프트웨어, 서비스), 도입 형태별(퍼블릭 클라우드, 프라이빗 클라우드 등), 조직 규모별(대기업, 중소기업), 최종 사용자 산업 분야별(IT 및 통신, 은행 및 금융 서비스, 보험, 소매 및 전자상거래, 헬스케어 및 생명과학 등) 및 지역별로 분류되어 있습니다. 시장 전망은 금액(달러) 기준으로 제시되어 있습니다.
세계 클라우드 FinOps 시장 동향 및 인사이트
점점 더 복잡해지는 멀티 클라우드 및 하이브리드 클라우드 환경에는 통합된 비용 거버넌스가 필요합니다.
Amazon Web Services, Microsoft Azure, Google Cloud Platform에 걸쳐 워크로드를 운영하는 조직은 호환되지 않는 과금 체계, 파편화된 할인 논리, 일관성 없는 태그 지정과 같은 과제에 직면해 있습니다. ‘FinOps Open Cost and Usage Specification’은 데이터 표준화를 추진하고 있지만, 각 하이퍼스케일러 기업들은 자사만의 락인 전략을 우선시하고 있기 때문에 기업들은 지출을 통합하고 비용을 정확하게 배분하며 세계 정책을 적용할 수 있는 오케스트레이션 플랫폼을 도입하고 있습니다. 금융 서비스 및 통신 기업은 정확한 차지백을 의무화하는 규제 분류가 있기 때문에 이를 조기에 도입한 기업들입니다. 따라서, 통합된 거버넌스는 클라우드 FinOps 시장의 성장에 있어 매우 중요한 촉매제가 될 것입니다.
2024년 감사 규정 개정 이후 클라우드 예산에 대한 CFO의 감독 의무
미국 재무회계기준위원회(FASB)의 지침에 따라, 여러 해에 걸친 클라우드 계약은 운영리스 부채로 처리되게 되었으며, 클라우드 지출은 CFO의 주요 과제가 되었습니다. 2025년 조사에 따르면, 이사회 중 66%가 클라우드 예산을 검토하고 있으며, 감사 기준을 준수하는 차이 보고 및 시나리오 모델링에 대한 수요가 증가하고 있습니다. 영국 은행의 사례에서 FinOps를 통합한 결과 380만 파운드(480만 달러)가 넘는 비용 절감을 달성했습니다. 이러한 규제적 요인이 도입을 가속화하며, 클라우드 FinOps 시장의 신뢰도를 높이고 있습니다.
인증된 FinOps 실무자 부족이 기업의 규모 확대를 저해하고 있습니다.
FinOps Foundation은 수천 건의 인증을 발급하고 있지만, 특히 아시아태평양 및 중동 시장에서 수요가 공급을 초과하고 있습니다. 기업들은 외부 컨설턴트에게 막대한 비용을 지불하고 있어 프로그램 비용이 증가하고 있으며, 수동 검토에서 자동화된 거버넌스로의 전환이 지연되고 있습니다. 중소기업은 이러한 영향에 가장 크게 시달리고 있으며, 정교한 리사이징보다는 리저브드 인스턴스 구매에 국한된 표면적인 최적화 방안을 수용하는 경우가 많아지고 있습니다. 따라서 인력 부족이 클라우드 FinOps 시장의 성장을 저해하고 있습니다.
부문별 분석
2025년, 소프트웨어는 클라우드 FinOps 시장에서 65.15%라는 압도적인 점유율을 차지했으며, 이는 조직이 클라우드 재무 운영을 효과적으로 관리하는 데 있어 소프트웨어가 수행하는 중요한 역할을 반영하고 있습니다. 그러나 서비스 분야는 주로 조직 내 전문 지식의 부족에 힘입어 연평균 성장률(CAGR) 10.55%라는 견실한 성장이 예상됩니다. 이러한 격차는 FinOps를 보다 광범위한 디지털 전환(DX) 이니셔티브에 통합하려는 움직임을 강화하고 있는 매니지드 서비스 제공업체들에게 비즈니스 기회를 창출하고 있습니다. 이와 동시에, 컨설팅 기업들도 이러한 수요에 대응하기 위해 사내 팀을 육성하고, 운영 효율을 높이기 위한 목표 지향적인 최적화 스프린트를 실시하기 시작했습니다.
중소기업(SME)은 지출액에 따라 달라지는 수수료의 예측 불가능성을 없애주는 정액 요금제를 선호하는 경향이 있습니다. 이러한 모델들은 성장 단계에 있는 기업에 흔히 있는 제한된 예산과 잘 부합하여, 이 부문에 있어 매력적인 선택지가 되고 있습니다. 소프트웨어 측면에서는 각 벤더들이 플랫폼을 강화하기 위해 끊임없이 혁신을 이어가고 있습니다. 구체적으로는 의심스러운 움직임을 식별하기 위한 AI 기반 이상 감지, 인프라 관리를 효율화하는 Terraform과의 통합, 지속가능성 목표 달성을 지원하는 탄소 배출 예측과 같은 고급 기능을 탑재하고 있습니다. 이러한 기능 강화는 기능성을 향상시킬 뿐만 아니라, 플랫폼에 대한 충성도를 높이고 장기적인 고객 유지를 촉진합니다. 자동화와 자문 서비스의 상호작용을 통해, 다양한 조직에 어필할 수 있는 다층적인 가치 제안을 창출하고 있습니다. 이러한 조합은 클라우드 FinOps 시장의 성장세를 유지하며, 클라우드 주도형 비즈니스 환경이 점점 더 확대되는 가운데 지속적인 성장과 중요성을 확고히 하고 있습니다.
2025년, 퍼블릭 클라우드에 대한 지출은 전체 클라우드 지출의 46.45%를 차지했습니다. 그러나 하이브리드 및 멀티 클라우드 환경은 눈부신 성장을 거듭하고 있으며, 벤더 종속으로 인한 위험을 완화하기 위해 기업들이 이러한 모델을 채택하는 경향이 강해짐에 따라 연평균 성장률(CAGR) 11.34%로 확대되고 있습니다. 리저브드 인스턴스 할인을 공급자 간에 이전할 수 없기 때문에 약정 관리가 분산되어 있어 클라우드 비용 최적화 전략의 복잡성을 가중시키고 있습니다. 퍼블릭 클라우드와 하이브리드 클라우드 모델이 부상하고 있음에도 불구하고, 규정 준수 및 보안상의 이점 덕분에 규제 산업 분야에서는 프라이빗 클라우드가 여전히 중요한 요소로 자리 잡고 있습니다.
한편, FinOps 도구는 일관된 태깅 및 비용 전가 정책을 구현하여 On-Premise, 엣지, 퍼블릭 환경의 각 워크로드 간에 일관성을 확보할 수 있도록 발전하고 있습니다. 'Open Cost and Usage Specification'은 플랫폼 간 데이터 입력을 표준화하는 것을 목표로 하고 있지만, 도입 현황에 차이가 있어 운영 효율화를 위한 타사 표준화 엔진에 대한 수요가 계속해서 증가하고 있습니다. 클라우드 환경 관리의 이러한 복잡성 증대가 클라우드 FinOps 시장을 급격하고 지속적인 성장 궤도로 이끌고 있습니다.
지역별 분석
2025년, 북미는 클라우드 FinOps 시장을 독점하며 매출 점유율의 37.45%를 차지했습니다. 이러한 선도적 지위는 하이퍼스케일러의 본사가 위치해 있다는 점, FinOps Foundation의 조기 도입, 그리고 풍부한 인재 풀에 의해 뒷받침되었습니다. 이 지역의 이사회에서는 클라우드 예산을 전략적 수단으로 간주하는 경향이 강해지고 있으며, 이는 FinOps 실천의 성숙도를 가속화하고 있습니다. 이러한 요인들이 복합적으로 작용하여, 북미는 세계 시장에서 주요 주자로서의 입지를 확고히 하고 있으며, 다른 지역이 따라야 할 기준을 제시하고 있습니다.
유럽은 이에 근소한 차이로 뒤를 이었으며, 기업 지속가능성 보고 지침(CSRD)이 재무 검토에 GreenOps의 탄소 지표를 반영함으로써 매우 중요한 역할을 수행했습니다. 이번 통합을 통해 비용 관리와 ESG(환경, 사회, 지배구조)의 우선순위가 조화를 이루게 되었으며, 이는 지속가능성에 대한 중요성이 높아지고 있음을 반영하고 있습니다. 한편, 아시아태평양 지역은 연평균 성장률(CAGR) 12.21%라는 눈부신 성장세를 보이며 가장 빠르게 성장하는 지역으로 부상했습니다. 이 지역의 성장은 중국, 인도, 한국에서 하이퍼스케일러의 확장에 더해, 다국어 청구 처리의 복잡성을 해결하기 위해 FinOps 관행을 적용한 현지화된 IT 서비스에 힘입어 이루어지고 있습니다.
중동 및 아프리카에서도 성장세가 두드러졌으며, 사우디아라비아와 UAE에서 주권 클라우드 도입을 의무화한 것이 원동력이 되어, 국내 규정을 준수하는 플랫폼에 대한 수요가 촉진되었습니다. 그러나 해당 지역의 인증된 인력 부족으로 인해 이러한 노력의 확대 속도가 둔화되고 있습니다. 남미에서는 시장이 여전히 초기 단계에 있지만, 브라질과 아르헨티나가 특히 전자상거래 및 금융 서비스 분야에서 FinOps 관행의 도입을 주도하고 있습니다. 이러한 지리적 확산은 클라우드 FinOps 시장의 세계적 부상을 여실히 보여주며, 지역을 불문하고 그 중요성이 커지고 있음을 시사합니다.
기타 혜택 :
- 엑셀 형식 시장 예측(ME) 시트
- 3개월간의 애널리스트 지원
자주 묻는 질문
목차
제1장 서론
제2장 조사 방법
제3장 주요 요약
제4장 시장 구도
제5장 시장 규모 및 성장 예측
제6장 경쟁 구도
제7장 시장 기회 및 향후 전망
AJYAccording to Mordor Intelligence, the cloud FinOps market size is projected to expand from USD 15.77 billion in 2026 and USD 14.39 billion in 2025 to USD 24.89 billion by 2031, registering a CAGR of 9.56% between 2026 and 2031.

This report is Segmented by Component (Software, Services), Deployment Type (Public Cloud, Private Cloud, and More), Organization Size (Large Enterprises, Small and Medium Enterprises), End-User Industry (IT and Telecommunications, Banking Financial Services and Insurance, Retail and E-Commerce, Healthcare and Life Sciences, and More), and Geography. The Market Forecasts are Provided in Terms of Value (USD).
Global Cloud FinOps Market Trends and Insights
Escalating Multi-Cloud and Hybrid-Cloud Complexity Requires Unified Cost Governance
Organizations running workloads across Amazon Web Services, Microsoft Azure, and Google Cloud Platform navigate incompatible billing schemas, fragmented discount logic, and inconsistent tagging. The FinOps Open Cost and Usage Specification is normalizing data, yet hyperscalers prioritize proprietary lock-in, so enterprises adopt orchestration platforms that aggregate spend, allocate costs accurately, and enforce global policies. Financial services and telecommunications firms are early adopters, given regulatory segmentation that mandates precise chargeback. Unified governance is therefore a pivotal growth catalyst for the cloud FinOps market.
Mandatory CFO Oversight of Cloud Budgets After 2024 Audit-Rule Updates
Financial Accounting Standards Board guidance now treats multiyear cloud commitments as operating-lease liabilities, elevating cloud spend to the CFO agenda. A 2025 survey showed 66% of boards review cloud budgets, driving demand for audit-grade variance reporting and scenario modeling. United Kingdom banking examples illustrate savings exceeding GBP 3.8 million (USD 4.8 million) after centralizing FinOps. This regulatory driver accelerates adoption, reinforcing the credibility of the cloud FinOps market.
Shortage of Certified FinOps Practitioners Limits Enterprise Scaling
The FinOps Foundation has issued thousands of certifications, yet demand outpaces supply, especially in Asia-Pacific and Middle East markets. Enterprises pay premiums for external consultants, increasing program costs and slowing the shift from manual reviews to automated governance. Small and medium enterprises feel the pinch most acutely, often accepting shallow optimization limited to reserved-instance purchases rather than advanced rightsizing. The talent gap therefore restrains the cloud FinOps market.
Other drivers and restraints analyzed in the detailed report include:
- GenAI Workload Cost Spikes Raise Urgency for Granular Unit-Economics Tracking
- Mainstream Adoption of FinOps Framework v4.0 by Hyperscalers
- Disparate Billing APIs and Tagging Standards Complicate Data Normalization
For complete list of drivers and restraints, kindly check the Table Of Contents.
Segment Analysis
In 2025, software held a dominant 65.15% share of the cloud FinOps market, reflecting its critical role in enabling organizations to manage cloud financial operations effectively. However, services are projected to experience significant growth, with a robust 10.55% CAGR, driven largely by the lack of in-house expertise within organizations. This gap has created opportunities for managed-service providers, who are increasingly integrating FinOps into broader digital transformation initiatives. At the same time, consultancies are stepping in to address this need by training internal teams and executing targeted optimization sprints to enhance operational efficiency.
Small and medium enterprises (SMEs) are showing a preference for flat-fee pricing models, which eliminate the unpredictability of percentage-of-spend fees. These models align well with the constrained budgets typical of growth-stage businesses, making them an attractive option for this segment. On the software side, vendors are continuously innovating to strengthen their platforms. They are incorporating advanced features such as AI-driven anomaly detection to identify irregularities, Terraform integration to streamline infrastructure management, and carbon forecasting to support sustainability goals. These enhancements not only improve functionality but also increase platform stickiness, encouraging long-term customer retention. The interplay between automation and advisory services is creating a layered value proposition that appeals to a wide range of organizations. This combination sustains the momentum of the cloud FinOps market, ensuring its continued growth and relevance in an increasingly cloud-driven business environment.
In 2025, public cloud spending accounted for 46.45% of the total cloud expenditure. However, hybrid and multi-cloud estates are witnessing significant growth, expanding at an 11.34% CAGR as companies increasingly adopt these models to mitigate the risks associated with vendor lock-in. The inability to transfer reserved-instance discounts across providers has resulted in fragmented commitment management, adding complexity to cloud cost optimization strategies. Despite the rise of public and hybrid cloud models, private cloud remains a critical component in regulated sectors due to its compliance and security advantages.
Meanwhile, FinOps tools are evolving to implement consistent tagging and chargeback policies, ensuring uniformity across on-premises, edge, and public workloads. The Open Cost and Usage Specification seeks to standardize data inputs across platforms, but inconsistent adoption has underscored the continued demand for third-party normalization engines to streamline operations. This growing complexity in managing cloud environments is driving the cloud FinOps market to experience a steep and sustained growth trajectory.
Geography Analysis
In 2025, North America dominated the cloud FinOps market, accounting for 37.45% of the revenue share. This leadership was driven by the presence of hyperscaler headquarters, early adoption of the FinOps Foundation, and a deep talent pool. Boards across the region increasingly treat cloud budgets as strategic levers, accelerating the maturity of FinOps practices. These factors collectively position North America as a key player in the global market, setting benchmarks for other regions to follow.
Europe followed closely, where the Corporate Sustainability Reporting Directive played a pivotal role by incorporating GreenOps carbon metrics into financial reviews. This integration aligns cost management with ESG (Environmental, Social, and Governance) priorities, reflecting a growing emphasis on sustainability. Meanwhile, Asia-Pacific emerged as the fastest-growing region, with a remarkable 12.21% CAGR. The region's growth is anchored by the expansion of hyperscalers in China, India, and Korea, alongside localized IT services that adapt FinOps practices to address multilingual billing complexities.
The Middle East and Africa also witnessed momentum, driven by sovereign-cloud mandates in Saudi Arabia and the UAE, which spurred demand for platforms compliant with national regulations. However, the scarcity of certified talent in the region has slowed the pace of scaling these initiatives. In South America, the market remains in its emerging phase, with Brazil and Argentina leading the adoption of FinOps practices, particularly in the e-commerce and financial services sectors. This diverse geographic spread highlights the global rise of the cloud FinOps market, showcasing its growing importance across regions.
- Apptio, Inc.
- VMware, Inc. (Broadcom, Inc.)
- Flexera Software LLC
- CloudZero, Inc.
- Densify Inc.
- Harness Inc.
- Spot by NetApp, Inc.
- Microsoft Corporation (Azure Cost Management)
- Amazon Web Services, Inc. (AWS Cost Explorer)
- Google LLC (Cost Management Tools)
- Anodot Ltd.
- Turbonomic, Inc. (an IBM company)
- CloudBolt Software, Inc.
- Yotascale, Inc.
- Stackwatch, Inc. (Kubecost)
- ProsperOps, Inc.
- nOps, Inc.
- Granulate Cloud Solutions Ltd. (an Intel company)
- Finout Ltd.
- Zesty Tech Ltd.
Additional Benefits:
- The market estimate (ME) sheet in Excel format
- 3 months of analyst support
TABLE OF CONTENTS
1 INTRODUCTION
- 1.1 Market Definition and Study Assumptions
- 1.2 Scope of the Study
2 RESEARCH METHODOLOGY
3 EXECUTIVE SUMMARY
4 MARKET LANDSCAPE
- 4.1 Market Overview
- 4.2 Market Drivers
- 4.2.1 Escalating Multi-Cloud and Hybrid-Cloud Complexity Requires Unified Cost Governance
- 4.2.2 Mandatory CFO Oversight of Cloud Budgets After 2024 Audit-Rule Updates
- 4.2.3 GenAI Workload Cost Spikes Raise Urgency for Granular Unit-Economics Tracking
- 4.2.4 Mainstream Adoption of FinOps Framework v4.0 by Hyperscalers
- 4.2.5 Carbon-Aware-GreenOps-Reporting Embedded in FinOps KPIs
- 4.2.6 Rise of Cloud-Native FinOps-as-Code Pipelines Integrated in CI/CD
- 4.3 Market Restraints
- 4.3.1 Shortage of Certified FinOps Practitioners Limits Enterprise Scaling
- 4.3.2 Disparate Billing APIs and Tagging Standards Complicate Data Normalization
- 4.3.3 Resistance from Dev Teams to Real-Time Cost Guardrails Slows Automation
- 4.3.4 Edge and Sovereign-Cloud Data-Locality Rules Fragment Visibility
- 4.4 Industry Value / Supply-Chain Analysis
- 4.5 Regulatory Landscape
- 4.6 Technological Outlook
- 4.7 Porter's Five Forces Analysis
- 4.7.1 Bargaining Power of Suppliers
- 4.7.2 Bargaining Power of Consumers
- 4.7.3 Threat of New Entrants
- 4.7.4 Threat of Substitutes
- 4.7.5 Intensity of Competitive Rivalry
- 4.8 Impact of Macroeconomic Factors
5 MARKET SIZE AND GROWTH FORECASTS (VALUE)
- 5.1 By Component
- 5.1.1 Software
- 5.1.2 Services
- 5.2 By Deployment Type
- 5.2.1 Public Cloud
- 5.2.2 Private Cloud
- 5.2.3 Hybrid / Multi-Cloud
- 5.3 By Organization Size
- 5.3.1 Large Enterprises
- 5.3.2 Small and Medium Enterprises (SMEs)
- 5.4 By End-User Industry
- 5.4.1 IT and Telecommunications
- 5.4.2 Banking, Financial Services and Insurance
- 5.4.3 Retail and E-Commerce
- 5.4.4 Healthcare and Life Sciences
- 5.4.5 Manufacturing
- 5.4.6 Government and Public Sector
- 5.5 By Geography
- 5.5.1 North America
- 5.5.1.1 United States
- 5.5.1.2 Canada
- 5.5.1.3 Mexico
- 5.5.2 South America
- 5.5.2.1 Brazil
- 5.5.2.2 Argentina
- 5.5.2.3 Rest of South America
- 5.5.3 Europe
- 5.5.3.1 Germany
- 5.5.3.2 United Kingdom
- 5.5.3.3 France
- 5.5.3.4 Italy
- 5.5.3.5 Spain
- 5.5.3.6 Russia
- 5.5.3.7 Rest of Europe
- 5.5.4 Asia-Pacific
- 5.5.4.1 China
- 5.5.4.2 Japan
- 5.5.4.3 India
- 5.5.4.4 South Korea
- 5.5.4.5 Australia and New Zealand
- 5.5.4.6 Rest of Asia-Pacific
- 5.5.5 Middle East and Africa
- 5.5.5.1 Middle East
- 5.5.5.1.1 Saudi Arabia
- 5.5.5.1.2 United Arab Emirates
- 5.5.5.1.3 Turkey
- 5.5.5.1.4 Rest of Middle East
- 5.5.5.2 Africa
- 5.5.5.2.1 South Africa
- 5.5.5.2.2 Nigeria
- 5.5.5.2.3 Egypt
- 5.5.5.2.4 Rest of Africa
- 5.5.5.1 Middle East
- 5.5.1 North America
6 COMPETITIVE LANDSCAPE
- 6.1 Market Concentration
- 6.2 Strategic Moves
- 6.3 Market Share Analysis
- 6.4 Company Profiles (includes Global Level Overview, Market Level Overview, Core Segments, Financials as available, Strategic Information, Market Rank/Share, Products and Services, Recent Developments)
- 6.4.1 Apptio, Inc.
- 6.4.2 VMware, Inc. (Broadcom, Inc.)
- 6.4.3 Flexera Software LLC
- 6.4.4 CloudZero, Inc.
- 6.4.5 Densify Inc.
- 6.4.6 Harness Inc.
- 6.4.7 Spot by NetApp, Inc.
- 6.4.8 Microsoft Corporation (Azure Cost Management)
- 6.4.9 Amazon Web Services, Inc. (AWS Cost Explorer)
- 6.4.10 Google LLC (Cost Management Tools)
- 6.4.11 Anodot Ltd.
- 6.4.12 Turbonomic, Inc. (an IBM company)
- 6.4.13 CloudBolt Software, Inc.
- 6.4.14 Yotascale, Inc.
- 6.4.15 Stackwatch, Inc. (Kubecost)
- 6.4.16 ProsperOps, Inc.
- 6.4.17 nOps, Inc.
- 6.4.18 Granulate Cloud Solutions Ltd. (an Intel company)
- 6.4.19 Finout Ltd.
- 6.4.20 Zesty Tech Ltd.
7 MARKET OPPORTUNITIES AND FUTURE OUTLOOK
- 7.1 White-Space and Unmet-Need Assessment
