
|
시장보고서
상품코드
2062355
재생 기유 시장 : 점유율 분석, 업계 동향과 통계, 성장 예측(2026-2031년)Recycled Base Oil - Market Share Analysis, Industry Trends & Statistics, Growth Forecasts (2026 - 2031) |
||||||
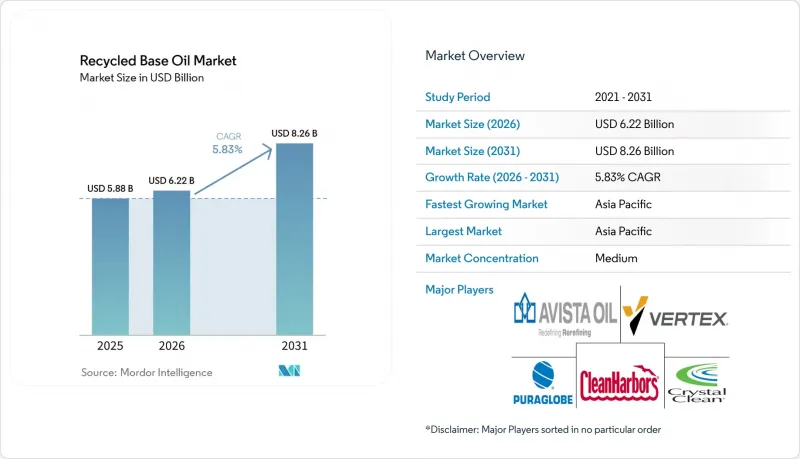
Mordor Intelligence에 의하면, 재생 기유 시장 규모는 2025년에 58억 8,000만 달러로 평가되었고 2026년 62억 2,000만 달러에서 2031년까지 82억 6,000만 달러에 이를 것으로 예측되며, 예측 기간(2026-2031년) CAGR은 5.83%를 나타낼 전망입니다.
본 보고서는 원료원(폐차·엔진 오일 등), 정제 공정(수소화 처리·수소화 정제 등), 용도(윤활유·그리스 배합, 금속 가공유 등), 최종 사용자 산업(자동차 및 운송 장비의 OEM/애프터마켓 등), 지역(아시아태평양, 북미 등)에 따라 분류되어 있습니다. 시장 전망은 금액(달러) 기준으로 제시되어 있습니다.
세계 재생 기유 시장 동향 및 분석
재생 원료 사용을 의무화하는 규제 강화
주 및 국가 규정에 따라 공공 및 민간 차량용 윤활유의 사양이 재정의되고 있습니다. 캘리포니아주는 주 정부 기관에 대해 재생 성분이 최소 25% 이상 포함된 윤활유 구매를 의무화하고 있으며, 이는 미국의 규정입니다. EPA의 종합적 조달 지침을 준수하고 있습니다. 한편, 콜로라도주와 아일랜드는 각각 2024년과 2025년에 유사한 법안을 도입했습니다. 유럽연합 집행위원회는 2025년에 회수된 폐유의 61%가 기초유로 재생되었다고 보고했는데, 이는 50% 미만이었던 과거 평균치에 비해 크게 증가한 수치로, 폐쇄형 재생 시스템으로의 강력한 정책 전환을 반영하고 있습니다. 개정된 FTC 표시 기준에 따르면 재활용 함량을 명확히 공개해야 하며, 이는 그린워싱을 줄이고 조달 과정에서 인증된 재생산 업체의 경쟁력을 높이고 있습니다. 이러한 조치들은 종합적으로 대상 수요를 확대하고, 규정을 준수하는 재정제 업체들을 원자재화 현상으로 인한 가격 압박으로부터 보호합니다.
버진 그룹 I/II 기초유에 비해 비용 경쟁력이 있음
2025년 한 해 동안, 재정제된 그룹 II 기유는 버진 기유에 비해 뚜렷한 가격 경쟁력을 바탕으로 거래되었습니다. 이는 재정제 업체가 원유 증류 비용을 절감하고 경질 증류분으로부터 열 회수를 활용하기 때문입니다. PurePath사의 박막 수소화 처리 장치는 배럴당 제조 비용이 10-30% 저렴하며, 통합된 증기 회수 시스템을 통해 추가적인 에너지 절감 효과도 실현하고 있습니다. 이러한 비용 경쟁력은 수입 버진 오일에 운송비나 관세 할증분이 부과되는 아시아태평양에서 더욱 두드러집니다. EU 배출권 거래 제도(EU ETS)나 아시아의 시범 사업 등 탄소 가격 메커니즘을 고려할 때, 재정제 업체가 달성하는 37-82%의 생애주기 CO2 감축은 이익률을 직접적으로 향상시킵니다.
개발도상 지역의 재정제 능력 부족
신흥 경제국에서는 대량의 폐유가 발생하고 있지만, 충분한 수소화 처리 인프라가 갖춰져 있지 않습니다. 예를 들어, 중국에서는 2024년 기준 70만 9,000톤의 명목 처리 능력에 비해 가동률은 고작 11.5%에 그쳤습니다. 이는 소규모 산·점토 처리 시설이 더욱 엄격해진 허가 요건을 충족하지 못했기 때문입니다. 마찬가지로, 인도에서는 2025년에 300만-400만 톤의 폐유가 발생했으나, 정식 재정제 업체가 처리할 수 있었던 양은 50만 톤에 불과했으며, 그 대부분은 저가 연료나 수출 경로로 흘러갔습니다. YUNITCO의 20만 톤 규모 얀부 확장 계획과 계획 중인 10만 톤 규모의 카이로 시설이 있더라도, 이러한 프로젝트로 처리할 수 있는 양은 지역 전체 폐유 발생량의 15% 미만에 그쳐, 지속적인 처리 능력 부족이 여실히 드러나고 있습니다.
부문별 분석
2025년, 사용 후 자동차 및 엔진 오일은 확립된 딜러 및 퀵 루브(퀵 오일 교환) 회수 네트워크의 지원을 받아 재생 기유 시장 점유율의 46.22%를 차지했습니다. 이에 비해, 지방산 분획 및 기타 바이오 오일은 2031년까지 연평균 성장률(CAGR) 5.88%를 나타낼 것으로 예측되며, 원료 중 가장 높은 성장률을 보이고 있습니다. 이러한 증가는 재생 가능 성분 크레딧을 수익화하고 공동 처리 시험을 촉진하는 저탄소 연료 기준에 힘입은 것입니다. 중국의 폐유 흐름은 유해 폐기물 추적이 철강 및 전력 산업으로 확대되고 있음에도 불구하고, 여전히 90%가 엔진 오일에서 비롯됩니다.
광물계 재정제 기유(RRBO)에 10-30%의 바이오 오일을 혼합하는 파일럿 프로젝트에서는 API 그룹 II/III 규격을 충족하면서도 캘리포니아주의 LCFS 크레딧 대상이 되는 하이브리드 기유가 생산되고 있습니다. 이러한 시범 프로젝트는 탄소 배출권 가치가 이산화탄소 환산 기준 톤당 50달러를 초과할 경우, 상업적 규모로 확대될 가능성이 있습니다. 변압기유나 선박용유와 같은 특수 용도의 오일은 유틸리티체나 해운사가 감사할 수 있는 폐쇄형 루프 용도로 전환됨으로써 높은 수익률을 실현하고 있습니다.
2025년 기준으로 수소 처리/수소 정제는 재생 기유 시장 규모의 48.13%를 차지하고 있으며, 2031년까지 연평균 성장률(CAGR) 6.03%를 나타낼 것으로 예측됩니다. 이러한 성장은 그룹 III 규격을 충족하기 위해 포화 탄화수소 및 점도 지수를 개선하는 수소화 설비에 대한 투자를 통해 뒷받침되고 있습니다. 비용 효율을 중시하는 시장에서는 여전히 산·점토법이 채택되고 있지만, 유황 배출 규제가 강화됨에 따라 가동 중단 압력이 커지고 있습니다. PURAGLOBE사의 ‘박막법 + 수소 처리’ 공정은 점도 지수 120 이상, 황 함량 10ppm 이하를 달성하여 새로운 품질 기준을 확립했습니다.
Clean Harbors사의 2억 1,000만-2억 2,000만 달러 규모의 용제 탈아스팔트화 설비 개조를 통해 2028년까지 600N의 중질 기유가 생산될 전망이며, 이를 통해 대형 디젤차용 및 기어 오일 시장에서의 비즈니스 기회가 열릴 것입니다. YUNITCO사와 인도의 각 정유사는 구형 중성 점토계 시스템을 피하고 Euro 6 윤활유 규격을 충족하기 위해 수소 처리 공정을 채택하고 있습니다.
지역별 분석
아시아태평양은 2025년에 전 세계 매출의 34.77%를 차지해 2031년까지 연평균 성장률(CAGR) 6.22%로 성장할 전망입니다. 중국에서는 2025년에 510만 8,000톤의 폐유(134억 9,500만 위안, 18억 9,000만 달러 상당)이 회수될 것으로 예상되며, 2026년에는 532만 2,000톤(142억 3,100만 위안/19억 9,000만 달러 상당)에 달할 것으로 전망됩니다. 이러한 성장은 유해 폐기물 디지털 추적 시스템과 국영 기업(SOE) 간의 합작 투자에 힘입어 이루어지고 있습니다. 인도에서는 HPCL-Castrol과 Indian Oil-Re Sustainability가 2026년에 체결한 양해각서(MOU)에 따라, 수입 의존도를 낮추기 위해 5만-10만 톤 규모의 그룹 II+ 수소화 처리 설비 설치를 목표로 하고 있습니다.
북미는 성숙한 시장이지만, 품질 향상에 주력하고 있습니다. 클린 하버스는 2025년에 2억 4,300만 갤런을 처리할 예정이며, 점도 600N 제품의 생산에 투자하고 있습니다. 버텍스 에너지는 2025년 11월, 앨라배마주 모빌에 위치한 시설에서 그룹 III 등급의 VTX-R4 및 VTX-R6를 출시하여, OEM의 탄소 배출 규제에 대응하고자 합니다.
유럽의 61%라는 재활용률은 규제 압력을 반영하고 있습니다. PURAGLOBE사의 HyLube3 기술은 쉘(Shell)사와의 12년 장기 공급 계약에 따라 그룹 III 기유 공급을 뒷받침하고 있으며, 해당 지역 내 고품질 재생 기유 개발에 박차를 가하고 있습니다.
중동 및 아프리카는 생산 능력 부족 문제를 해결하는 데 달려 있습니다. YUNITCO가 2026년까지 얀부 공장을 20만 톤 규모로 확장하고, 2027년까지 카이로에 10만 톤 규모의 신규 프로젝트를 추진하는 것은 해당 지역에서 가장 큰 규모의 투자이지만, 그럼에도 불구하고 걸프 국가 및 북아프리카의 폐유 발생량의 15% 미만을 처리하는 데 그치고 있습니다. 남미에서는 브라질의 Lwart사가 연간 3억 6,000만 리터 규모로 확장하기 위해 10억 레알을 투자하는 계획이 이 지역의 노력을 상징하고 있지만, 인근 국가들은 여전히 수입에 의존하고 있습니다.
기타 혜택:
- 엑셀 형식 시장 예측(ME) 시트
- 3개월간의 애널리스트 지원
자주 묻는 질문
목차
제1장 서론
제2장 조사 방법
제3장 주요 요약
제4장 시장 구도
제5장 시장 규모와 성장 예측
제6장 경쟁 구도
제7장 시장 기회와 향후 전망
JHSAccording to Mordor Intelligence, the recycled base oil market size was valued at USD 5.88 billion in 2025 and is estimated to grow from USD 6.22 billion in 2026 to reach USD 8.26 billion by 2031, at a CAGR of 5.83% during the forecast period (2026-2031).

This report is Segmented by Feedstock Source (Used Motor/Engine Oil, and More), Refining Process (Hydrotreating/Hydro-refining, and More), Application (Lubricant and Grease Blending, Metal-Working Fluids, and More), End-User Industry (Automotive and Transportation OEM/Aftermarket, and More), and Geography (Asia-Pacific, North America, and More). The Market Forecasts are Provided in Terms of Value (USD).
Global Recycled Base Oil Market Trends and Insights
Increasing Regulations Mandating Recycled Content
State and national regulations are redefining lubricant specifications for public and private fleets. California requires state agencies to purchase lubricants containing at least 25% re-refined content, aligning with the U.S. EPA Comprehensive Procurement Guideline, while Colorado and Ireland introduced similar statutes in 2024 and 2025, respectively The European Commission reported that 61% of collected waste oil was regenerated into base stock in 2025, a significant increase from historical averages below 50%, reflecting a strong policy shift toward closed-loop regeneration. Updated FTC labeling standards now mandate explicit recycled-content disclosure, reducing greenwashing and improving the competitiveness of certified re-refiners in procurement processes. Collectively, these measures expand addressable demand and protect compliant re-refiners from commoditized pricing pressures.
Cost Advantage vs. Virgin Group I/II Base Oils
Throughout 2025, re-refined Group II oils traded at a noticeable discount compared to virgin counterparts, as re-refiners avoid crude-distillation costs and utilize heat recovery from light distillates. PurePath's thin-film hydrotreaters report 10-30% lower manufacturing costs per barrel, with additional energy savings through integrated vapor recovery. The cost advantage is more pronounced in Asia-Pacific, where imported virgin oils incur freight and tariff premiums. When carbon pricing mechanisms, such as the EU ETS and pilot schemes in Asia, are factored in, the lifecycle CO2 reductions of 37-82% achieved by re-refiners directly enhance margins.
Insufficient Re-Refining Capacity in Developing Regions
Emerging economies generate significant volumes of waste oil but lack adequate hydrotreating infrastructure. For example, China's nominal capacity of 709,000 tons operated at only 11.5% utilization in 2024, as small acid-clay plants failed to meet stricter permitting requirements. Similarly, India generated 3-4 million tons of waste oil in 2025, but formal re-refiners could process only 500,000 tons, leaving the majority to low-value fuel or export streams. Even with YUNITCO's 200,000-ton Yanbu expansion and a planned 100,000-ton Cairo facility, these projects will address less than 15% of regional waste oil generation, underscoring persistent capacity shortfalls.
Other drivers and restraints analyzed in the detailed report include:
- OEM Scope-3 Carbon-Cut Targets Favoring RRBO
- Thin-Film Hydrotreating Unlocking Group III RRBO
- Substitution Threat from Bio-Based Esters and PAGs
For complete list of drivers and restraints, kindly check the Table Of Contents.
Segment Analysis
Used motor and engine oil accounted for 46.22% of the recycled base oil market share in 2025, supported by established dealership and quick-lube collection networks. In comparison, fatty-acid distillates and other bio-oils are projected to grow at a 5.88% CAGR through 2031, representing the fastest growth among feedstocks. This increase is driven by low-carbon fuel standards that monetize renewable-content credits and encourage co-processing trials. China's waste-oil stream remains 90% engine-oil-derived as hazardous-waste tracking expands to steel and power industries.
Pilot blending 10-30% bio-oil with mineral re-refined base oil (RRBO) is producing hybrid base oils that meet API Group II/III specifications while qualifying for California LCFS credits. These pilot projects could scale commercially if credit values exceed USD 50 per ton CO2-equivalent. Specialty streams, such as transformer and marine oils, command premium margins when repurposed into closed-loop applications that utilities and shipping companies can audit.
Hydrotreating/hydro-refining accounted for 48.13% of the recycled base oil market size in 2025 and is expected to grow at a 6.03% CAGR through 2031. This growth is supported by investments in hydrogen units that enhance saturates and viscosity index to meet Group III standards. While acid-clay processes persist in cost-sensitive markets, they face increasing shutdown pressures due to tightening sulfur regulations. PURAGLOBE's thin-film-plus-hydrotreat process has set a new quality benchmark, achieving a viscosity index above 120 and sulfur levels below 10 ppm.
Clean Harbors' USD 210-220 million solvent de-asphalting retrofit is expected to produce 600N heavy base oil by 2028, opening opportunities in heavy-duty diesel and gear-oil markets. YUNITCO and Indian refiners are bypassing outdated neutral-clay systems and adopting hydrotreatment processes to align with Euro 6 lubricant standards.
Geography Analysis
Asia-Pacific generated 34.77% of global revenue in 2025 and will ascend at a 6.22% CAGR through 2031. China collected 5.108 million tons of waste oil valued at CNY 13.495 billion (USD 1.89 billion) in 2025, with projections of 5.322 million tons worth CNY 14.231 billion (USD 1.99 billion) in 2026. This growth is driven by digital hazardous-waste tracking and state-owned enterprise (SOE) joint ventures. India's 2026 MOUs between HPCL-Castrol and Indian Oil-Re Sustainability aim to establish 50,000-100,000-ton Group II+ hydrotreaters to reduce import dependency.
North America, while a mature market, is focusing on quality improvements. Clean Harbors processed 243 million gallons in 2025 and is investing in high-viscosity 600N production. Vertex Energy introduced Group III grades VTX-R4 and VTX-R6 in November 2025 from its Mobile, Alabama facility, targeting OEM carbon mandates.
Europe's 61% regeneration rate reflects regulatory pressures. PURAGLOBE's HyLube3 technology anchors Group III supply under a 12-year Shell offtake agreement, supporting the region's focus on high-quality recycled base oils.
The Middle-East and Africa hinge on capacity gap closures. YUNITCO's Yanbu expansion to 200,000 tons by 2026 and a 100,000-ton Cairo greenfield project by 2027 represent the region's largest investments but still address less than 15% of Gulf and North African waste-oil generation. In South America, Brazil's BRL 1 billion expansion by Lwart to 360 million liters per year highlights regional efforts, though neighboring countries remain reliant on imports.
- AVISTA OIL Deutschland GmbH
- CLEAN HARBORS, INC.
- Crystal Clean, Inc
- Exxon Mobil Corporation
- GFL Environmental Inc.
- Hemraj Petrochem Pvt. Ltd.
- Hydrodec Group
- Lwart Environmental Solutions
- Oil Salvage Ltd
- PURAGLOBE
- Shell plc
- Slicker Recycling
- Southern Oil
- Universal Lubricants
- Valvoline
- Vertex Energy
Additional Benefits:
- The market estimate (ME) sheet in Excel format
- 3 months of analyst support
TABLE OF CONTENTS
1 Introduction
- 1.1 Study Assumptions and Market Definition
- 1.2 Scope of the Study
2 Research Methodology
3 Executive Summary
4 Market Landscape
- 4.1 Market Overview
- 4.2 Market Drivers
- 4.2.1 Increasing regulations mandating recycled content
- 4.2.2 Cost advantage vs. virgin Group I/II base oils
- 4.2.3 OEM Scope-3 carbon-cut targets favouring RRBO
- 4.2.4 Thin-film hydrotreating unlocking Group III RRBO
- 4.2.5 Government fleet GPP recycled-content mandates
- 4.3 Market Restraints
- 4.3.1 Insufficient re-refining capacity in developing regions
- 4.3.2 Substitution threat from bio-based esters and PAGs
- 4.3.3 Basel-driven restrictions on used-oil exports
- 4.4 Value Chain Analysis
- 4.5 Regulatory Landscape
- 4.6 Porter's Five Forces
- 4.6.1 Bargaining Power of Suppliers
- 4.6.2 Bargaining Power of Buyers
- 4.6.3 Threat of New Entrants
- 4.6.4 Threat of Substitutes
- 4.6.5 Competitive Rivalry
5 Market Size and Growth Forecasts (Value)
- 5.1 By Feedstock Source
- 5.1.1 Used Motor/Engine Oil
- 5.1.2 In-Plant Process and Industrial Oils
- 5.1.3 Fatty-Acid Distillates and Bio-oils
- 5.1.4 Other Waste Oils (Marine, Transformer etc.)
- 5.2 By Refining Process
- 5.2.1 Hydrotreating/Hydro-refining
- 5.2.2 Acid-Clay Treating
- 5.2.3 Resin De-wax/De-color
- 5.2.4 Other Proprietary Processes (Revivoil, Vaxon, etc.)
- 5.3 By Application
- 5.3.1 Lubricant and Grease Blending
- 5.3.2 Metal-working Fluids (Cutting, Forming)
- 5.3.3 Hydraulic and Transformer Oils
- 5.3.4 Industrial Machinery Lubrication
- 5.3.5 Other Applications (Rubber Process, Process Oils)
- 5.4 By End-user Industry
- 5.4.1 Automotive and Transportation OEM/Aftermarket
- 5.4.2 Industrial Manufacturing and Heavy Equipment
- 5.4.3 Power Generation and Utilities
- 5.4.4 Oilfield and Drilling Services
- 5.4.5 Marine and Shipping
- 5.4.6 Other End-user Industries (Rail, Aviation, Defense)
- 5.5 By Geography
- 5.5.1 Asia-Pacific
- 5.5.1.1 China
- 5.5.1.2 India
- 5.5.1.3 Japan
- 5.5.1.4 South Korea
- 5.5.1.5 ASEAN Countries
- 5.5.1.6 Rest of Asia-Pacific
- 5.5.2 North America
- 5.5.2.1 United States
- 5.5.2.2 Canada
- 5.5.2.3 Mexico
- 5.5.3 Europe
- 5.5.3.1 Germany
- 5.5.3.2 United Kingdom
- 5.5.3.3 France
- 5.5.3.4 Italy
- 5.5.3.5 Spain
- 5.5.3.6 Russia
- 5.5.3.7 Rest of Europe
- 5.5.4 South America
- 5.5.4.1 Brazil
- 5.5.4.2 Argentina
- 5.5.4.3 Rest of South America
- 5.5.5 Middle-East and Africa
- 5.5.5.1 Saudi Arabia
- 5.5.5.2 South Africa
- 5.5.5.3 Rest of Middle-East and Africa
- 5.5.1 Asia-Pacific
6 Competitive Landscape
- 6.1 Market Concentration
- 6.2 Strategic Moves
- 6.3 Market Share (%)/Ranking Analysis
- 6.4 Company Profiles (includes Global level Overview, Market level overview, Core Segments, Financials as available, Strategic Information, Products and Services, and Recent Developments)
- 6.4.1 AVISTA OIL Deutschland GmbH
- 6.4.2 CLEAN HARBORS, INC.
- 6.4.3 Crystal Clean, Inc
- 6.4.4 Exxon Mobil Corporation
- 6.4.5 GFL Environmental Inc.
- 6.4.6 Hemraj Petrochem Pvt. Ltd.
- 6.4.7 Hydrodec Group
- 6.4.8 Lwart Environmental Solutions
- 6.4.9 Oil Salvage Ltd
- 6.4.10 PURAGLOBE
- 6.4.11 Shell plc
- 6.4.12 Slicker Recycling
- 6.4.13 Southern Oil
- 6.4.14 Universal Lubricants
- 6.4.15 Valvoline
- 6.4.16 Vertex Energy
7 Market Opportunities and Future Outlook
- 7.1 White-space and Unmet-Need Assessment
