
|
시장보고서
상품코드
2062360
소다회 시장 : 점유율 분석, 업계 동향과 통계, 성장 예측(2026-2031년)Soda Ash - Market Share Analysis, Industry Trends & Statistics, Growth Forecasts (2026 - 2031) |
||||||
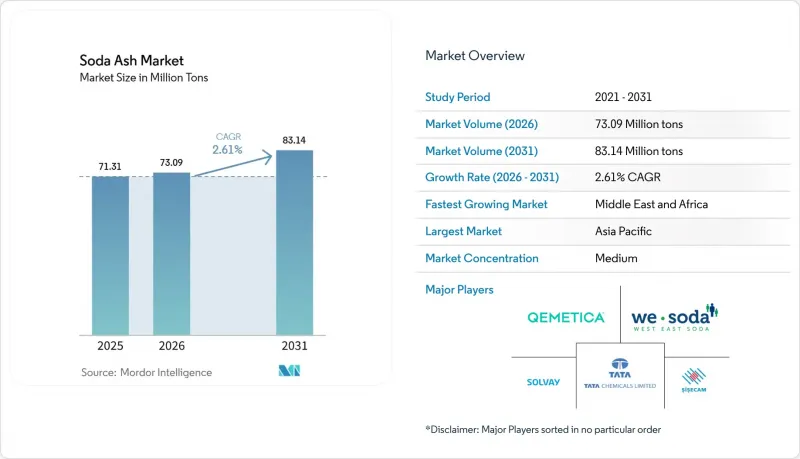
Mordor Intelligence에 의하면, 소다회 시장 규모는 2025년에 7,131만 톤, 2026년에 7,309만 톤이 되어, 2031년까지 8,314만 톤에 이를 것으로 예측되며, 2026년부터 2031년까지 CAGR 2.61%로 성장할 전망입니다.
본 보고서는 유형(경소다회, 중소다회), 원료(천연(트로나 유래), 합성(솔베이법, 보법, 듀얼 프로세스법)), 용도(유리 제조, 세제·비누 등), 최종 사용자 산업(건축 및 건설, 자동차 등), 지역(아시아태평양, 북미 등)별로 분류되어 있습니다. 시장 전망은 수량(톤) 기준으로 제시되어 있습니다.
세계 소다회 시장 동향 및 분석
판유리, 용기용 유리 및 태양광 유리에 대한 수요 급증
세계 태양광 발전 설비의 확대는 원자재의 흐름을 완전히 바꾸고 있습니다. 신규 태양광 발전 용량 1GW당 약 75kt의 초고투명 유리가 필요하기 때문에 소다회 순도 규격이 상향 조정되면서 고밀도 등급 공급 시 가격 차이가 확대되고 있습니다. 소다회 산업에서 용기용 유리 시장의 성장은 일회용 플라스틱보다 무한히 재활용이 가능한 유리를 선호하는 음료 및 의약품 포장 시장의 호조세에 힘입고 있습니다. 2024년 중국의 플로트 및 평판유리 재고가 6,866만 중량 케이스에 달한다는 사실은 이 지역 시장 규모를 여실히 보여주는 한편, 개발업체들이 부동산에 대한 노출을 조정함에 따라 주기적인 변동이 발생하고 있음을 시사합니다. 자동차용 유리 및 저방사율 건축용 파사드의 업그레이드에 따라 에너지 절약 코팅의 도입이 확대되고 있으며, 기존 배합에 비해 평방미터당 소다회 사용량이 증가하고 있습니다. 이 모든 요소를 종합해 보면, 전 세계 소다회 사용량의 절반 이상이 유리 밸류체인에 포함되어 있어, 소다회 시장이 유리 투자 주기에 민감하게 반응하는 요인이 되고 있습니다.
신흥국의 분말 세제 시장 회복
인도, 인도네시아, 나이지리아에서 가정용 자동 세탁기의 보급률이 증가함에 따라, 경수 지역에서 액체 세제보다 뛰어난 성능을 발휘하는 고알칼리성 분말 세제에 대한 소다회 시장 수요가 회복되고 있습니다. 현지 배합 제조업체들은 단위당 소다회 함량이 높은 고밀도 분말로 전환하고 있으며, 이로 인해 대형 세제 제조업체들의 수직 통합에 대한 유인이 커지고 있습니다. 도시화는 브랜드의 프리미엄화를 촉진하고 있지만, 농촌 지역의 판매 채널에서는 여전히 비용 효율성이 중시되고 있어, 제올라이트의 경도를 상쇄하는 pH 조절제로 소다회가 선호되는 경향이 있습니다. 자체적으로 소다회를 조달할 수 있는 다국적 기업들은 급변하는 운임으로 인해 수입에 의존하는 블렌드 제조업체들의 납품 비용이 상승하는 상황에서도 이익률을 유지하고 있습니다. 남미에서 세제 내 인산염을 단계적으로 폐지하려는 규제 움직임은 친환경 라벨 기준을 충족하는 알칼리계 시스템을 통해 소다회 대체 가능성을 더욱 높이고 있습니다.
높은 CO2 배출량과 강화되는 배출 규제
EU 배출권 거래제 하에서는 소다회 공장이 배출하는 CO2 1톤당 배출권을 구매해야 하며, 이로 인해 솔베이 공법의 이익률이 크게 압박받고 있어 생산 능력 감축이 촉진되고 있습니다. 동시에, 유리 제조업체는 스코프 1의 과세 대상이기도 합니다. 이는 용광로 내에서 탄산나트륨이 탈탄산 반응을 일으키기 때문이며, 이로 인해 밸류체인 전반에 걸친 탄소 규제 대응 부담이 두 배로 늘어날 것입니다. 가성소다 등의 대체 알칼리는 폐기물 처리나 염소 제품과 관련된 문제를 안고 있어, 이러한 점들이 대체재의 경제성을 저해하는 요인이 되고 있습니다. 탄소 포집 실증 실험에는 기대가 걸리지만, 연간 생산 능력 100만 톤당 약 1억 2,000만 달러에 달하는 높은 자본 집약도는 특히 아시아의 중견 기업들에게 재정적 부담을 주고 있습니다. 획기적인 배출 저감 기술이 없다면, 규제 강화로 인해 합성 소다회 생산 확대가 억제되고, 고비용 공장은 세계 소다회 시장에서 퇴출될 가능성이 있습니다.
부문별 분석
2024년 현재, 고밀도 등급은 소다회 시장의 57.78%를 차지하고 있으며, 이는 우수한 취급 특성과 분진 배출량 감소로 인해 플로트 유리 용로의 연속 운전이 가능해졌음을 반영하고 있습니다. 부피 밀도가 높아 톤당 운송 비용이 낮아지고, 물류 효율이 향상됩니다. 컨테이너 부족으로 인해 해운 운임이 상승하고 있는 상황에서 이는 결정적인 이점이 됩니다. 라이트 그레이드 시장은 2030년까지 연평균 성장률(CAGR) 3.89%를 나타낼 것으로 예측되며, 빠른 용해로 인해 공정 경제성이 향상되는 도시 지역의 수질 연화 프로젝트를 수주하고 있습니다. 유리 용해로에서는 노심부의 침적을 방지하기 위해 일관된 입도 분포가 필요하기 때문에 명목상의 가격 프리미엄이 있음에도 불구하고 고밀도 등급의 우위가 확고하게 자리 잡고 있습니다. 경질 소다회(Na₂CO₃)는 용해 속도가 빠른 것이 요구되는 세제 생산 분야에서 계속해서 혜택을 보고 있지만, 전 세계 수요량에서 유리 산업이 압도적인 견인력을 발휘하고 있기 때문에 그 시장 규모에는 여전히 한계가 있습니다.
고농도 등급에서의 경쟁 우위는 균일한 화학 성분을 지닌 대량의 원료를 공급할 수 있는 트로나 광산 업체에 유리하게 작용하며, 이로 인해 지역적인 가격 경쟁의 영향을 덜 받게 됩니다. 생산자들은 공급망 전반에 걸쳐 밀도의 안정성을 유지하기 위해 밀폐형 공기 이송 시스템에 대한 투자를 확대되고 있습니다. 한편, 라이트 그레이드 제조업체들은 전자기기용 및 의약품 충전재용 초미세 특수 분말 분야로 사업을 다각화하며, 이익률을 일반 상품 수준 이상으로 끌어올리려 하고 있습니다. 두 등급 모두 동일한 원료를 사용하지만, 결정화 및 건조 공정의 차이로 인해 각기 다른 비용 곡선이 형성되며, 이것이 소다회 시장의 가격대를 결정짓고 있습니다.
2024년 기준 합성 소다회 제조 시설의 매출 점유율은 61.12%를 유지했으나, ESG 조달 요건 및 에너지 가격 불균형으로 인해 천연 소다회 공급업체들은 연평균 성장률(CAGR) 4.12%라는 가장 높은 성장 궤도에 올라 있습니다. 유틸리티체와 유리 제조업체들이 스코프 3 목표 달성을 위해 저탄소 원료를 조달함에 따라, 천연 등급 소다회 시장 규모는 확대될 것으로 전망됩니다. 와이오밍주 그린리버 분지의 트로나 자원은 향후 수 세기에 걸쳐 전 세계 수요를 충족시킬 수 있어, 수입에 의존하는 유럽의 구매자들에게 공감을 불러일으키는 공급 안정성의 근거가 되고 있습니다.
합성 소다회 기존 제조업체들은 탄소세 인상과 원자재 가격 변동에 직면해 있으며, 2030년까지 배출량을 50% 감축하는 것을 목표로 하는 솔베이사의 전기 가마 도입 등 개선 프로그램이 추진되고 있습니다. 천연자원 채굴에는 물 사용량 감축 및 화학 시약 사용 제한과 같은 장점이 있으며, 이는 그린 파이낸스 체계에서 엄격하게 검토되는 두 가지 요소입니다. 튀르키예와 말레이시아 반도에서 용액 채굴에 대한 투자가 급증하고 있는 것은 지질학적 광상으로의 자본 이동을 여실히 보여주고 있습니다. 예측 기간 동안 합성 소다회 생산 능력의 합리화가 진행될 것으로 예상되며, 비용이 높은 아시아 생산 거점이 가장 큰 영향을 받게 될 것이므로, 소다회 시장에서 천연 소다회 제조업체의 경쟁 우위가 더욱 강화될 것입니다.
지역별 분석
아시아태평양은 2024년 세계 소비량의 43.12%를 차지했으며, 연간 생산량 3,600만 톤으로 세계 최대의 생산국이자 최종 소비국이라는 중국의 이중적 역할에 힘입었습니다. 인도 소다회 시장의 명목 소비량은 부동산 착공 및 식품 포장용 용기 유리 수요에 힘입어 2024년도에는 전년 대비 4.1% 증가한 414만 톤에 달했습니다. 일본과 한국은 특수 유리 및 전자기기 분야의 안정적인 고수익률 수요를 주도하며, 지역 평균 판매 가격의 안정화에 기여하고 있습니다.
북미는 와이오밍주를 거점으로 하는 천연 원료에 따른 비용 우위의 혜택을 누리고 있습니다. 해당 주에서는 2024년에 25억 달러 상당의 트로나 유래 소다회 1,200만 톤이 유통되었습니다. 미국에서 라틴아메리카 및 동아시아로 향하는 수출 경로는 환율 헤지의 이점을 누리고 있는 반면, 캐나다에서는 플로트 유리의 부활이 내수 시장을 확보하고 있습니다. 멕시코는 성장하는 음료 산업에 공급되는 용기용 유리 용광로 원료를 미국으로부터 수입에 의존하고 있어, 소다회 시장의 국경을 초월한 공급 상호 의존 관계를 강화하고 있습니다.
중동 및 아프리카는 사우디아라비아의 ‘비전 2030’과 UAE의 산업 전략에 따라 평판유리 및 유리 섬유 시설에 대한 설비 투자가 집중됨에 따라, 2030년까지 연평균 성장률(CAGR) 3.78%로 성장할 것으로 전망됩니다. 튀르키예의 용액 채굴을 통한 생산 능력은 이 나라를 지역 공급국이자 전 세계적인 스윙 수출국으로 자리매김하게 하여, 배출 규제 압박을 받고 있는 유럽의 국내 합성 플랜트에 대한 의존도를 완화하고 있습니다. 남아프리카공화국의 자동차 및 건설 부문 회복에 힘입어 사하라 이남 시장의 소다회 수요가 증가하고 있습니다. 한편, 나이지리아에서는 수처리용 등급에 대한 수요가 점차 나타나고 있습니다. 에너지 비용 부담에 시달리고 있는 유럽은 운송 위험을 감수하고 수입 천연 소다회로의 전환을 추진하고 있으며, 이러한 재조정으로 인해 소다회 시장의 대서양 횡단 무역 루트가 재편되고 있습니다.
기타 혜택:
- 엑셀 형식 시장 예측(ME) 시트
- 3개월간의 애널리스트 지원
자주 묻는 질문
목차
제1장 서론
제2장 조사 방법
제3장 주요 요약
제4장 시장 구도
제5장 시장 규모와 성장 예측
제6장 경쟁 구도
제7장 시장 기회와 향후 전망
JHS 26.06.19According to Mordor Intelligence, the soda ash market size is projected to be 71.31 Million tons in 2025, 73.09 Million tons in 2026, and reach 83.14 Million tons by 2031, growing at a CAGR of 2.61% from 2026 to 2031.

This report is Segmented by Type (Light Soda Ash, Dense Soda Ash), Source (Natural (Trona-Based), Synthetic (Solvay, Hou, Dual-Process)), Application (Glass Manufacturing, Detergents and Soaps, and More), End-User Industry (Building and Construction, Automotive, and More), and Geography (Asia-Pacific, North America, and More). The Market Forecasts are Provided in Terms of Volume (tons).
Global Soda Ash Market Trends and Insights
Surging Demand for Flat, Container and Solar Glass
Global photovoltaic build-outs are rewiring raw-material flows as every GW of new solar capacity requires roughly 75 kt of ultra-clear glass, pushing soda ash purity specifications higher and widening price differentials for dense grade supply. Container glass growth in the soda ash industry rides buoyant beverage and pharmaceutical packaging trends that favor infinitely recyclable glass over single-use plastics. Chinese float-flat inventories of 68.66 million weight cases in 2024 underscore the scale of the regional base yet also hint at cyclical volatility as developers modulate real-estate exposure. Automotive glazing upgrades alongside low-emissivity architectural facades continue to integrate energy-saving coatings that raise soda ash volume per square meter relative to legacy formulations. Collectively, these outlets lock more than half of global soda ash volumes into glass value chains, amplifying the sensitivity of the soda ash market to glazing investment cycles.
Rebound in Powdered Detergents in Emerging Economies
Rising household penetration of automatic washing machines in India, Indonesia and Nigeria revives demand in the soda ash market for high-alkalinity powdered formats that outperform liquids in hard-water regions. Local formulators are pivoting toward denser powders that carry higher soda ash loadings per unit, strengthening backward-integration incentives for detergent majors. Urbanization supports brand premiumization, yet rural channels still prize cost efficiency, locking in soda ash as the preferred pH builder that offsets zeolite hardness. Multinationals with captive ash supply enjoy margin insulation as volatile freight rates inflate delivered costs for import-reliant blenders. Regulatory movements to phase out phosphates in South American detergents further raise soda ash substitution potential through eco-label compliant alkaline systems.
High CO2 Footprint and Tightening Emission Norms
Under the EU Emissions Trading System, soda ash plants must purchase allowances for each ton of CO2 released, sharply eroding Solvay-process margins and encouraging capacity curtailments. Glass producers simultaneously face scope-1 levies because sodium carbonate decarbonates inside furnaces, doubling the carbon-compliance burden along the value chain. Alternative alkali such as caustic soda presents disposal and chlorine co-product challenges that undercut replacement economics. Carbon capture pilots show promise, yet capital intensity near USD 120 million per 1 Mt of annual capacity strains balance sheets, particularly for mid-size Asian operators. Absent breakthrough abatement technologies, regulatory tightening could cap synthetic output growth and marginalize high-cost plants from the global soda ash market.
Other drivers and restraints analyzed in the detailed report include:
- Capacity Additions in Lithium Carbonate (EV Batteries)
- Emerging Sodium-Ion and Thermal Energy-Storage Uses
- Global Over-Capacity Led by China and Turkiye Price Pressure
For complete list of drivers and restraints, kindly check the Table Of Contents.
Segment Analysis
Dense grade accounted for 57.78% share of the soda ash market in 2024, reflecting its superior handling profile and reduced dust emissions that enable continuous float-glass furnace operation. Logistics efficiency rises because higher bulk density lowers freight cost per active ton, a decisive advantage as container shortages inflate shipping premiums. Light grade is projected to grow at a 3.89% CAGR to 2030, capturing municipal water-softening projects where rapid dissolution improves process economics. Glass furnaces require consistent granulometry to avoid throat build-up, cementing dense-grade incumbency despite its nominal price premium. Light soda ash continues to benefit from detergent production that favors faster solubility, yet its market ceiling remains capped by glass's dominant pull on global volumes.
Competitive positioning in dense grade tilts toward trona miners able to offer large parcels of uniform chemistry, insulating them from regional price skirmishes. Producers are investing in enclosed pneumatic loading systems to preserve density integrity through the supply chain. Light-grade manufacturers, meanwhile, diversify into micronized specialty powders for electronics and pharmaceutical fillers, attempting to lift margins above commodity thresholds. Although both grades share common raw materials, divergent crystallization and drying regimes create unique cost curves that dictate pricing corridors within the soda ash market.
Synthetic facilities retained 61.12% revenue share in 2024, yet natural suppliers are on track for the fastest 4.12% CAGR thanks to ESG procurement mandates and energy-price asymmetry. The soda ash market size for natural grades is projected to swell as utilities and glassmakers source low-carbon raw materials to meet Scope-3 targets. Trona resources in Wyoming's Green River Basin can sustain global demand for centuries, underpinning supply-security narratives that resonate with import-dependent European buyers.
Synthetic incumbents confront rising carbon levies and feedstock volatility, spurring retrofit programs such as Solvay's electrified kilns that aim for 50% emission cuts by 2030. Natural extraction's warrant includes lower water usage and limited chemical reagents, two parameters scrutinized by green-finance frameworks. Investment surges into solution mining in Turkiye and Peninsular Malaysia illustrate capital rotation toward geological ore bodies. Over the forecast horizon, synthetic capacity rationalization is expected, with high-cost Asian units most exposed, sharpening the competitive edge enjoyed by natural-grade participants within the soda ash market.
Geography Analysis
Asia-Pacific retained 43.12% share of global consumption in 2024, underpinned by China's twin role as the largest producer and end-user at 36 Mt of annual output. India's apparent consumption in the soda ash market grew 4.1% year-on-year to 4.14 Mt in FY 2024, buoyed by real-estate starts and container-glass demand for food packaging. Japan and South Korea contribute steady high-margin offtake for specialty glass and electronics, stabilizing regional average selling prices.
North America benefits from natural-grade cost leadership anchored in Wyoming, where 12 Mt of trona-based soda ash valued at USD 2.5 billion moved in 2024. U.S. export corridors into Latin America and East Asia capture currency-hedging advantages, while Canada's float-glass revival secures local off-take. Mexico leans on U.S. imports for container-glass furnaces that supply an expanding beverage sector, reinforcing cross-border supply interdependence within the soda ash market.
The Middle East and Africa is forecast to grow at 3.78% CAGR through 2030 as Saudi Vision 2030 and UAE industrial strategies channel capex toward flat-glass and fiberglass facilities. Turkiye's solution-mined capacity positions the country as both regional supplier and global swing exporter, diluting European reliance on domestic synthetic plants under emission pressure. South Africa's automotive and construction recoveries lift soda ash call in sub-Saharan markets, while Nigeria signals nascent demand for water-treatment grades. Europe, squeezed by energy costs, pivots toward imported natural soda ash despite freight exposure, a rebalancing that re-shapes trans-Atlantic trade lanes in the soda ash market.
- ANSAC (American Natural Soda Ash Corp.)
- Botswana Ash South Africa (PTY) Ltd.
- Genesis Energy
- GHCL Limited
- Inner Mongolia Yuanxing Energy
- NIRMA
- QEMETICA
- Shandong Haihua Group Co., Ltd.
- Sisecam
- Solvay
- TANGSHAN SANYOU CHEMICAL INDUSTRIES CO., LTD.
- Tata Chemicals Ltd.
- Tronox Holdings Plc.
- We Soda Ltd.
- Yidu Huaxun Intelligent Conveyor Co.,Ltd
Additional Benefits:
- The market estimate (ME) sheet in Excel format
- 3 months of analyst support
TABLE OF CONTENTS
1 Introduction
- 1.1 Study Assumptions & Market Definition
- 1.2 Scope of the Study
2 Research Methodology
3 Executive Summary
4 Market Landscape
- 4.1 Market Overview
- 4.2 Market Drivers
- 4.2.1 Surging demand for flat, container and solar glass
- 4.2.2 Rebound in powdered detergents in emerging economies
- 4.2.3 Capacity additions in lithium carbonate (EV batteries)
- 4.2.4 Transition from synthetic to natural soda ash (ESG, cost)
- 4.2.5 Emerging sodium-ion and thermal energy-storage uses
- 4.3 Market Restraints
- 4.3.1 High CO2 footprint and tightening emission norms
- 4.3.2 Volatile trona / energy / freight prices
- 4.3.3 Global over-capacity led by China and Turkiye price pressure
- 4.4 Value Chain Analysis
- 4.5 Porter's Five Forces Analysis
- 4.5.1 Bargaining Power of Suppliers
- 4.5.2 Bargaining Power of Buyers
- 4.5.3 Threat of New Entrants
- 4.5.4 Threat of Substitutes
- 4.5.5 Competitive Rivalry
5 Market Size & Growth Forecasts (Volume)
- 5.1 By Type
- 5.1.1 Light Soda Ash
- 5.1.2 Dense Soda Ash
- 5.2 By Source
- 5.2.1 Natural (Trona-based)
- 5.2.2 Synthetic (Solvay, Hou, Dual-process)
- 5.3 By Application
- 5.3.1 Glass Manufacturing
- 5.3.2 Detergents and Soaps
- 5.3.3 Chemical Processing
- 5.3.4 Pulp and Paper
- 5.3.5 Metallurgy (Ore Smelting and Desulfurization)
- 5.3.6 Water Treatment
- 5.3.7 Food and Beverage Processing
- 5.4 By End-user Industry
- 5.4.1 Building and Construction
- 5.4.2 Automotive
- 5.4.3 Chemicals
- 5.4.4 Textiles
- 5.4.5 Food and Beverage
- 5.4.6 Renewable Energy (Solar PV glass, Batteries)
- 5.4.7 Electronics and Electrical
- 5.4.8 Healthcare and Pharmaceuticals
- 5.5 By Geography
- 5.5.1 Asia-Pacific
- 5.5.1.1 China
- 5.5.1.2 India
- 5.5.1.3 Japan
- 5.5.1.4 South Korea
- 5.5.1.5 ASEAN Countries
- 5.5.1.6 Australia and New Zealand
- 5.5.1.7 Rest of Asia-Pacific
- 5.5.2 North America
- 5.5.2.1 United States
- 5.5.2.2 Canada
- 5.5.2.3 Mexico
- 5.5.3 Europe
- 5.5.3.1 Germany
- 5.5.3.2 United Kingdom
- 5.5.3.3 France
- 5.5.3.4 Italy
- 5.5.3.5 Spain
- 5.5.3.6 Russia
- 5.5.3.7 Rest of Europe
- 5.5.4 South America
- 5.5.4.1 Brazil
- 5.5.4.2 Argentina
- 5.5.4.3 Chile
- 5.5.4.4 Rest of South America
- 5.5.5 Middle-East and Africa
- 5.5.5.1 Saudi Arabia
- 5.5.5.2 Turkey
- 5.5.5.3 South Africa
- 5.5.5.4 Nigeria
- 5.5.5.5 Rest of Middle-East and Africa
- 5.5.1 Asia-Pacific
6 Competitive Landscape
- 6.1 Market Concentration
- 6.2 Strategic Moves (M&A, Capacity Expansions, JV, Tech)
- 6.3 Market Share (%)/ Ranking Analysis
- 6.4 Company Profiles (includes Global level Overview, Market level overview, Core Segments, Financials as available, Strategic Information, Market Rank/Share for key companies, Products & Services, and Recent Developments)
- 6.4.1 ANSAC (American Natural Soda Ash Corp.)
- 6.4.2 Botswana Ash South Africa (PTY) Ltd.
- 6.4.3 Genesis Energy
- 6.4.4 GHCL Limited
- 6.4.5 Inner Mongolia Yuanxing Energy
- 6.4.6 NIRMA
- 6.4.7 QEMETICA
- 6.4.8 Shandong Haihua Group Co., Ltd.
- 6.4.9 Sisecam
- 6.4.10 Solvay
- 6.4.11 TANGSHAN SANYOU CHEMICAL INDUSTRIES CO., LTD.
- 6.4.12 Tata Chemicals Ltd.
- 6.4.13 Tronox Holdings Plc.
- 6.4.14 We Soda Ltd.
- 6.4.15 Yidu Huaxun Intelligent Conveyor Co.,Ltd
7 Market Opportunities & Future Outlook
- 7.1 Growth in solar, flat & container glass demand
- 7.2 Uptake in water softening & effluent treatment
- 7.3 Natural-soda-ash supply shift & low-carbon production
