
|
시장보고서
상품코드
2062427
데이터베이스 활동 모니터링 : 시장 점유율 분석, 업계 동향 및 통계, 성장 예측(2026-2031년)Database Activity Monitoring (DAM) - Market Share Analysis, Industry Trends & Statistics, Growth Forecasts (2026 - 2031) |
||||||
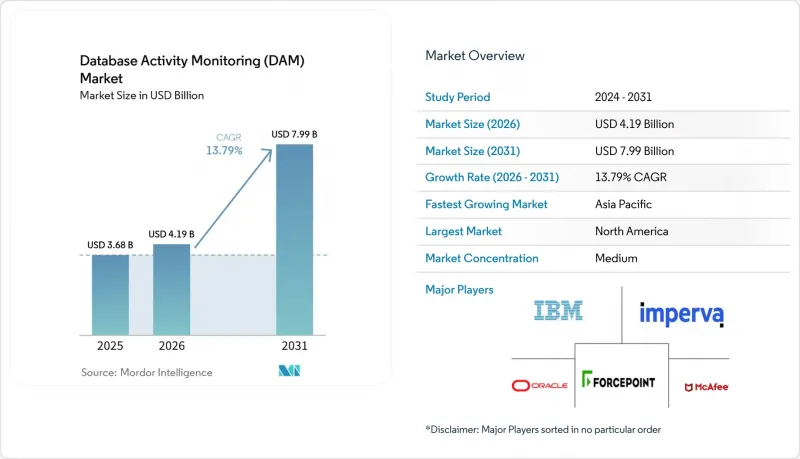
Mordor Intelligence에 의하면, 데이터베이스 활동 모니터링 시장 규모는 2025년에 36억 8,000만 달러로 평가되었습니다. 2026년에 41억 9,000만 달러에 달하고, 2031년까지 79억 9,000만 달러에 이를 것으로 예측됩니다.
2026년부터 2031년까지 연평균 성장률(CAGR) 13.79%를 나타낼 것으로 전망됩니다.
본 보고서는 구성 요소(소프트웨어 및 서비스), 배포 방식(On-Premise, 클라우드 기반 등), 조직 규모(중소기업 및 대기업), 데이터베이스 유형(관계형, NoSQL 등), 최종 사용자 산업(은행, 금융서비스 및 보험(BFSI), 헬스케어, 소매, 정부, IT 및 통신 등) 및 지역별로 분류되어 있습니다. 시장 전망은 금액(달러) 기준으로 제시되어 있습니다.
세계의 데이터베이스 활동 모니터링 시장 동향 및 인사이트
데이터 주권 관련 과태료 증가로 인해 규정 준수 예산 재편
데이터베이스 활동 모니터링 시장에서 2024년 전 세계 규제 당국은 GDPR(EU 개인정보보호규정) 위반에 대해 12억 유로(13억 5,000만 달러)의 벌금을 부과했습니다. 그 내역은 LinkedIn에 대한 3억 1,000만 유로(3억 5,030만 달러)와 Meta EDPB에 대한 2억 5,100만 유로(2억 8,363만 달러)가 주를 이룹니다. 기업들은 국경을 넘는 모든 데이터 전송을 실시간으로 기록하는 지속적인 쿼리 수준 감사 추적을 위해 새로운 자금을 투입하고 있습니다. 미국의 의료 서비스 제공업체들도 비슷한 압박에 직면해 있으며, HIPAA 시행에 따라 2026년까지 다단계 인증이 의무화됨에 따라 병원들은 모니터링을 핵심 보안 대책으로 삼아야 할 압박을 받고 있습니다. 이러한 규제의 가속화가 데이터베이스 활동 모니터링 시장이 분기별 규정 준수 점검에서 상시 가동되는 이상 감지 인프라로 전환되고 있는 이유를 설명해 줍니다. 실시간 가시성은 더 이상 재량적인 사항이 아니라, 이사회 차원의 예산 항목이 되었습니다.
멀티클라우드로의 워크로드 이전이 가시성을 저해합니다.
Synergy Research Group의 조사에 따르면, 2024년 4분기 인프라 점유율은 AWS가 31%, Azure가 25%, Google Cloud가 11%를 차지했으며, 기업의 87%가 여러 하이퍼스케일러에 걸쳐 워크로드를 실행하고 있었습니다. 각 클라우드 서비스는 고유한 로그 스키마를 채택하고 있기 때문에 보안 팀은 분석 전에 데이터를 정규화할 수밖에 없습니다. 2024년 중반에 발생한 Snowflake 침해 사건에서는 AT& T의 7,300만 건 및 Ticketmaster의 5억 6,000만 건의 기록이 유출되었는데, 이는 지역 간 일관성 없는 세션 모니터링이 어떻게 조직적인 침해로 눈덩이처럼 불어날 수 있는지를 보여주었습니다. 그 결과, On-Premise Oracle 로그와 Snowflake 이벤트를 통합하는 대시보드는 단순한 요청 단계에서 실제 구매 단계로 점차 전환되고 있습니다.
실시간 워크로드에서 발생하는 성능 오버헤드가 도입을 제약하고 있습니다.
인라인 에이전트는 5-15%의 CPU 부하를 유발하지만, 이는 트레이딩 시스템이나 블랙 프라이데이의 소매 트래픽에서는 용납될 수 없습니다. 또한, 100밀리초의 지연은 장바구니 전환율을 7% 낮출 가능성이 있습니다. 따라서 사업자는 쿼리의 10-20%를 표본 조사하고 있지만, 그 허점을 노린 정교한 공격이 숨어 있을 가능성이 있습니다. PCI DSS v4.0.1은 지속적인 감사 대상 범위를 의무화하고 있어, 이 과제는 더욱 심각해지고 있습니다. 에이전트 없는 클라우드 API는 이 문제의 일부를 해결해 주지만, 레거시 On-Premise 환경에서는 여전히 오버헤드라는 딜레마에 직면해 있습니다.
부문별 분석
Amazon Web Services, Azure, Google Cloud가 네이티브 감사 로그 스트림을 통합함에 따라, 클라우드 기반 모니터링 시장은 2031년까지 연평균 성장률(CAGR) 17.5%를 나타낼 것으로 전망됩니다. On-Premise는 여전히 매출의 63.5%를 차지하고 있습니다. 이는 DAM 시장에서 미션 크리티컬한 Oracle 및 IBM Db2 용도이 기업의 데이터센터에 여전히 남아 있기 때문입니다. 하이브리드 구축을 통해 조직은 두 환경에 걸쳐 로깅을 표준화할 수 있으며, 규제 대상 정보의 외부 저장을 금지하는 데이터 상주 요건을 충족할 수 있습니다.
유럽연합(EU)의 데이터 이전 규제 및 미국 연방 정부의 제로 트러스트 지침에 따라 로컬에서의 로그 기록이 권장되고 있지만, 비용 절감 및 CPU 오버헤드 감소를 고려할 때, 규정 준수 담당자의 승인을 받는다면 클라우드 기반 모니터링이 매력적인 대안이 될 수 있습니다. 이전 주기가 긴 기업에서는 Snowflake, MongoDB Atlas, On-Premise SQL 텔레메트리 데이터를 병행하여 수집하는 단일 대시보드로의 표준화가 진행되고 있습니다.
데이터베이스 활동 모니터링 시장에서 매니지드 서비스의 매출은 전반적인 수요를 상회하는 속도로 증가하고 있으며, 구매자들이 감지 및 제어 기능을 24시간 모니터링 파트너에게 위탁함에 따라 2031년까지 연평균 성장률(CAGR) 14.8%로 확대되고 있습니다. 금융 기관들은 도구를 On-Premise 방식으로 운영하는 것을 선호하기 때문에 영구 라이선스 덕분에 소프트웨어가 여전히 과반수의 점유율을 차지하고 있습니다. Oracle 및 IBM Db2를 대상으로 한 상세한 세션 모니터링에서는 에이전트 기반 솔루션이 주류를 이루고 있지만, Microsoft Database Watcher나 Datadog이 도입한 에이전트 없는 배포 방식은 지연 시간에 민감한 워크로드를 유치하고 있습니다.
2세대 관리형 감지 및 대응(MDR) 제공업체는 규칙 조정, 위협 인텔리전스 및 자동화된 격리 기능을 통합하고 있습니다. 이러한 매력은 인증을 받은 데이터베이스 인력이 부족하고, 이사회가 장기적인 역량 구축보다는 신속한 도입을 요구하는 아시아태평양에서 가장 두드러지게 나타납니다. 또한, 통합 업체들이 데이터베이스 로그를 중앙 집중식 보안 정보 및 이벤트 관리(SIEM) 파이프라인에 통합함에 따라 전문 서비스 매출도 증가하고 있습니다.
지역별 분석
2025년, 데이터베이스 활동 모니터링 시장에서 북미가 가장 큰 점유율을 차지하며 매출의 38.4%를 기록했습니다. 이는 대통령령 제14144호와 HIPAA 규정이 조화를 이루면서, 연방 정부, 의료 및 보험 업계에서 제로 트러스트 도입이 추진되었기 때문입니다. Snowflake 해킹 사건이 대중의 인식을 높였으며, 2024년 3분기에는 에이전트리스 도입이 22% 증가했습니다. 캐나다 사이버보안센터도 유사한 지침을 발표했으며, 한편 멕시코의 은행들은 데이터 거주 요건을 충족하기 위해 로그 기록을 강화하고 있습니다.
아시아태평양은 2031년까지의 연평균 성장률(CAGR)이 14.40%로 가장 높은 수준을 유지하고 있습니다. 이는 중국의 ‘개인정보보호법’, 싱가포르의 개정 PDPA, 인도의 ‘디지털 개인 데이터 보호법’이 모두 현지화된 감사 인프라를 의무화하고 있기 때문입니다. 일본과 한국의 반도체 공장에서는 지속적인 감시를 통해 지적재산을 보호하고 있으며, 호주에서는 합리적인 보호 조치를 취하지 않은 기업에 대한 벌금을 5,000만 호주 달러(3,300만 달러)로 인상했습니다.
유럽은 여전히 매우 중요한 지역이며, 2024년 GDPR(EU 개인정보보호규정)에 따른 벌금 총액은 12억 유로(14억 달러)에 달하고, 지난 몇 년간의 수치를 크게 상회했습니다. 독일의 12개월간 로그 보관 의무는 민간 조달 분야에도 적용되는 기준을 확립하고 있습니다. 남미에서는 브라질의 LGPD(개인정보보호법)에 따른 첫 번째 집행 사례가 발표되는 등 진전이 보이고 있습니다. 한편, 중동 및 아프리카의 성장은 On-Premise 또는 국내 클라우드에 로그 기록을 의무화하는 UAE(아랍에미리트) 및 사우디아라비아의 데이터 현지화법에 힘입어 이루어지고 있습니다.
기타 혜택 :
- 엑셀 형식 시장 예측(ME) 시트
- 3개월간의 애널리스트 지원
자주 묻는 질문
목차
제1장 서론
제2장 조사 방법
제3장 주요 요약
제4장 시장 구도
제5장 시장 규모 및 성장 예측
제6장 경쟁 구도
제7장 시장 기회 및 향후 전망
KTH 26.06.22According to Mordor Intelligence, the database activity monitoring (DAM) market size was USD 3.68 billion in 2025, USD 4.19 billion in 2026, and is anticipated to reach USD 7.99 billion by 2031, growing at a CAGR of 13.79% from 2026 to 2031.

This report is Segmented by Component (Software and Services), Deployment Mode (On-Premises, Cloud-Based, and More), Organization Size (Small and Medium Enterprises, and Large Enterprises), Database Type (Relational, Nosql, and More), End-User Industry (BFSI, Healthcare, Retail, Government, IT and Telecom, and More), and Geography. The Market Forecasts are Provided in Terms of Value (USD).
Global Database Activity Monitoring (DAM) Market Trends and Insights
Escalating Data-Sovereignty Fines Reshape Compliance Budgets
In the Database Activity Monitoring (DAM) market, global regulators imposed EUR 1.2 billion (USD 1.35 billion) in GDPR penalties during 2024, led by EUR 310 million (USD 350.3 million) against LinkedIn and EUR 251 million (USD 283.63 million) against Meta EDPB. Enterprises are directing fresh capital to continuous query-level audit trails that record every cross-border transfer in real time. U.S. healthcare providers face parallel pressure as HIPAA enforcement adds mandatory multi-factor authentication by 2026, prompting hospitals to treat monitoring as a core security control. This regulatory tempo explains why the Database Activity Monitoring market is pivoting from quarterly compliance checks to always-on anomaly-detection infrastructure. Real-time visibility is now a board-level budget line rather than a discretionary item.
Multi-Cloud Workload Migration Fragments Visibility
Synergy Research Group found that AWS held 31%, Azure 25%, and Google Cloud 11% of infrastructure share in Q4 2024, while 87% of enterprises ran workloads across more than one hyperscaler. Each cloud keeps proprietary log schemas that force security teams to normalize data before analysis. The mid-2024 Snowflake breach, which exposed 73 million AT&T and 560 million Ticketmaster records, showed how inconsistent session monitoring across regions can snowball into systemic compromise. Consolidated dashboards that merge on-premises Oracle logs with Snowflake events are therefore moving from wish-list to purchase order.
Performance Overhead in Real-Time Workloads Constrains Deployment
Inline agents impose 5-15% CPU drag that trading systems and Black Friday retail traffic cannot tolerate, and a 100-millisecond delay can shave 7% off cart conversions. Merchants thus sample 10-20% of queries, but gaps let sophisticated attacks hide. PCI DSS v4.0.1 insists on continuous audit coverage, intensifying the struggle. Agentless cloud APIs solve part of the issue, but legacy on-premises estates still face the overhead dilemma.
Other drivers and restraints analyzed in the detailed report include:
- AI-Driven Insider-Threat Detection Moves Beyond Rule-Based Alerts
- SIEM-SOAR Integrations Transform Monitoring into Automated Response
- Shortage of DAM Security Specialists Limits Effective Implementation
For complete list of drivers and restraints, kindly check the Table Of Contents.
Segment Analysis
Cloud-based monitoring is projected to post a 17.5% CAGR to 2031 as Amazon Web Services, Azure, and Google Cloud embed native audit log streams. On-premises still controls 63.5% revenue because mission-critical Oracle and IBM Db2 applications remain in corporate data centers in the DAM market. Hybrid rollouts let organizations standardize logging across both environments, meeting data-residency mandates that prohibit the external storage of regulated information.
European Union transfer restrictions and United States federal zero-trust directives encourage localized logging, but cost relief and reduced CPU overhead make cloud-delivered monitoring attractive once compliance officers approve. Enterprises in long migration cycles are standardizing on single dashboards that ingest Snowflake, MongoDB Atlas, and on-premises SQL telemetry side by side.
Managed Services revenue is rising faster than overall demand in the database activity monitoring market, advancing at a 14.8% CAGR through 2031, as buyers outsource detective controls to 24-hour monitoring partners. Software still owns the majority share thanks to perpetual licensing, preferred by financial institutions that keep tooling on-premises. Agent-based suites dominate deep session inspection for Oracle and IBM Db2, while agentless deployments introduced by Microsoft Database Watcher and Datadog attract latency-sensitive workloads.
Second-generation managed detection and response providers integrate rule tuning, threat intelligence, and automated containment. This appeal is strongest in Asia-Pacific, where certified database talent is scarce, and boards seek quicker deployment over long-term capability building. Professional Services revenue also climbs as integrators stitch database logs into centralized security information and event management pipelines.
Geography Analysis
North America accounted for the largest share of the Database Activity Monitoring (DAM) market in 2025, with 38.4% revenue, as Executive Order 14144 and HIPAA rules converged, driving zero-trust rollouts across federal, healthcare, and insurance verticals. The Snowflake breach raised public awareness, leading to a 22% increase in agentless deployments in Q3 2024. Canada's cyber center issued similar directives, while Mexican banks tighten logging to meet data-residency clauses.
Asia-Pacific registers the fastest CAGR at 14.40% through 2031 as China's Personal Information Protection Law, Singapore's revised PDPA, and India's Digital Personal Data Protection Act all require localized audit infrastructure. Japanese and Korean semiconductor plants protect intellectual property with continuous monitoring, and Australia raises penalties to AUD 50 million (USD 33 million) for firms lacking reasonable safeguards.
Europe remains pivotal because GDPR fines totaled EUR 1.2 billion (USD 1.4 billion) in 2024, far exceeding prior years. Germany's 12-month log mandate sets a standard that cascades into private procurement. South America progresses as Brazil's LGPD issues its first enforcement cases, while the Middle East and Africa growth rides the UAE and Saudi data-localization statutes that push on-premises or in-country cloud logs.
- International Business Machines Corporation
- Imperva Inc. (Thales S.A.)
- Oracle Corporation
- McAfee LLC
- Forcepoint LLC
- HexaTier Ltd.
- Trustwave Holdings Inc.
- SolarWinds Corporation
- Quest Software Inc.
- Guardicore Ltd. (Akamai Technologies)
- Idera Inc.
- Datadog Inc.
- Micro Focus International plc
- Amazon Web Services Inc.
- Google Cloud Platform (Chronicle Security)
- Teradata Corporation
- SAP SE
- Snowflake Inc.
- Microsoft Corporation (Azure SQL)
Additional Benefits:
- The market estimate (ME) sheet in Excel format
- 3 months of analyst support
TABLE OF CONTENTS
1 INTRODUCTION
- 1.1 Study Assumptions and Market Definition
- 1.2 Scope of the Study
2 RESEARCH METHODOLOGY
3 EXECUTIVE SUMMARY
4 MARKET LANDSCAPE
- 4.1 Market Overview
- 4.2 Market Drivers
- 4.2.1 Escalating Data-Sovereignty Fines
- 4.2.2 Multi-cloud Workload Migration
- 4.2.3 AI-driven Insider-threat Detection
- 4.2.4 Zero-trust Mandates in Public Sector
- 4.2.5 SIEM-SOAR Integrations
- 4.2.6 Agentless Telemetry Adoption
- 4.3 Market Restraints
- 4.3.1 Performance Overhead in Real-time Workloads
- 4.3.2 Shortage of DAM Security Specialists
- 4.3.3 Heterogeneous Database Environments
- 4.3.4 False-positive Fatigue
- 4.4 Industry Ecosystem Analysis
- 4.5 Regulatory Landscape
- 4.6 Impact of Macroeconomic Factors on the Market
- 4.7 Technological Outlook
- 4.8 Porter's Five Forces Analysis
- 4.8.1 Threat of New Entrants
- 4.8.2 Bargaining Power of Suppliers
- 4.8.3 Bargaining Power of Buyers
- 4.8.4 Threat of Substitutes
- 4.8.5 Competitive Rivalry
5 MARKET SIZE AND GROWTH FORECASTS
- 5.1 By Component
- 5.1.1 Software
- 5.1.1.1 Agent-based Monitoring
- 5.1.1.2 Agentless Monitoring
- 5.1.2 Services
- 5.1.2.1 Professional Services
- 5.1.2.2 Managed Services
- 5.1.1 Software
- 5.2 By Deployment Mode
- 5.2.1 On-premises
- 5.2.2 Cloud-based
- 5.2.3 Hybrid
- 5.3 By Organization Size
- 5.3.1 Small and Medium Enterprises
- 5.3.2 Large Enterprises
- 5.4 By Database Type
- 5.4.1 Relational Databases
- 5.4.2 NoSQL Databases
- 5.4.3 Big Data / Hadoop
- 5.4.4 Cloud-native Databases
- 5.5 By End-User Industry
- 5.5.1 Banking, Financial Services and Insurance
- 5.5.2 Healthcare and Life Sciences
- 5.5.3 Retail and E-commerce
- 5.5.4 Government and Defense
- 5.5.5 IT and Telecommunications
- 5.5.6 Industrial and Manufacturing
- 5.5.7 Energy and Utilities
- 5.5.8 Other End-User Industries
- 5.6 By Geography
- 5.6.1 North America
- 5.6.1.1 United States
- 5.6.1.2 Canada
- 5.6.1.3 Mexico
- 5.6.2 South America
- 5.6.2.1 Brazil
- 5.6.2.2 Argentina
- 5.6.2.3 Rest of South America
- 5.6.3 Europe
- 5.6.3.1 United Kingdom
- 5.6.3.2 Germany
- 5.6.3.3 France
- 5.6.3.4 Italy
- 5.6.3.5 Rest of Europe
- 5.6.4 Asia-Pacific
- 5.6.4.1 China
- 5.6.4.2 Japan
- 5.6.4.3 India
- 5.6.4.4 South Korea
- 5.6.4.5 Rest of Asia-Pacific
- 5.6.5 Middle East and Africa
- 5.6.1 North America
6 COMPETITIVE LANDSCAPE
- 6.1 Market Concentration
- 6.2 Strategic Moves
- 6.3 Market Share Analysis
- 6.4 Company Profiles (includes Global level Overview, Market level overview, Core Segments, Financials as available, Strategic Information, Market Rank/Share for key companies, Products and Services, and Recent Developments)
- 6.4.1 International Business Machines Corporation
- 6.4.2 Imperva Inc. (Thales S.A.)
- 6.4.3 Oracle Corporation
- 6.4.4 McAfee LLC
- 6.4.5 Forcepoint LLC
- 6.4.6 HexaTier Ltd.
- 6.4.7 Trustwave Holdings Inc.
- 6.4.8 SolarWinds Corporation
- 6.4.9 Quest Software Inc.
- 6.4.10 Guardicore Ltd. (Akamai Technologies)
- 6.4.11 Idera Inc.
- 6.4.12 Datadog Inc.
- 6.4.13 Micro Focus International plc
- 6.4.14 Amazon Web Services Inc.
- 6.4.15 Google Cloud Platform (Chronicle Security)
- 6.4.16 Teradata Corporation
- 6.4.17 SAP SE
- 6.4.18 Snowflake Inc.
- 6.4.19 Microsoft Corporation (Azure SQL)
7 MARKET OPPORTUNITIES AND FUTURE OUTLOOK
- 7.1 White-space and Unmet-Need Assessment
