
|
시장보고서
상품코드
2062451
RAN 애널리틱스 및 모니터링 : 시장 점유율 분석, 업계 동향 및 통계, 성장 예측(2026-2031년)RAN Analytics And Monitoring - Market Share Analysis, Industry Trends & Statistics, Growth Forecasts (2026 - 2031) |
||||||
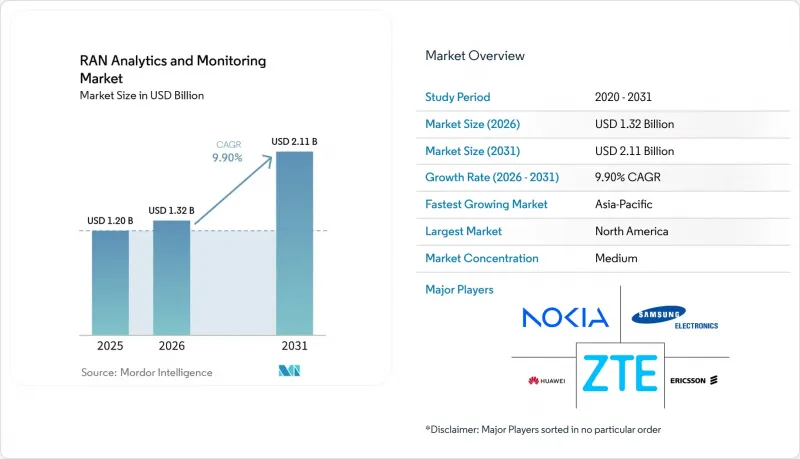
Mordor Intelligence에 의하면, RAN 애널리틱스 및 모니터링 시장 규모는 2025년 12억 달러로 평가되었습니다. 2026년 13억 2,000만 달러에서 2031년까지 21억 1,000만 달러로 확대되고 2026년부터 2031년까지 연평균 복합 성장률(CAGR)은 9.9%를 나타낼 것으로 예측됩니다.

본 보고서는 구성 요소(플랫폼/소프트웨어, 서비스), 배포 방식(On-Premise, 클라우드 기반), 네트워크 기술(4G/LTE, 기타), 용도(성능 관리, 장애·이벤트 관리, 기타), 최종 사용자(Tier 1 모바일 네트워크 사업자, 모바일 가상 네트워크 사업자, 기타) 및 지역별로 분류되어 있습니다. 시장 전망은 금액(달러) 기준으로 제시되어 있습니다.
세계의 RAN 애널리틱스 및 모니터링 시장 동향과 인사이트
5G 밀도 향상을 위한 AI 기반 예측 유지보수
통신 사업자들이 중대역의 용량 요건을 충족하기 위해 수천 개의 스몰셀을 추가하는 가운데, 예측 유지보수는 필수적인 요소로 자리 잡고 있습니다. 이러한 전환을 통해 서비스 품질이 저하되기 전에 간섭, 슬립 상태의 셀 또는 빔 열화를 자동으로 감지함으로써, 수작업에 소요되는 엔지니어링 시간을 줄일 수 있습니다. 화웨이와 차이나모바일이 공동으로 진행한 40만 사이트 규모의 프로젝트와 같은 도입 사례는 캐리어급 자율형 에이전트의 확장성을 입증하고 있습니다. 현재 각 벤더 기업들은 고도의 데이터 사이언스 기술이 없어도 바로 사용할 수 있는 사전 학습된 모델과 폐쇄형 워크플로우를 제공하며 경쟁하고 있으며, 이를 통해 가치 실현까지 걸리는 시간을 단축하고 있습니다. 상업적 성공 사례가 잇따르는 가운데, 기존의 핵심 성과 지표(KPI) 대시보드에서 자동 복구 플랫폼으로의 예산 재분배가 가속화되고 있습니다. 2026년 이후에 체결될 신규 계약의 대부분은 장애를 예측하고 예방할 수 있는 소프트웨어를 기반으로할 것이라는 것이 일반적인 전망입니다.
클라우드 네이티브 RAN의 분산이 데이터 시각화를 가속화합니다.
RAN을 집중형, 분산형 및 무선 유닛으로 구분함으로써, 클라우드 네이티브 분석을 실시간으로 활용할 수 있는 텔레메트리 포인트가 더욱 늘어납니다. 노키아의 ‘Autonomous Network Fabric’이나 인포비스타의 ‘Driverless Field Validation’과 같은 솔루션은 초당 기가비트 규모의 데이터 스트림을 확장 가능하고 API 우선 방식의 백엔드로 전송합니다. 통신 사업자는 여러 공급업체에 걸쳐 세밀한 가시성을 확보하고, 벤더 종속성을 줄일 수 있을 뿐만 아니라, 대규모 시스템 업데이트 없이도 새로운 분석 기능을 도입할 수 있습니다. 이러한 아키텍처상의 유연성은 레거시 시스템이 폐지될 때까지 이중 보증 스택을 운영해야 한다는 과제를 수반하지만, 대부분의 Tier 1 통신사는 유연성과 속도의 이점이 전환 기간 동안의 복잡성을 상쇄한다고 판단하고 있습니다.
다중 공급업체 RAN에서의 분산된 데이터 표준
서로 다른 로그 형식이 혼재되어 있으면, 통합 모델의 훈련을 방해할 뿐만 아니라 통신 사업자가 맞춤형 파서를 유지 관리하도록 강요함으로써 통합 비용을 증가시키고 있습니다. NETSCOUT의 2024년 AIOps 설문조사에 따르면, 불일치하는 스키마가 컴퓨팅 리소스 부족이나 라이선스 비용을 제치고 머신러닝 도입의 가장 큰 제약 요인으로 꼽혔습니다. 멀티벤더 Open RAN을 시범 도입하고 있는 인도의 통신 사업자는 데이터를 정규화하기 위해 제3자 시스템 통합사업자에 의존하는 것이 비용을 대폭 증가시키는 요인이며, 이로 인해 프로젝트 기간이 두 배로 늘어나는 경우가 많다고 지적하고 있습니다. O-RAN 얼라이언스는 공통 정보 모델을 추진하고 있지만, 벤더들은 여전히 경쟁 우위를 확보하기 위해 독자적인 카운터를 출시하고 있어 표준화 작업이 장기화되고 있습니다.
부문별 분석
2025년 수익의 대부분은 플랫폼 소프트웨어가 차지했으나, 멀티벤더 환경이 점점 더 복잡해짐에 따라 서비스의 성장 속도가 가속화되고 있습니다. 통신 사업자들은 지속적인 모델 재훈련과 도메인 간 상관 분석이 일반적인 네트워크 운영 센터의 역량을 넘어선다는 점을 인식하고 있으며, 이에 따라 도입, 맞춤화, 수명 주기 관리를 성과 기반 계약 형태로 구매하고 있습니다. 따라서 매니지드 서비스에 기인한 RAN 분석·모니터링 시장 규모는 두 자릿수 성장률을 기록하며 확대되고 있는 반면, 공급업체들은 미리 구축된 이용 사례 라이브러리와 서비스 수준 보증을 통해 차별화를 꾀하고 있습니다.
또한, 서비스의 성장은 AI 엔지니어링 및 오픈 RAN 오케스트레이션 분야의 기술 부족도 반영하고 있습니다. 캡제미니(Capgemini)나 HCL 테크놀로지스(HCL Technologies)와 같은 시스템 통합사업자들은 연중무휴 24시간 운영되는 센터 오브 엑셀런스(Center of Excellence)를 구축하고 있으며, 벤더들은 지속적인 업그레이드를 구독 서비스에 포함시켜 설비 투자를 예측 가능한 운영 비용으로 전환하고 있습니다. 대부분의 Tier 2 통신사와 기업 전용 네트워크 소유자는 전문 인력이 부족하기 때문에 대형 통신사들이 자체 소프트웨어 스택에 대한 투자를 지속하고 있음에도 불구하고 2031년까지는 서비스 주도형 제공 모델이 주류를 이룰 것으로 보입니다.
클라우드 기반 구현은 그 확장성, 성장에 따른 과금 모델, 하이퍼스케일 AI 툴체인과의 네이티브 통합 덕분에 이미 도입 사례의 과반수를 차지하고 있습니다. 수만 곳의 기지국에서 전송되는 텔레메트리 데이터의 스트리밍 처리는 고정된 On-Premise 클러스터보다 수평 자동 확장 기능을 통해 더 효율적으로 처리됩니다. 그 결과, 트래픽의 급증, 펌웨어 업그레이드, 또는 새로운 주파수 대역 도입으로 인해 데이터 양이 증가할 경우, 클라우드 플랫폼이 총소유비용(TCO) 측면에서 가장 낮은 비용을 보이는 경우가 자주 있습니다.
On-Premise 및 하이브리드 모델은 지연 시간에 민감한 워크로드나 주권상의 제약이 있는 워크로드에서 여전히 채택되고 있습니다. 예를 들어, 유럽의 통신 사업자들은 일반 데이터 보호 규정(GDPR(EU 개인정보보호규정))을 준수하기 위해 개인 데이터가 대량으로 포함된 분석을 프라이빗 클라우드에서 처리하는 한편, 식별이 불가능한 훈련 데이터를 퍼블릭 클라우드로 내보내 비용을 절감하며 모델 반복 작업을 수행하고 있습니다. 예측 기간 동안 RAN 애널리틱스 및 모니터링 시장은 계속해서 ‘클라우드 우선’ 방향으로 전환될 것으로 보이지만, 엣지, 프라이빗, 퍼블릭 리소스를 단일 정책 프레임워크 하에서 통합할 수 있는 벤더가 가장 널리 채택될 것으로 보입니다.
지역별 분석
북미는 Verizon, AT&T, T-Mobile의 중파 대역 주파수에 대한 적극적인 구축과 오픈 RAN 테스트베드로의 광범위한 전환에 힘입어 지출에서 가장 큰 비중을 차지하고 있습니다. 다중 벤더 RAN 지능형 컨트롤러에 대한 초기 테스트는 표준 기반 텔레메트리 시스템에 대한 신뢰도를 높였으며, 벤더에 구애받지 않는 모니터링 솔루션에 대한 예산 확보를 가능하게 했습니다. 또한, 기지국의 밀집화는 타워 기업의 설비 투자에도 영향을 미치고 있어, 통신 사업자와 인프라 소유자 양측 모두에서 분석 수요를 확고히 하고 있습니다.
유럽에서는 개방형 인터페이스에 대한 규제적 지원과 엄격한 에너지 효율 지침이 맞물리면서, 전력 분석 모듈 및 사이버 보안 대책이 적용된 디스어그리게이션형 아키텍처에 대한 투자가 촉진되고 있습니다. 도이치 텔레콤이나 보다폰과 같은 통신 사업자들은 공급업체 평가 및 NIS2 요건 준수를 목적으로 사내 디지털 트윈을 구축하고 있으며, 이를 통해 벤더 전반에 걸친 상관 관계 엔진을 기반으로 안정적인 조달을 확보하고 있습니다. 독일은 자동차 제조 분야에서 사설 네트워크 도입을 주도하고 있는 반면, 영국과 프랑스는 국가의 지속가능성 목표를 달성하기 위해 탄소 배출량 추적 대시보드를 우선시하고 있습니다.
아시아태평양은 인도의 그린필드 5G, 중국의 자율 에이전트 도입, 동남아시아의 가상화 RAN 시범 사업이 동시에 확대되는 가운데 가장 높은 연평균 성장률(CAGR)을 기록하고 있습니다. 차이나모바일이 40만 개 규모의 지능형 에이전트를 도입한 프로젝트는 통신사급 AI 운영을 입증하고 있으며, 지역 내 동종 업계 경쟁사들 역시 유사한 프레임워크를 도입하도록 촉진하고 있습니다. 일본의 소프트웨어 정의 RAN(Software-Defined RAN)에 대한 노력과 호주 지방 지역의 통신망 구축에 대한 집중이 이 매우 다양한 상황을 한층 더 다채롭게 만들고 있지만, 모든 하위 지역에서 클라우드의 확장성, 에너지 효율성, 개방형 인터페이스의 유연성을 중시하는 공통된 전략이 형성되고 있습니다.
기타 혜택 :
- 엑셀 형식 시장 예측(ME) 시트
- 3개월간의 애널리스트 지원
자주 묻는 질문
목차
제1장 서론
제2장 조사 방법
제3장 주요 요약
제4장 시장 구도
제5장 시장 규모 및 성장 예측
제6장 경쟁 구도
제7장 시장 기회 및 향후 전망
KTH 26.06.22According to Mordor Intelligence, the rAN analytics and monitoring market size is projected to expand from USD 1.20 billion in 2025 and USD 1.32 billion in 2026 to USD 2.11 billion by 2031, registering a CAGR of 9.9% between 2026 to 2031.
This report is Segmented by Component (Platform/Software, and Services), Deployment Mode (On-Premises, and Cloud-Based), Network Technology (4G/LTE, and More), Application (Performance Management, Fault and Event Management, and More), End User (Tier-1 Mobile Network Operators, Mobile Virtual Network Operators, and More), and Geography. The Market Forecasts are Provided in Terms of Value (USD).
Global RAN Analytics And Monitoring Market Trends and Insights
AI-Driven Predictive Maintenance For 5G Densification
Predictive maintenance is becoming essential as operators add thousands of small cells to satisfy mid-band capacity requirements. The shift cuts manual engineering hours by automatically detecting interference, sleeping cells, or degraded beams before service quality dips. Deployments such as Huawei and China Mobile's 400,000-site project have proven the scalability of autonomous agents at carrier-grade. Vendors now compete on providing pre-trained models and closed-loop workflows that can be activated without deep data-science skills, shortening time to value. Commercial success stories are accelerating budget reallocation from legacy key performance indicator dashboards to automated remediation platforms. The prevailing expectation is that software able to predict and prevent outages will underpin most new contracts signed after 2026.
Cloud-Native RAN Disaggregation Accelerates Data Visibility
Breaking the RAN into centralized, distributed, and radio units opens additional telemetry points that cloud-native analytics harness in real time. Solutions such as Nokia's Autonomous Network Fabric and Infovista's driverless field validation stream gigabit-per-second data streams into elastic, API-first backends. Operators gain fine-grained visibility across multiple vendors, reduce lock-in, and can spin up new analytic functions without forklift upgrades. This architectural freedom is offset by the need to run dual assurance stacks while legacy systems are retired, yet most tier-1 carriers judge the benefits of flexibility and speed to outweigh transitional complexity.
Fragmented data standards across multi-vendor RAN
Heterogeneous log formats impede the training of unified models, forcing operators to maintain custom parsers that raise integration costs. NETSCOUT's 2024 AIOps survey lists inconsistent schemas as the top inhibitor of machine-learning rollouts, ahead of compute shortages and licensing fees. Indian carriers piloting multi-vendor Open RAN cite the need for third-party system integrators to normalize data as a major expense spike, often doubling project timelines. The O-RAN Alliance promotes common information models, but equipment makers still release proprietary counters for competitive edge, prolonging normalization efforts.
Other drivers and restraints analyzed in the detailed report include:
- Surge Of Private 5G Networks In Industry 4.0 Plants
- Open RAN Automation And xApps-rApps Ecosystem Expansion
- Skills gap in AI/ML model engineering for CSPs
For complete list of drivers and restraints, kindly check the Table Of Contents.
Segment Analysis
Platform software accounted for the bulk of 2025 revenue, yet rising multi-vendor complexity means services are climbing faster. Operators recognize that continuous model retraining and cross-domain correlation exceed routine network operations center competencies, so they purchase deployment, customization, and lifecycle management as outcome-based engagements. The RAN analytics and monitoring market size attributed to managed services is therefore expanding at a double-digit pace, while suppliers differentiate through libraries of pre-built use cases and service-level guarantees.
Services growth also reflects skills shortages in AI engineering and open-RAN orchestration. System integrators such as Capgemini and HCL Technologies are building 24/7 centers of excellence, and vendors bundle evergreen upgrades into subscriptions that convert capital outlays into predictable operating expenses. Because most tier-2 carriers and enterprise private-network owners lack specialist teams, service-led delivery will remain the preferred model through 2031, even as larger operators keep investing in proprietary software stacks.
Cloud-based implementations already hold a majority of deployments thanks to elasticity, pay-as-you-grow economics, and native integration with hyperscale AI toolchains. Streaming telemetry from tens of thousands of cell sites is better handled by horizontal auto-scaling than by fixed on-premises clusters. As a result, cloud platforms frequently demonstrate the lowest total cost of ownership when traffic spikes, firmware upgrades, or new spectrum bands multiply data volumes.
On-premises and hybrid models persist for latency-sensitive or sovereignty-constrained workloads. European carriers, for example, process personal-data-heavy analytics in private clouds to comply with the General Data Protection Regulation, while exporting non-identifiable training sets to public clouds for cheaper model iteration. Over the forecast horizon, the RAN analytics and monitoring market will continue shifting toward a cloud-first stance, but vendors able to unify edge, private, and public resources under a single policy framework will enjoy the widest adoption.
Geography Analysis
North America drives the largest share of spending thanks to aggressive mid-band spectrum roll-outs by Verizon, AT&T, and T-Mobile, and a pervasive move toward open RAN test beds. Early trials of multi-vendor RAN intelligent controllers have boosted confidence in standards-based telemetry, unlocking budgets for vendor-agnostic monitoring suites. Densification has also spilled into tower-company capital expenditure, cementing analytics demand across both carriers and infrastructure owners.
Europe combines regulatory support for open interfaces with stringent energy-efficiency directives, channeling investment into power analytics modules and cyber-secure, disaggregated architectures. Operators such as Deutsche Telekom and Vodafone are building internal digital twins to benchmark suppliers and comply with NIS2 requirements, ensuring steady procurement of cross-vendor correlation engines. Germany leads private-network uptake in automotive manufacturing, while the United Kingdom and France prioritize carbon-tracking dashboards to meet national sustainability targets.
Asia-Pacific posts the fastest CAGR as India's greenfield 5G, China's autonomous-agent deployments, and Southeast Asia's virtualized RAN pilots scale concurrently. Projects such as China Mobile's 400,000-site intelligent-agent deployment validate carrier-grade AI operations, encouraging regional peers to adopt similar frameworks. Japan's push into software-defined RAN and Australia's focus on rural coverage round out a highly diverse patchwork, yet all sub-regions converge on a playbook that values cloud elasticity, energy savings, and open-interface flexibility.
- Telefonaktiebolaget LM Ericsson
- Nokia Corporation
- Huawei Technologies Co., Ltd.
- ZTE Corporation
- Samsung Electronics Co., Ltd. (Network Business)
- NEC Corporation
- Mavenir Systems, Inc.
- Viavi Solutions Inc.
- MYCOM OSI Limited
- Infovista SAS
- TEOCO Corporation
- EXFO Inc.
- NETSCOUT Systems, Inc.
- Cellwize Wireless Technologies Pte Ltd.
- AirHop Communications, Inc.
- Parallel Wireless, Inc.
- Tupl, Inc.
- Rakuten Symphony Inc.
- Capgemini SE (Engineering and RAN Analytics)
- HCL Technologies Limited
- Amdocs Limited
- VMware, Inc. (Service Management and Analytics)
Additional Benefits:
- The market estimate (ME) sheet in Excel format
- 3 months of analyst support
TABLE OF CONTENTS
1 INTRODUCTION
- 1.1 Study Assumptions and Market Definition
- 1.2 Scope of the Study
2 RESEARCH METHODOLOGY
3 EXECUTIVE SUMMARY
4 MARKET LANDSCAPE
- 4.1 Market Overview
- 4.2 Market Drivers
- 4.2.1 AI-driven Predictive Maintenance for 5G Densification
- 4.2.2 Cloud-native RAN Disaggregation Accelerates Data Visibility
- 4.2.3 Surge of Private 5G Networks in Industry 4.0 Plants
- 4.2.4 Open RAN Automation/xApps-rApps Ecosystem Expansion
- 4.2.5 Energy-efficiency Mandates Driving RAN Power Analytics
- 4.2.6 Telco Push Toward Zero-touch Operations (ZTO)
- 4.3 Market Restraints
- 4.3.1 Fragmented Data Standards Across Multi-vendor RAN
- 4.3.2 Skills Gap in AI/ML Model Engineering for CSPs
- 4.3.3 Rising Cyber-attack Surface on Virtualised RAN
- 4.3.4 ROI Uncertainty in Brown-field 4G Modernisations
- 4.4 Industry Value Chain Analysis
- 4.5 Impact of Macroeconomic Factors on the Market
- 4.6 Regulatory Landscape
- 4.7 Technological Outlook
- 4.8 Porter's Five Forces Analysis
- 4.8.1 Bargaining Power of Suppliers
- 4.8.2 Bargaining Power of Buyers
- 4.8.3 Threat of New Entrants
- 4.8.4 Threat of Substitutes
- 4.8.5 Competitive Rivalry
5 MARKET SIZE AND GROWTH FORECASTS (VALUE)
- 5.1 By Component
- 5.1.1 Platform / Software
- 5.1.2 Services
- 5.2 By Deployment Mode
- 5.2.1 On-premises
- 5.2.2 Cloud-based
- 5.3 By Network Technology
- 5.3.1 2G / 3G
- 5.3.2 4G / LTE
- 5.3.3 5G NR
- 5.3.4 Open RAN / vRAN
- 5.4 By Application
- 5.4.1 Performance Management
- 5.4.2 Fault and Event Management
- 5.4.3 Mobility and Handover Optimisation
- 5.4.4 Energy and Capacity Optimisation
- 5.5 By End User
- 5.5.1 Tier-1 Mobile Network Operators
- 5.5.2 Mobile Virtual Network Operators
- 5.5.3 Private Enterprise Networks
- 5.5.4 Neutral-Host / TowerCos
- 5.6 By Geography
- 5.6.1 North America
- 5.6.1.1 United States
- 5.6.1.2 Canada
- 5.6.1.3 Mexico
- 5.6.2 Europe
- 5.6.2.1 Germany
- 5.6.2.2 United Kingdom
- 5.6.2.3 France
- 5.6.2.4 Russia
- 5.6.2.5 Rest of Europe
- 5.6.3 Asia-Pacific
- 5.6.3.1 China
- 5.6.3.2 Japan
- 5.6.3.3 India
- 5.6.3.4 South Korea
- 5.6.3.5 Australia
- 5.6.3.6 Rest of Asia-Pacific
- 5.6.4 Middle East and Africa
- 5.6.4.1 Middle East
- 5.6.4.1.1 Saudi Arabia
- 5.6.4.1.2 United Arab Emirates
- 5.6.4.1.3 Rest of Middle East
- 5.6.4.2 Africa
- 5.6.4.2.1 South Africa
- 5.6.4.2.2 Egypt
- 5.6.4.2.3 Rest of Africa
- 5.6.4.1 Middle East
- 5.6.5 South America
- 5.6.5.1 Brazil
- 5.6.5.2 Argentina
- 5.6.5.3 Rest of South America
- 5.6.1 North America
6 COMPETITIVE LANDSCAPE
- 6.1 Market Concentration
- 6.2 Strategic Moves
- 6.3 Market Share Analysis
- 6.4 Company Profiles (includes Global Level Overview, Market Level Overview, Core Segments, Financials as available, Strategic Information, Market Rank/Share, Products and Services, Recent Developments)
- 6.4.1 Telefonaktiebolaget LM Ericsson
- 6.4.2 Nokia Corporation
- 6.4.3 Huawei Technologies Co., Ltd.
- 6.4.4 ZTE Corporation
- 6.4.5 Samsung Electronics Co., Ltd. (Network Business)
- 6.4.6 NEC Corporation
- 6.4.7 Mavenir Systems, Inc.
- 6.4.8 Viavi Solutions Inc.
- 6.4.9 MYCOM OSI Limited
- 6.4.10 Infovista SAS
- 6.4.11 TEOCO Corporation
- 6.4.12 EXFO Inc.
- 6.4.13 NETSCOUT Systems, Inc.
- 6.4.14 Cellwize Wireless Technologies Pte Ltd.
- 6.4.15 AirHop Communications, Inc.
- 6.4.16 Parallel Wireless, Inc.
- 6.4.17 Tupl, Inc.
- 6.4.18 Rakuten Symphony Inc.
- 6.4.19 Capgemini SE (Engineering and RAN Analytics)
- 6.4.20 HCL Technologies Limited
- 6.4.21 Amdocs Limited
- 6.4.22 VMware, Inc. (Service Management and Analytics)
7 MARKET OPPORTUNITIES AND FUTURE OUTLOOK
- 7.1 White-space and Unmet-Need Assessment
