
|
시장보고서
상품코드
2062467
부유식 액화천연가스(FLNG) : 시장 점유율 분석, 업계 동향 및 통계, 성장 예측(2026-2031년)Floating Liquefied Natural Gas - Market Share Analysis, Industry Trends & Statistics, Growth Forecasts (2026 - 2031) |
||||||
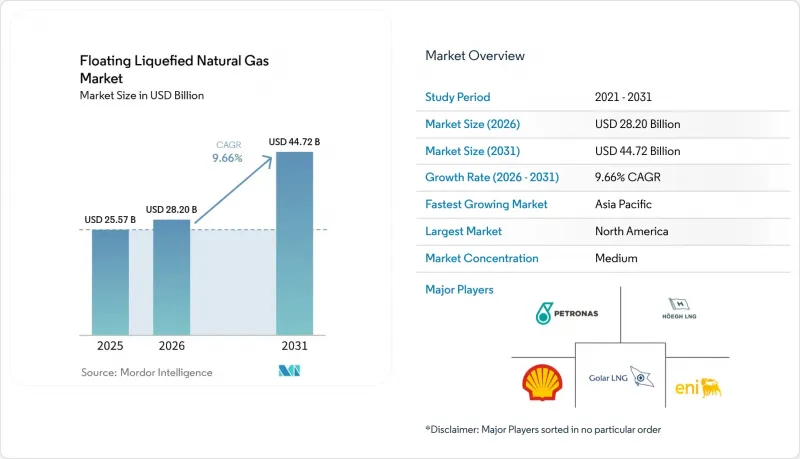
Mordor Intelligence에 의하면, 부유식 액화천연가스(FLNG) 시장 규모는 2025년에 255억 7,000만 달러로 평가되었습니다. 2026년에 282억 달러에 달하고, 2031년까지 447억 2,000만 달러에 이를 것으로 예측됩니다.
2026년부터 2031년까지 연평균 성장률(CAGR) 9.66%를 나타낼 것으로 전망됩니다.

본 보고서는 용량(소규모, 중규모, 대규모), 설치 형태(해상 및 연안), 용도(액화, 재기화, 저장·수송), 그리고 지역(북미, 유럽, 아시아·태평양, 남미, 중동 및 아프리카)별로 분류되어 있습니다. 시장 규모 및 전망은 금액(달러) 기준으로 제시되어 있습니다.
세계의 부유식 액화천연가스(FLNG) 시장 동향 및 분석
아시아에서 석탄에서 가스로의 전환에 따른 가스 수요의 급증
아시아의 천연가스 소비량은 2030년까지 연평균 5%씩 증가할 것으로 예측되며, 유연한 LNG 공급에 대한 수요가 매우 높아질 것으로 전망됩니다. FLNG 유닛은 대규모 육상 터미널이 필요 없이 해상 공급원에서 직접 육상으로 가스를 공급함으로써, 아시아의 구매자들에게 파이프라인이나 장거리 운송을 통한 화물 수송을 뛰어넘는 전략적 다각화를 가져다줍니다. 이러한 기동성 덕분에 산업 클러스터가 내륙 지역으로 이전할 때에도 새로운 수요 거점으로 재배치할 수 있게 됩니다. 또한, 기존 방식의 수입 터미널이 자금 조달의 어려움이나 토지 이용에 대한 반대에 직면한 경우, 소규모 아시아 국가들 역시 FLNG를 선호하고 있으며, 부유식 인프라는 저탄소 에너지 목표 달성을 위한 가교 역할을 하고 있습니다. 중국 동부 연안에서의 대규모 확대에 더해, 필리핀과 베트남에서는 전력 계통의 안정화를 위해 신속한 공급이 가능한 LNG가 필요하기 때문에 모듈식 유닛이 도입되고 있습니다. 이 지역의 수입국들은 2030년까지 전 세계 LNG 증분 공급량의 70%를 흡수할 것으로 예상되며, 이에 따라 아시아가 FLNG 시장 시장 역학에 미치는 영향력이 커질 것입니다.
러시아와의 분쟁 이후 유럽의 에너지 안보 대응 방안
유럽의 LNG 수입량은 겨울철 90일 분공급 확보를 요구하는 ‘REPowerEU’의 요건에 따라 2025년에는 1,430억 입방미터에 달했습니다. 독일은 4기의 FSRU를 가동하고 있으며, 현재는 잉여분을 액화하여 재수출하고 있습니다. 이를 통해 폴란드와 체코 공화국의 구매자들은 새로운 파이프라인을 건설하지 않고도 부유식 설비를 이용할 수 있게 되었습니다. 영국의 내셔널 그리드(National Grid)는 국내 수입 의존에서 벗어나기 위해 북해 연안의 3개 FLNG 프로젝트에 대해 15년간공급 할당량을 확보하고 있습니다. 유럽의 오프테이커들이 ‘수출지 조항’을 수용한 것은 부유식 액화천연가스(FLNG) 시장의 장기적인 전망을 뒷받침하는 구조적 전환을 보여줍니다. 현재 모든 자산은 IEC 62443 사이버 보안 인증을 취득해야 하며, 이를 통해 신규 진입 업체에 대한 기술적 진입 장벽이 제거되었습니다.
높은 설비 투자(CAPEX)와 자금 조달 위험
프렐류드(Prelude) 프로젝트의 최종 비용은 부식 문제로 인한 재시공이 발생함에 따라 승인 당시 견적의 2배인 170억 달러에 달했습니다. 2021년 모잠비크 LNG 프로젝트의 가동 중단으로 인해 230억 달러가 투자 자본으로 고정됨에 따라, 대출 기관들은 정부 보증이 없는 인근 지역의 FLNG 프로젝트에 대해 신중한 태도를 보이고 있습니다. 현재 상업은행은 1.4배의 부채 상환 배율을 요구하고 있으며, 이는 브렌트유 가격이 60달러를 초과하는 장기 원유 연동 계약을 통해서만 달성할 수 있습니다. 2025년, 일본과 한국의 수출신용기관은 68억 달러 규모의 보증을 제공했으나, BB 등급 미만의 국가는 대상에서 제외되어 프론티어 프로젝트의 40%가 제외되었습니다. Toll 계약은 소유주의 가격 리스크를 억제하지만, 매장량이 기대치에 미치지 못할 경우 생산량 리스크에 노출되어 부유식 액화천연가스(FLNG) 시장의 현금 흐름에 압박을 가하게 됩니다.
부문별 분석
2025년, 연간 300만 톤 이상의 대규모 플랫폼이 부유식 액화천연가스(FLNG) 시장 점유율의 56.2%를 차지했습니다. 높은 처리 능력 덕분에 선체 감가상각비를 더 많은 화물로 분산할 수 있어, 주요 기업들이 장기 계약을 협상할 때 부유식 액화천연가스(FLNG) 시장 규모 면에서 갖는 우위가 확고해지고 있습니다. '프렐류드', 'PFLNG 두아', '코랄 수르' 등 3척은 2025년에 총 1,170만 톤을 선적하여, 헨리 허브 연동 가격에 따른 공급 대비 아시아 시장에서 MMBtu당 0.80달러의 프리미엄을 확보했습니다. 그러나 막대한 자본 비용과 장기 용선 계약의 제약으로 인해, 가스전의 고갈에 따라 이전이 가능한 중규모 유닛에 대한 관심이 높아지고 있습니다. 고라(Gola)사의 개조 모델은 수명의 절반을 소진한 운반선을 재활용함으로써 이러한 유연성을 실현하고, 건조 기간을 38개월로 단축하는 동시에 지역 수요 동향의 변화에 따라 새로운 가스 허브로 재배치할 수 있는 선택권을 운영사에 제공함으로써, 부유식 액화천연가스(FLNG) 시장의 회복탄력성을 강화하고 있습니다.
연간 처리 능력 100만-300만 톤 규모의 중규모 자산이 확대되고 있으며, 수심 200미터라면 잭업식 시추선을 이용한 유지보수가 가능해져, 해양 인건비를 22% 절감할 수 있습니다. 연간 처리 능력 100만 톤 미만의 소규모 설비는 새롭게 부상하고 있는 e-메탄올 벙커링 및 도서 지역의 전력망에 대응하고 있습니다. 현대중공업의 연간 처리 능력 60만 톤 규모의 표준 설계 비용은 4억 8,000만 달러로, 맞춤형 메가할 선박에 비해 톤당 40% 저렴합니다. 현재 선급협회는 연간 처리 능력 250만 톤을 초과하는 설비에 대해 듀얼 연료 추진을 의무화하고 있으며, 이로 인해 1억 8,000만 달러의 추가 비용이 발생하지만, EU 택소노미에 기반한 자금 조달이 가능해집니다. 디지털 트윈이 생산 가동 시간을 최적화함에 따라, 설비 용량 선정은 단순한 규모의 경제에 기반한 결정에서 벗어나, 부유식 액화천연가스(FLNG) 시장의 가동률, 재배치 민첩성, 규정 준수 비용 간의 균형을 고려한 포트폴리오 리스크 계산으로 전환되고 있습니다.
지역별 분석
2025년, 북미는 전 세계 매출의 33.9%를 차지했습니다. 이는 미국 멕시코만 연안의 생산자들이 아시아 현물 가격 지표보다 3.20달러 저렴한 헨리 허브의 원료 가스 가격을 활용하여, 도쿄로의 경쟁력 있는 공급 비용을 실현했기 때문입니다. 뉴 포트리스 에너지의 ‘패스트 LNG’는 가동 첫해에 140만 톤을 선적할 예정이며, 이 설계를 멕시코만 연안의 플랫폼 3곳으로 추가로 확대하는 것을 목표로 하고 있습니다. 2026년 1월 브리티시컬럼비아주에서 제안된 계획에 따르면, 15년간의 JKM 지수 연동 계약에 따라 몬토니 셰일가스를 일본으로 수송하는 것을 목표로 하고 있습니다. 멕시코는 캄페체 만에서 수반 가스를 액화하기 위한 근해 설비 도입을 검토하고 있으며, 2024년에 180억 입방미터에 달했던 플레어링(가스 방출)을 줄이겠다는 방침입니다.
아시아태평양은 2031년까지 연평균 11.3%의 성장률을 기록하며 가장 빠르게 성장하고 있는 부유식 액화천연가스(FLNG) 시장이며, 호주, 인도네시아, 말레이시아는 2025년에 연간 780만 톤의 생산을 승인했습니다. 우드사이드사의 브라우즈 FLNG는 당초 육상 계획이 지역 주민들의 반대로 인해 지연됨에 따라, 2029년까지 연간 350만 톤의 생산 능력을 갖춘 플랫폼을 배치할 예정입니다. 인도네시아는 자국 군도에 흩어져 있는 전력 수요를 충족하기 위해 나투나 및 마세라 유전에서 4건의 FLNG 면허를 부여했습니다. 말레이시아는 세 번째 PFLNG를 건설 중이며, 모듈화를 통해 톤당 18%의 설비 투자 비용 절감을 기대하고 있습니다. 인도의 ONGC는 크리슈나-고다바리 분지를 위해 연간 180만 톤의 처리 능력을 갖춘 선박을 설계 중이며, 1MMBtu당 12달러에 거래되는 현물 화물 수입을 대체하는 것을 목표로 하고 있습니다.
유럽의 점유율은 여전히 소규모이지만, 부유식 재기화 허브가 러시아산 파이프라인 공급 부족분을 보완한다는 점에서 전략적으로 중요합니다. 영국의 내셔널 그리드(National Grid)는 2029년까지 국내산 가스를 액화하여 유럽 대륙의 구매자들에게 수출하는 3개의 북해 연안 프로젝트에 대해 15년간의 계약을 체결했습니다. 독일의 4척의 FSRU는 계절에 따라 양방향 허브 역할을 하며, 수요가 적은 시기에는 폴란드와 체코로 가스를 수출하고 있습니다. 북유럽의 항구에서는 e-메탄올 벙커링을 목적으로 한 소규모 FLNG의 시범 운영이 진행되고 있으며, 노르웨이에는 연간 80만 톤의 처리 능력을 갖춘 설비의 도입이 예정되어 있습니다. 스페인과 프랑스는 개정된 EU 가스 지침에 따라 2025년 3월, 부유식 사업자에 대한 상호 연결 접근의 평등화를 실현함으로써, 중재 거래의 가능성을 확대했습니다. 제재 조치로 인해 러시아가 계획했던 북극권 FLNG 설비 2기의 건설이 지연되면서, 연간 660만 톤공급이 2028년 이후로 미뤄지게 되었습니다.
기타 혜택 :
- 엑셀 형식 시장 예측(ME) 시트
- 3개월간의 애널리스트 지원
자주 묻는 질문
목차
제1장 서론
제2장 조사 방법
제3장 주요 요약
제4장 시장 구도
제5장 시장 규모 및 성장 예측
제6장 경쟁 구도
제7장 시장 기회 및 향후 전망
KTHAccording to Mordor Intelligence, the floating liquefied natural gas market size is projected to be USD 25.57 billion in 2025, USD 28.20 billion in 2026, and reach USD 44.72 billion by 2031, growing at a CAGR of 9.66% from 2026 to 2031.
This report is Segmented by Capacity (Small-Scale, Medium-Scale, and Large-Scale), Deployment Type (Offshore and Near-Shore), Application (Liquefaction, Regasification, and Storage and Transportation), and Geography (North America, Europe, Asia-Pacific, South America, and Middle East and Africa). The Market Sizes and Forecasts are Provided in Terms of Value (USD).
Global Floating Liquefied Natural Gas Market Trends and Insights
Gas-Demand Surge from Coal-to-Gas Switching in Asia
Natural-gas consumption in Asia is projected to rise 5% annually through 2030, creating an outsized call on flexible LNG supply. FLNG units offer Asian buyers strategic diversification beyond pipelines and long-haul cargoes by delivering gas directly from offshore sources to shore without extensive onshore terminals. Their mobility allows re-deployment to new demand nodes as industrial clusters migrate inland. Smaller Asian economies also favor FLNG when conventional import terminals face financing obstacles or land-use opposition, making floating infrastructure a bridge toward lower-emission energy targets. Large-scale deployments near China's eastern seaboard are complemented by modular units in the Philippines and Vietnam, where grid stability needs quick-turn LNG. The region's importers are set to absorb 70% of incremental global LNG by 2030, solidifying Asia's influence over FLNG market dynamics.
European Energy-Security Push Post-Russia Conflict
European LNG imports climbed to 143 bcm in 2025 on the REPowerEU requirement for 90 days of winter coverage. Germany commissioned four FSRUs that now liquefy and re-export excess volumes, letting buyers across Poland and the Czech Republic tap floating capacity without new pipelines. National Grid UK is locked in a fifteen-year capacity for three North Sea nearshore FLNG projects to reverse domestic import reliance. Destination-clause acceptance by European offtakers signals a structural shift that underpins the Floating Liquefied Natural Gas market's long-term visibility. All assets must now pass IEC 62443 cybersecurity certification, lifting technical barriers to entry for new contractors.
High CAPEX And Financing Risk Profile
Prelude's final bill reached USD 17 billion, double its sanction estimate, after corrosion issues forced re-work. Mozambique LNG's 2021 suspension stranded USD 23 billion, making lenders wary of adjacent FLNG without sovereign guarantees. Commercial banks now demand 1.4X debt-service coverage, achievable only with long-term oil-linked contracts above USD 60 Brent. Japanese and Korean export-credit agencies supplied USD 6.8 billion of guarantees in 2025, but sub-BB-sovereigns were ineligible, excluding 40% of frontier prospects. Tolling agreements curb price risk for owners yet expose them to volume risk if reservoirs underperform, pressuring cash flows in the Floating Liquefied Natural Gas market.
Other drivers and restraints analyzed in the detailed report include:
- Cost Competitiveness of FLNG versus On-Shore LNG
- Faster Time-to-Market for Stranded Offshore Gas Fields
- LNG Price-Cycle Volatility Delaying FIDs
For complete list of drivers and restraints, kindly check the Table Of Contents.
Segment Analysis
Large-scale platforms above 3 million tpa secured 56.2% of the Floating Liquefied Natural Gas market share in 2025. High throughput spreads hull amortization across more cargoes, anchoring the Floating Liquefied Natural Gas market size advantage that majors wield when negotiating long-term contracts. Prelude, PFLNG Dua, and Coral Sul together loaded 11.7 million tonnes in 2025, capturing Asian premiums of USD 0.80 /MMBtu over Henry Hub-linked supply. Yet the steep capital bill and charter lock-ins spur interest in medium-scale units that can relocate as reservoirs deplete. Golar's conversion model delivers such flexibility by repurposing mid-life carriers, slicing build time to 38 months, and offering operators an option to redeploy toward fresh gas hubs as regional demand pivots, strengthening the resilience of the Floating Liquefied Natural Gas market.
Medium-scale assets between 1 and 3 million tpa are expanding, where 200-meter depths let jack-up rigs perform maintenance, trimming offshore labor by 22%. Small-scale units under 1 million tpa cater to emerging e-methanol bunkering and island grids. Hyundai's 0.6-million-tpa standard design costs USD 480 million, 40% cheaper per tonne than custom mega-hulls. Classification societies now require dual-fuel propulsion on units above 2.5 million tpa, adding USD 180 million but unlocking EU Taxonomy financing. As digital twins optimize production uptime, capacity choice is shifting from a pure economies-of-scale decision toward a portfolio-risk calculus that balances utilization, redeployment agility, and compliance costs within the Floating Liquefied Natural Gas market.
Geography Analysis
North America anchored 33.9% of global revenue in 2025 as U.S. Gulf Coast producers leveraged Henry Hub feedgas priced USD 3.20 below Asian spot benchmarks, underpinning competitive delivered costs to Tokyo. New Fortress Energy's Fast LNG loaded 1.4 million t in its first full year and aims to replicate the design for three more Gulf platforms. A January 2026 British Columbia proposal seeks to ship Montney shale gas to Japan under 15-year JKM-indexed deals. Mexico is weighing nearshore units to liquefy associated gas in the Bay of Campeche, cutting flaring that hit 18 bcm in 2024.
Asia-Pacific is the fastest-growing Floating Liquefied Natural Gas market, expanding at 11.3% through 2031, with Australia, Indonesia, and Malaysia sanctioning 7.8 million tpa in 2025. Woodside's Browse FLNG will deploy a 3.5-million-tpa platform by 2029 after land opposition stalled the original onshore plan. Indonesia granted four FLNG licenses across the Natuna and Masela fields to serve its archipelago's dispersed power demand. Malaysia is constructing a third PFLNG that expects an 18% capex-per-tonne saving through modularization. India's ONGC is engineering a 1.8-million-tpa vessel for the Krishna-Godavari Basin to displace spot cargo imports priced at USD 12 /MMBtu.
Europe's share remains modest yet strategically important as floating regas hubs backfill Russian pipeline deficits. National Grid UK awarded 15-year contracts to three North Sea nearshore projects that will liquefy domestic gas for export to continental buyers by 2029. Germany's quartet of FSRUs functions as seasonal bidirectional hubs, exporting to Poland and the Czech Republic during shoulder months. Nordic ports are piloting small-scale FLNG for e-methanol bunkering, with a 0.8-million-tpa unit slated for Norway. Spain and France unlocked interconnector access parity for floating operators in March 2025 under the revised EU Gas Directive, widening arbitrage prospects. Sanctions continue to delay Russia's two planned Arctic FLNG units, deferring 6.6 million tpa until after 2028.
- Shell
- Petronas
- Golar LNG
- ExxonMobil
- Eni SpA
- Hoegh LNG
- Technip Energies
- Samsung Heavy Industries
- Hyundai Heavy Industries
- KBR
- JGC Corporation
- SBM Offshore
- BW Offshore
- MODEC
- TotalEnergies
- Chevron
- BP
- Mitsui OSK Lines
- New Fortress Energy
- Delfin Midstream
- Karoon Energy
- ENH Mozambique
Additional Benefits:
- The market estimate (ME) sheet in Excel format
- 3 months of analyst support
TABLE OF CONTENTS
1 Introduction
- 1.1 Study Assumptions & Market Definition
- 1.2 Scope of the Study
2 Research Methodology
3 Executive Summary
4 Market Landscape
- 4.1 Market Overview
- 4.2 Market Drivers
- 4.2.1 Gas-demand surge from coal-to-gas switching in Asia
- 4.2.2 European energy-security push post-Russia conflict
- 4.2.3 Cost competitiveness of FLNG versus on-shore LNG
- 4.2.4 Faster time-to-market for stranded offshore gas fields
- 4.2.5 AI & data-center induced coastal LNG power demand
- 4.2.6 Small-scale FLNG for e-methanol shipping fuels
- 4.3 Market Restraints
- 4.3.1 High CAPEX & financing risk profile
- 4.3.2 LNG price-cycle volatility delaying FIDs
- 4.3.3 Tightening methane-slip regulation on floating assets
- 4.3.4 Skilled-labour shortages in cryogenic module yards
- 4.4 Supply-Chain Analysis
- 4.5 Regulatory Landscape
- 4.6 Technological Outlook
- 4.7 Porters Five Forces
- 4.7.1 Threat of New Entrants
- 4.7.2 Bargaining Power of Suppliers
- 4.7.3 Bargaining Power of Buyers
- 4.7.4 Threat of Substitutes
- 4.7.5 Competitive Rivalry
- 4.8 Investment & Project Analysis
- 4.8.1 Key FLNG Projects - Operational
- 4.8.2 Key FLNG Projects - Under Construction
- 4.8.3 Key FLNG Projects - Planned / Announced
- 4.8.4 Project Economics & Feasibility
- 4.8.5 Joint-Ventures & Partnerships
5 Market Size & Growth Forecasts
- 5.1 By Capacity
- 5.1.1 Small-Scale (Below 1 MTPA)
- 5.1.2 Medium-Scale (1 to 3 MTPA)
- 5.1.3 Large-Scale (Above 3 MTPA)
- 5.2 By Deployment Type
- 5.2.1 Offshore
- 5.2.2 Near-shore
- 5.3 By Application
- 5.3.1 Liquefaction
- 5.3.2 Regasification
- 5.3.3 Storage and Transportation
- 5.4 By Geography
- 5.4.1 North America
- 5.4.1.1 United States
- 5.4.1.2 Canada
- 5.4.1.3 Mexico
- 5.4.2 Europe
- 5.4.2.1 United Kingdom
- 5.4.2.2 Germany
- 5.4.2.3 France
- 5.4.2.4 Spain
- 5.4.2.5 Nordic Countries
- 5.4.2.6 Russia
- 5.4.2.7 Rest of Europe
- 5.4.3 Asia-Pacific
- 5.4.3.1 China
- 5.4.3.2 India
- 5.4.3.3 Japan
- 5.4.3.4 South Korea
- 5.4.3.5 ASEAN Countries
- 5.4.3.6 Australia and New Zealand
- 5.4.3.7 Rest of Asia-Pacific
- 5.4.4 South America
- 5.4.4.1 Brazil
- 5.4.4.2 Argentina
- 5.4.4.3 Colombia
- 5.4.4.4 Rest of South America
- 5.4.5 Middle East and Africa
- 5.4.5.1 United Arab Emirates
- 5.4.5.2 Saudi Arabia
- 5.4.5.3 South Africa
- 5.4.5.4 Egypt
- 5.4.5.5 Rest of Middle East and Africa
- 5.4.1 North America
6 Competitive Landscape
- 6.1 Market Concentration
- 6.2 Strategic Moves (M&A, Partnerships, PPAs)
- 6.3 Market Share Analysis (Market Rank/Share for key companies)
- 6.4 Company Profiles (includes Global level Overview, Market level overview, Core Segments, Financials as available, Strategic Information, Products & Services, and Recent Developments)
- 6.4.1 Shell
- 6.4.2 Petronas
- 6.4.3 Golar LNG
- 6.4.4 ExxonMobil
- 6.4.5 Eni SpA
- 6.4.6 Hoegh LNG
- 6.4.7 Technip Energies
- 6.4.8 Samsung Heavy Industries
- 6.4.9 Hyundai Heavy Industries
- 6.4.10 KBR
- 6.4.11 JGC Corporation
- 6.4.12 SBM Offshore
- 6.4.13 BW Offshore
- 6.4.14 MODEC
- 6.4.15 TotalEnergies
- 6.4.16 Chevron
- 6.4.17 BP
- 6.4.18 Mitsui OSK Lines
- 6.4.19 New Fortress Energy
- 6.4.20 Delfin Midstream
- 6.4.21 Karoon Energy
- 6.4.22 ENH Mozambique
7 Market Opportunities & Future Outlook
- 7.1 White-space & Unmet-Need Assessment


