
|
시장보고서
상품코드
2062478
V2G(Vehicle-to-Grid) : 시장 점유율 분석, 업계 동향 및 통계, 성장 예측(2026-2031년)Vehicle-to-Grid (V2G) - Market Share Analysis, Industry Trends & Statistics, Growth Forecasts (2026 - 2031) |
||||||
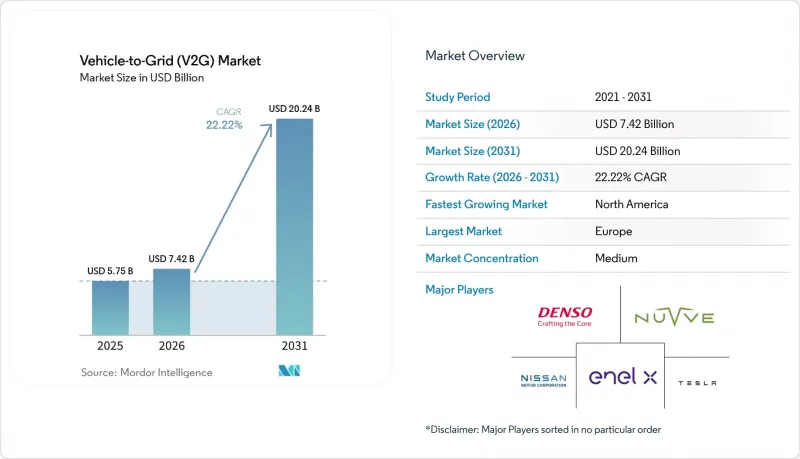
Mordor Intelligence에 의하면, V2G(Vehicle-to-Grid) 시장 규모는 2025년에 57억 5,000만 달러로 평가되었습니다. 2026년 74억 2,000만 달러에서 2031년까지 202억 4,000만 달러에 이를 것으로 예상되며, 예측 기간(2026-2031년) CAGR은 22.22%를 나타낼 전망입니다.

본 보고서는 구성 요소(전기차, V2G 충전소 등), 충전 인프라(AC 충전, DC 충전, 하이브리드), 차종(BEV, PHEV, FCEV), 용도(상업용, 개인용), 지역(북미, 유럽, 아시아태평양, 남미, 중동 및 아프리카)별로 분류되어 있습니다. 시장 전망은 금액(달러) 기준으로 제시되어 있습니다.
세계의 V2G(Vehicle-to-Grid) 시장 동향과 인사이트
전기차 보유 대수의 급속한 증가와 지원성 인센티브
차량 함대의 전기화를 통해 회수 기간이 단축됩니다. 이는 사업자가 주택 소유자라면 쉽게 얻을 수 없는 시간대별 요금의 차익 거래, 수요 요금 절감, 그리고 주파수 조정을 통한 수입을 조합하여 활용할 수 있기 때문입니다. 일본 경제산업성은 2025년에 V2H 설치 1건당 75만 엔(약 5,000달러)을 지원하여 1만 대 이상의 닛산 리프 연결을 촉진했습니다. 이는 하드웨어 구매가 아닌, 측정된 전력망 서비스에 보조금을 연계하는 방식으로 설계되어 있습니다. 캘리포니아주 유틸리티위원회는 2027년까지 150MW의 V2G 도입 용량과 2030년까지 7GW의 부하 이동 목표를 지시함으로써, 2024년 이전에 프로젝트를 제한했던 정책상의 모호함을 해소했습니다. 중국 국가에너지국은 2024년에 쑤저우에서 100대 규모의 시범 사업을 시작할 예정이며, 향후 전국적인 통합이 이루어질 것임을 시사하고 있지만, 각 성별 상호연결 규정은 여전히 제각각입니다. 등록 의무나 비용 회수 메커니즘이 적용되는 시장에는 불균형할 정도로 많은 투자가 몰리는 반면, 자발적인 노력에 그치는 지역에서는 여전히 뒤처져 있습니다.
재생에너지 비중 확대가 송전망의 유연성 수요를 가속화
2025년, 유럽의 일부 송전망에서 변동성이 큰 재생에너지 도입률이 40%를 넘어서면 주간 변동성이 커졌지만, 전기차 배터리는 최소한의 추가 비용으로 이러한 변동성을 차익거래를 통해 상쇄할 수 있습니다. 독일 연방네트워크청은 2025년부터 최저 입찰 가격 1MW로 통합된 전기차 차량군에 주파수 안정화 예비 전력을 개방하여, 중규모 충전소가 참여할 수 있도록 했습니다. 덴마크의 eMabler 사용자들은 주파수 조정 계약을 통해 월 38-76달러의 수익을 올리고 있으며, 최적화된 운영을 수행하는 상용 차량 함대의 경우 이 수익이 152달러까지 증가했습니다. 호주의 ARENA가 자금을 지원한 REVS 시험에서는 150대의 차량이 200밀리초 이내에 응답할 수 있음이 입증되었으며, 이는 스피닝 리저브를 능가하는 성능을 보여주었습니다. 출력 억제 현상이 증가하는 가운데, 전력 회사들은 신규 피크 발전소보다 V2G를 선호하는 경향을 보이고 있습니다. 이는 분산형 배터리가 송전망의 업그레이드를 피할 수 있을 뿐만 아니라, 1초 미만의 급격한 출력 변동에도 대응할 수 있기 때문입니다.
배터리 성능 저하 및 보증에 관한 우려
매일 반복되는 V2G 사이클은 10년 동안 배터리 잔량(SOH)을 9-14% 감소시키며, 2030년까지 약 140달러/MWh의 보상 지급으로 이어집니다. 대부분의 OEM 보증에서는 시스템으로의 방전이 보증 대상에서 제외됩니다. 닛산 리프의 보증 조건에 따르면, 텔레메트리 시스템을 통해 특정 시스템으로의 과도한 전력 공급이 감지될 경우 보증이 무효화됩니다. 테슬라의 사이버트럭은 소유자의 방전 주기를 연간 365회로 제한하고 있어, 8년 배터리 보증을 무효화하지 않으면서 사실상 매일 V2G를 차단하고 있습니다. 전력망으로의 송전에 대한 가격 책정을 보장하는 단계적 조치가 없는 한, V2G는 상용차용 솔루션에 그칠 것입니다.
부문별 분석
2025년에는 전기차가 매출의 48.3%를 차지했으나, V2G 충전소는 연평균 성장률(CAGR) 25.8%로 증가할 것으로 전망됩니다. 이는 인프라 사업자가 현재 하드웨어로 인한 일시적인 이익이 아닌,월이용료를 통해 수익을 창출하는 에너지 관리 소프트웨어를 패키지로 제공하고 있기 때문입니다. 에너지 관리 플랫폼은 차량 1대당월15-30달러를 청구하여 60-70%의 매출총이익률을 기록하고 있으며, 이는 충전기의 일반적인 20-30%를 훨씬 상회하는 수치입니다.
소프트웨어의 부상으로 V2G(Vehicle-to-Grid) 시장은 재편되고 있습니다. 한때 금속 및 플라스틱 부품의 마진으로 번영했던 부품 공급업체들은 이제 텔레메트리, ISO 15118-20 준수, 그리고 실시간 배차 시스템을 익혀야 합니다. 그 결과, 소프트웨어에 기인한 V2G(Vehicle-to-Grid) 시장 규모는 시장 전체의 성장률을 웃도는 속도로 확대되고 있습니다. 한편, 상품화된 스마트 미터나 통신 기기는 유틸리티자의 설비 갱신 계획에 포함되는 경우가 많아, 단독으로 수익을 창출할 가능성은 제한적입니다.
AC 기기는 2025년 매출의 57.6%를 차지했습니다. 이는 야간 주차 시간을 활용해 7-11kW의 충전을 저렴한 비용으로 할 수 있기 때문입니다. 그럼에도 불구하고, AC와 DC를 결합한 하이브리드 솔루션은 저렴한 AC 야간 충전과 부가 서비스 계약을 위한 50-150kW의 DC 방전을 융합함으로써 29.2%라는 가장 높은 연평균 성장률(CAGR)을 달성할 것으로 예측됩니다.
이처럼 하이브리드 플랫폼은 실용적인 균형을 실현하고 있습니다. 설치 비용은 약 1만 2,000달러로, 단독 DC 하드웨어보다 3분의 1 저렴하며, 스쿨버스 차고의 경우 주파수 조정을 통해 얻는 수입으로 투자 회수 기간을 4년으로 단축할 수 있습니다. 이러한 범용성 덕분에 V2G(Vehicle-to-Grid) 시장은 자산의 중복 없이 출퇴근용 에너지 및 전력망 서비스의 수익화를 모두 지원하는 인프라로 전환되고 있습니다.
지역별 분석
유럽은 2025년에 40.2%의 점유율을 유지했습니다. 이는 독일의 1MW 입찰 기준치와 EU 전역에서의 ISO 15118-20 의무화 조치에 힘입은 결과입니다. 영국의 역동적인 송전 요금 제도는 피크 시간대 요금을 3배로 인상하고, 주택용 투자 회수 기간을 절반으로 단축시키고 있습니다. 또한, 프랑스의 자동차 제조업체인 르노 그룹이 위트레흐트에서 실시한 500대 규모의 실증 실험을 통해 승용차도 RTE의 수급 조정 요건을 충족할 수 있음이 입증되었습니다.
북미는 가장 빠르게 성장하고 있는 지역으로, 2031년까지 연평균 성장률(CAGR) 25.1%를 기록하며 성장하고 있습니다. 캘리포니아주의 150MW 도입 목표와 ChargeScape사의 600만 대 규모 플랫폼이 규모 확대를 뒷받침하고 있습니다. 온타리오주와 퀘벡주에서 진행 중인 캐나다의 시범 사업은 기술적 준비가 완료되었음을 보여주고 있지만, 전력 판매 요금이 정해지지 않아 상용화가 지연되고 있습니다. 멕시코는 아직 초기 단계이지만, 국경을 넘어 전력 회사들 간에 체결된 계약은 향후 이러한 방식이 널리 보급될 것임을 시사하고 있습니다.
아시아태평양의 성장은 중국 국가전망이 쑤저우와 상하이에서 진행하는 시범 사업, 일본의 4,716달러 규모의 V2H 보조금, 그리고 한국에서 진행되는 500대 규모의 주파수 조정 시험에 달려 있습니다. CHAdeMO와 CCS 간의 프로토콜 불일치로 인해 여전히 비용이 증가하고 있으며, 아세안 국가들에서는 대규모 도입에 나서기 전에 전기차 보급률이 높아지기를 기다리고 있습니다. 호주의 ARENA가 자금을 지원하는 REVS 프로젝트는 기술적 실현 가능성을 확인했으나, 분열된 전국 전력 시장의 규제를 극복해야 합니다.
기타 혜택 :
- 엑셀 형식 시장 예측(ME) 시트
- 3개월간의 애널리스트 지원
자주 묻는 질문
목차
제1장 서론
제2장 조사 방법
제3장 주요 요약
제4장 시장 구도
제5장 시장 규모 및 성장 예측
제6장 경쟁 구도
제7장 시장 기회 및 향후 전망
KTHAccording to Mordor Intelligence, the vehicle-to-Grid market size was valued at USD 5.75 billion in 2025 and is estimated to grow from USD 7.42 billion in 2026 to reach USD 20.24 billion by 2031, at a CAGR of 22.22% during the forecast period (2026-2031).
This report is Segmented by Component (Electric Vehicles, V2G Charging Stations, and More), Charging Infrastructure (AC Charging, DC Charging, Hybrid), Vehicle Type (BEVs, Phevs, Fcevs), Application (Commercial, Individual), and Geography (North America, Europe, Asia-Pacific, South America, Middle East and Africa). The Market Forecasts are Provided in Terms of Value (USD).
Global Vehicle-to-Grid (V2G) Market Trends and Insights
Rapid EV Parc Expansion & Supportive Incentives
Fleet electrification compresses payback periods because operators can layer time-of-use arbitrage, demand-charge reduction, and frequency-regulation income that residential owners cannot easily capture. Japan's Ministry of Economy, Trade, and Industry paid JPY 750,000 (≈ USD 5,000) per V2H installation in 2025, spurring over 10,000 Nissan Leaf connections, a design that ties subsidies to measured grid services rather than hardware purchases . California's Public Utilities Commission ordered 150 MW of enrolled V2G capacity by 2027 and a 7 GW load-shift goal by 2030, eliminating policy ambiguity that suppressed projects before 2024 . China's National Energy Administration started a 100-vehicle pilot in Suzhou in 2024, signaling future nationwide integration, though provincial interconnection rules remain uneven. Markets that impose binding enrollment or cost-recovery mechanisms attract disproportionate investment, while voluntary jurisdictions continue to lag.
Accelerating Renewables Share Driving Grid-Flexibility Need
Variable renewable penetration above 40% in several European grids during 2025 increases intraday volatility that EV batteries can arbitrage at minimal incremental cost. Germany's Bundesnetzagentur opened frequency-containment reserves to aggregated EV fleets at 1 MW minimum bids in 2025, enabling mid-size depots to participate . Denmark's eMabler users earned USD 38-76 per month from frequency-regulation contracts, rising to USD 152 for commercial fleets with optimized dispatch. Australia's ARENA-funded REVS trial proved 150 vehicles could respond within 200 ms, outperforming spinning reserves. As curtailment events multiply, utilities prefer V2G over new peaker plants because distributed batteries avoid transmission upgrades and deliver sub-second ramp rates.
Battery Degradation & Warranty Concerns
Daily V2G cycles impose 9-14% state-of-health loss over 10 years, translating to roughly USD 140/MWh in make-whole payments by 2030. Most OEM warranties exclude grid discharge; Nissan's Leaf warranty voids coverage if telemetry detects excessive export events. Tesla's Cybertruck limits owners to 365 discharge cycles annually, effectively blocking daily V2G without voiding the 8-year battery warranty. Without tiered warranties that price grid duty, V2G remains a commercial-fleet proposition.
Other drivers and restraints analyzed in the detailed report include:
- Aggregator-Based Business Models Gaining Regulatory Clarity
- Declining Bidirectional Charger CAPEX
- Interoperability & Protocol Fragmentation
For complete list of drivers and restraints, kindly check the Table Of Contents.
Segment Analysis
Electric Vehicles supplied 48.3% revenue in 2025, yet V2G Charging Stations are forecast to climb at 25.8% CAGR because infrastructure players now package energy-management software that earns monthly fees rather than one-time hardware profits. Energy-management platforms charge fleets USD 15-30 per vehicle monthly and earn 60-70% gross margins, dwarfing the 20-30% typical for chargers.
Software's emergence is reshaping the Vehicle-to-Grid (V2G) market; component suppliers that once thrived on metal-and-plastic margins must now master telemetry, ISO 15118-20 compliance, and real-time dispatch. The Vehicle-to-Grid (V2G) market size attributable to software is consequently expanding faster than aggregate growth, while commoditized smart meters and communication devices are bundled into utility upgrades with limited standalone revenue potential.
AC equipment captured 57.6% of 2025 revenue because overnight dwell times allow 7-11 kW charging at low cost. Still, hybrid AC-plus-DC solutions are projected to deliver the highest 29.2% CAGR, blending cheap AC overnight charging with 50-150 kW DC discharge for ancillary-service contracts.
Hybrid platforms thus strike a pragmatic balance: installed at ≈ USD 12,000, they undercut standalone DC hardware by one-third and shorten payback for school-bus depots to four years on frequency-regulation income. This versatility underpins the Vehicle-to-Grid (V2G) market's shift toward infrastructure that supports both commuting energy and grid-service monetization without duplicating assets.
Geography Analysis
Europe retained 40.2% share in 2025, propelled by Germany's 1 MW bid threshold and the EU-wide ISO 15118-20 mandate. The United Kingdom's dynamic export tariffs triple peak-hour prices, halving residential payback times, and French automaker Renault Group's 500-vehicle Utrecht trial proved passenger cars can satisfy RTE's balancing requirements.
North America is the fastest-growing region, expanding at 25.1% CAGR through 2031, with California's 150 MW enrollment target and ChargeScape's 6 million-vehicle platform providing scale. Canadian pilots in Ontario and Quebec demonstrate technical readiness, yet the absence of export tariffs delays commercial rollouts. Mexico remains nascent, though cross-border utility contracts hint at future uptake.
Asia-Pacific growth hinges on China's State Grid pilots in Suzhou and Shanghai, Japan's USD 4716 V2H subsidy, and South Korea's 500-vehicle frequency-regulation test. Protocol fragmentation between CHAdeMO and CCS still inflates costs, and ASEAN markets await higher EV penetration before committing to large deployments. Australia's ARENA-funded REVS project confirms technical viability but must navigate fragmented National Electricity Market rules.
- Nissan Motor Corporation
- Mitsubishi Motors Corporation
- Tesla Inc.
- Denso Corporation
- Enel X (Enel Group)
- Nuvve Holding Corp.
- The Mobility House
- Fermata Energy
- ABB Ltd.
- Hitachi Energy
- Renault Group
- Honda Motor Co., Ltd.
- Hyundai Motor Co.
- BYD Company Ltd.
- Siemens AG
- Wallbox Chargers, S.L.
- ENGIE SA
- EV Connect, Inc.
- NextEra Energy, Inc.
- ChargePoint Holdings, Inc.
Additional Benefits:
- The market estimate (ME) sheet in Excel format
- 3 months of analyst support
TABLE OF CONTENTS
1 Introduction
- 1.1 Study Assumptions & Market Definition
- 1.2 Scope of the Study
2 Research Methodology
3 Executive Summary
4 Market Landscape
- 4.1 Market Overview
- 4.2 Market Drivers
- 4.2.1 Rapid EV parc expansion & supportive incentives
- 4.2.2 Accelerating renewables share driving grid-flexibility need
- 4.2.3 Aggregator-based business models gaining regulatory clarity
- 4.2.4 Declining bidirectional charger CAPEX
- 4.2.5 Blockchain-enabled micro-settlements for V2G transactions
- 4.2.6 Second-life battery integration with V2G networks
- 4.3 Market Restraints
- 4.3.1 Battery degradation & warranty concerns
- 4.3.2 Interoperability & protocol fragmentation
- 4.3.3 EV-SE cyber-security vulnerabilities
- 4.3.4 Distribution transformer stress from reverse power flows
- 4.4 Supply-Chain Analysis
- 4.5 Regulatory Landscape
- 4.6 Technological Outlook
- 4.7 Porter's Five Forces
- 4.7.1 Threat of New Entrants
- 4.7.2 Bargaining Power of Buyers
- 4.7.3 Bargaining Power of Suppliers
- 4.7.4 Threat of Substitutes
- 4.7.5 Competitive Rivalry
5 Market Size & Growth Forecasts
- 5.1 By Component
- 5.1.1 Electric Vehicles (EVs)
- 5.1.2 V2G Charging Stations
- 5.1.3 Smart Meters and Communication Devices
- 5.1.4 Energy Management Systems (EMS)
- 5.1.5 Software and Platforms
- 5.2 By Charging Infrastructure
- 5.2.1 AC Charging
- 5.2.2 DC Charging
- 5.2.3 Hybrid
- 5.3 By Vehicle Type
- 5.3.1 Battery Electric Vehicles (BEVs)
- 5.3.2 Plug-in Hybrid Electric Vehicles (PHEVs)
- 5.3.3 Fuel Cell Electric Vehicles (FCEVs)
- 5.4 By Application
- 5.4.1 Commercial
- 5.4.2 Individual
- 5.5 By Geography
- 5.5.1 North America
- 5.5.1.1 United States
- 5.5.1.2 Canada
- 5.5.1.3 Mexico
- 5.5.2 Europe
- 5.5.2.1 Germany
- 5.5.2.2 United Kingdom
- 5.5.2.3 France
- 5.5.2.4 Italy
- 5.5.2.5 NORDIC Countries
- 5.5.2.6 Russia
- 5.5.2.7 Rest of Europe
- 5.5.3 Asia-Pacific
- 5.5.3.1 China
- 5.5.3.2 India
- 5.5.3.3 Japan
- 5.5.3.4 South Korea
- 5.5.3.5 ASEAN Countries
- 5.5.3.6 Rest of Asia-Pacific
- 5.5.4 South America
- 5.5.4.1 Brazil
- 5.5.4.2 Argentina
- 5.5.4.3 Rest of South America
- 5.5.5 Middle East and Africa
- 5.5.5.1 Saudi Arabia
- 5.5.5.2 United Arab Emirates
- 5.5.5.3 South Africa
- 5.5.5.4 Egypt
- 5.5.5.5 Rest of Middle East and Africa
- 5.5.1 North America
6 Competitive Landscape
- 6.1 Market Concentration
- 6.2 Strategic Moves (M&A, Partnerships, PPAs)
- 6.3 Market Share Analysis (Market Rank/Share for key companies)
- 6.4 Company Profiles (includes Global level Overview, Market level overview, Core Segments, Financials as available, Strategic Information, Products & Services, and Recent Developments)
- 6.4.1 Nissan Motor Corporation
- 6.4.2 Mitsubishi Motors Corporation
- 6.4.3 Tesla Inc.
- 6.4.4 Denso Corporation
- 6.4.5 Enel X (Enel Group)
- 6.4.6 Nuvve Holding Corp.
- 6.4.7 The Mobility House
- 6.4.8 Fermata Energy
- 6.4.9 ABB Ltd.
- 6.4.10 Hitachi Energy
- 6.4.11 Renault Group
- 6.4.12 Honda Motor Co., Ltd.
- 6.4.13 Hyundai Motor Co.
- 6.4.14 BYD Company Ltd.
- 6.4.15 Siemens AG
- 6.4.16 Wallbox Chargers, S.L.
- 6.4.17 ENGIE SA
- 6.4.18 EV Connect, Inc.
- 6.4.19 NextEra Energy, Inc.
- 6.4.20 ChargePoint Holdings, Inc.
7 Market Opportunities & Future Outlook
- 7.1 White-space & Unmet-need Assessment
