
|
시장보고서
상품코드
2062479
탄소배출권 거래 플랫폼 시장 : 시장 점유율 분석, 업계 동향 및 통계, 성장 예측(2026-2031년)Carbon Credit Trading Platform - Market Share Analysis, Industry Trends & Statistics, Growth Forecasts (2026 - 2031) |
||||||
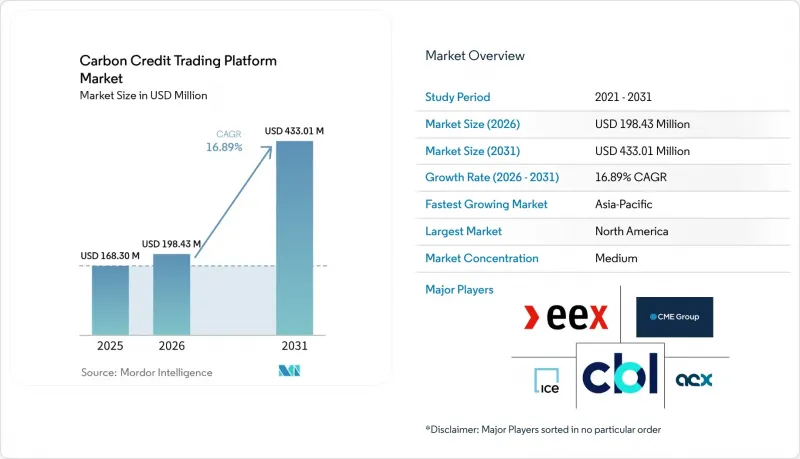
Mordor Intelligence에 의하면, 탄소배출권 거래 플랫폼 시장 규모는 2025년 1억 6,830만 달러로 평가되었고, 2026년에는 1억 9,843만 달러로 추정되고, 2026-2031년 CAGR 16.89%로 성장을 지속할 전망이며, 2031년에는 4억 3,301만 달러에 이를 것으로 예측됩니다.

본 보고서는 유형별(자발적, 규제 대응), 용도별(재생 에너지, 재조림 및 조림, 탄소 포집 및 저장, 기타 용도), 최종 사용자별(기업, 정부, 개인), 그리고 지역별(북미, 유럽, 아시아태평양, 남미, 중동 및 아프리카)로 분류되어 있습니다. 시장 전망은 금액(달러) 기준으로 제시되어 있습니다.
세계의 탄소 배출권 거래 플랫폼 시장 동향 및 분석
기업의 탄소 중립에 대한 의지 강화
마이크로소프트는 2025년에 21개 공급업체와 총 4,500만 tCO2e 규모의 계약을 체결하여, 2024년 구매량을 두 배로 늘렸습니다. 여기에는 Indigo Ag와 12년에 걸쳐 톤당 60-80달러에 거래되는 285만 톤의 토양 탄소 거래도 포함되어 있습니다. 세일즈포스 및 기타 포춘 500대 기업들이 채택한 이와 유사한 다년 계약 구조는 예측 가능한 수주 흐름을 창출하며, 플랫폼은 이를 표준화된 선물 거래에 통합할 수 있습니다. 이를 통해 신뢰도가 높은 제거 크레딧과 회피 크레딧을 구분할 수 있게 됩니다. 과학 기반 목표 이니셔티브(SBTi)의 지침에 따르면, 현재 중화 수단으로 배출량 상쇄만 인정되고 있으며, 플랫폼은 상세한 크레딧 태깅 및 자동 상쇄 기능을 탑재해야 합니다. 장기 계약은 프로젝트의 자금 조달 가능성을 높여, 직접 공기 포집(DAC)과 같은 기술적 솔루션에 자본을 집중시킵니다. 이러한 안정적인 조달 파이프라인은 탄소 크레딧 거래 플랫폼 시장의 가시성을 높여줍니다.
확대되는 규정 준수형 탄소 가격 제도
중국은 2027년까지 철강, 시멘트, 알루미늄을 배출권 거래 제도(ETS)에 포함시켜, 1,500개 사업체와 30억 tCO2e를 절대 배출 상한선 적용 대상으로 삼을 예정입니다. 일본의 GX-ETS는 2026년에 가동을 시작하고, 한국은 K-ETS 4단계를 시작하며, 인도의 시범 제도도 진행 중이어서, 플랫폼이 통합해야 할 범아시아적 가격대가 형성되고 있습니다. 아세안(ASEAN) 회원국들은 산정 기준의 조화를 도모하기 위해 '공동 탄소 프레임워크'에 서명했으며, 한편 인도네시아는 중국의 배출권 거래 제도(ETS)와의 양자 협력을 검토하고 있습니다. 이러한 움직임은 규정 준수 및 유동성을 높이고, 지역 간 차익거래 기회를 축소하며, 크로스리스트 상품의 발전을 촉진합니다. 자발적 탄소 시장을 위한 무결성 위원회(ICVCM)와 같은 기준 설정 기관들은 상장 필수 조건으로 자리 잡아가고 있으며, 품질 및 통합에 관한 요건을 강화하고 있습니다.
탄소 크레딧 가격의 급격한 변동
REDD+ 일관성 평가를 거친 후, 2024년에는 스팟 회피 상쇄 크레딧의 가격이 톤당 5달러 아래로 떨어졌으나, 2025년에는 차별화된 가격 책정이 정착되면서 가격이 반등했습니다. CORSIA 인증 원료공급은 여전히 부족하여, 가격은 15달러를 상회하며 유지되고 있습니다. 한편, EU 배출권 거래 제도(EU ETS)의 배출권 가격은 2025년에 70유로에서 115유로 사이에서 변동했습니다. 표준화된 계약은 아직 초기 단계에 있으며, 시장 조성자의 인센티브도 낮기 때문에 각 플랫폼 업체들은 선물 시장 육성에 어려움을 겪고 있습니다. 따라서, 수년에 걸친 탄소 중립 목표를 가진 구매자들은 헤지 격차에 직면해 있으며, 이는 단기적인 도입을 주저하게 만들어 탄소 크레딧 거래 플랫폼 시장의 성장을 저해하고 있습니다.
부문별 분석
2025년, 컴플라이언스 시장은 EU ETS, 중국의 전국 배출권 거래 제도(ETS), 그리고 북미의 배출권 거래 제도에 힘입어 탄소 배출권 거래 플랫폼 시장 점유율의 77.8%를 차지했습니다. EU 시장안정화준비금(MSR)은 2024년에 2억 7,500만 단위의 배출권을 회수할 예정이며, 2026년부터 해운 부문이 포함됨에 따라 9,000만 tCO2e의 의무가 추가될 것입니다. 캘리포니아주, RGGI, 한국은 총 20억 톤 이상의 배출 상한선을 설정하여 정기적인 경매 결제를 뒷받침하고 있습니다. 자발적 탄소 시장 플랫폼은 기업 구매자들의 신뢰할 수 있는 탄소 제거 솔루션에 대한 관심이 높아지는 가운데, 2031년까지 상당한 성장이 예상됩니다. 제6조에 따른 양자 간 협력 및 CORSIA의 선택적 적용으로 인해 각 제도 간의 경계가 모호해지면서, 통합된 결제 인프라가 요구되고 있습니다. 토큰화된 자발적 크레딧은 새로운 유동성을 제공하지만, Oracle 및 규제상의 장벽이 자본 시장 참여를 가로막고 있습니다.
지역별 분석
북미는 2025년 수익의 36.2%를 차지했으며, 캘리포니아주의 배출권 거래제 및 배출권 가격 격차 해소를 목표로 한 워싱턴주와 퀘벡주의 협력안이 이를 주도하고 있습니다. 캐나다 연방 정부의 최저 가격은 2030년에 170캐나다 달러(125달러)에 달할 전망이며, 임업을 통한 상쇄를 촉진하는 한편, 멕시코는 USMCA(미국·멕시코·캐나다 협정)에 부합하기 위해 3달러의 세제를 재검토하고 있습니다.
아시아태평양은 가장 빠르게 성장하는 지역으로, 2031년까지 연평균 성장률(CAGR)이 22.3%를 나타낼 것으로 전망됩니다. 중국의 배출권 거래 제도(ETS)는 2027년까지 중공업 분야를 포함할 예정이며, 2030년까지 최대 110억 tCO2e 규모의 거래가 이루어질 가능성이 있습니다. 동남아시아에서는 2025년 4월까지 284건의 프로젝트를 통해 1억 7,150만 tCO2e가 발행되었으며, 이 중 73%는 자연 기반 솔루션(NBS)을 통해 달성된 것입니다. 일본, 한국, 인도가 성장세를 이어가는 반면, EU의 CBAM(탄소국경조정조치)은 수출업체들에게 국내 가격 책정 제도 도입을 요구하며, 탄소 배출권을 지역 플랫폼으로 유도하고 있습니다.
유럽은 여전히 규제 면에서 선도적인 역할을 하고 있습니다. EU ETS 경매는 2024년에 388억 유로(451억 5,000만 달러)의 수익을 창출할 것이며, 2026년부터는 해운 부문의 배출량도 새로운 수요원이 될 것입니다. 영국은 재협력 가능성에 대해 협상 중이며, 브라질의 자발적 REDD+ 프로젝트가 전 세계 공급을 뒷받침하고 있고, 걸프 국가들은 부문별 제도를 검토하고 있는데, 이는 탄소 배출권 거래 플랫폼 시장의 지리적 다양성이 확대되고 있음을 보여줍니다.
기타 혜택 :
- 엑셀 형식 시장 예측(ME) 시트
- 3개월간의 애널리스트 지원
자주 묻는 질문
목차
제1장 서론
제2장 조사 방법
제3장 주요 요약
제4장 시장 구도
제5장 시장 규모 및 성장 예측
제6장 경쟁 구도
제7장 시장 기회 및 향후 전망
AJYAccording to Mordor Intelligence, the carbon credit trading platform market size is expected to grow from USD 168.30 million in 2025 to USD 198.43 million in 2026 and is forecast to reach USD 433.01 million by 2031 at 16.89% CAGR over 2026-2031.
This report is Segmented by Type (Voluntary, Compliance), Application (Renewable Energy, Reforestation/Afforestation, Carbon Capture and Storage, Other Applications), End-User (Corporates, Governments, Individuals), and Geography (North America, Europe, Asia-Pacific, South America, Middle East and Africa). Market Forecasts are Provided in Terms of Value (USD).
Global Carbon Credit Trading Platform Market Trends and Insights
Escalating Corporate Net-Zero Commitments
Microsoft doubled its 2024 offtake by contracting 45 million tCO2e in 2025 across 21 suppliers, including a 2.85 million-ton soil-carbon deal with Indigo Ag priced at USD 60-80 per ton over 12 years . Similar multi-year structures adopted by Salesforce and other Fortune 500 firms create a predictable order flow that platforms can bundle into standardized futures, differentiating high-integrity removals from avoidance credits. Science-Based Targets Initiative guidance now accepts only removals for neutralization, forcing platforms to embed granular credit tagging and automated retirement. Long-dated contracts also improve project bankability, crowding capital into engineered solutions such as direct air capture. This steady procurement pipeline lifts visibility for the carbon credit trading platform market.
Expanding Compliance Carbon Pricing Schemes
China will add steel, cement, and aluminum to its ETS by 2027, bringing 1,500 entities and 3 billion tCO2e under absolute caps. Japan's GX-ETS went live in 2026, South Korea began K-ETS Phase 4, and India's pilot scheme is underway, forming a pan-Asian pricing corridor that platforms must stitch together. ASEAN members signed a Common Carbon Framework to harmonize accounting, while Indonesia considers a bilateral linkage with China's ETS. These developments lift compliance liquidity, narrow regional arbitrage, and stimulate cross-listed products. Standard-setting bodies such as the Integrity Council for the Voluntary Carbon Market are quickly becoming prerequisites for listing, raising quality and integration requirements.
High Price Volatility of Carbon Credits
Spot avoidance offsets crashed below USD 5 per ton in 2024 after REDD+ integrity probes, then rebounded in 2025 as differentiated pricing emerged . CORSIA-eligible supply remains tight, keeping prices above USD 15, while EU ETS allowances swung between EUR 70 and EUR 115 in 2025. Platforms struggle to seed deep futures markets because standardized contracts are still nascent and market-maker incentives are low. Buyers with multi-year neutrality goals therefore face hedging gaps, dampening near-term adoption and tempering growth in the carbon credit trading platform market.
Other drivers and restraints analyzed in the detailed report include:
- Increased Investor Demand for ESG Products
- Technological Advancements in Digital MRV & Blockchain
- Rising Scrutiny of Additionality & Permanence
For complete list of drivers and restraints, kindly check the Table Of Contents.
Segment Analysis
Compliance venues generated 77.8% of the carbon credit trading platform market share in 2025, buoyed by the EU ETS, China's national ETS, and North American cap-and-trade programs. The EU's Market Stability Reserve withdrew 275 million allowances in 2024, while maritime inclusion from 2026 adds another 90 million tCO2e obligation. California, RGGI, and South Korea collectively cap over 2 billion tons, underpinning recurring auction settlement traffic. Voluntary carbon market platforms are projected to experience significant growth through 2031, driven by corporate buyers' increasing focus on high-integrity carbon removal solutions. Article 6 bilateral linkages and selective CORSIA eligibility blur lines between regimes, demanding unified settlement rails. Tokenized voluntary credits provide new liquidity, though oracle and regulatory hurdles dampen capital markets participation.
Geography Analysis
North America controlled 36.2% of 2025 revenue, led by California's Cap-and-Trade and a Washington-Quebec draft linkage designed to narrow allowance price gaps. Canada's federal backstop hits CAD 170 (USD 125) in 2030, catalyzing forestry offsets, while Mexico reviews its USD 3 tax to align with USMCA.
Asia-Pacific is the fastest-growing region, forecast at 22.3% CAGR to 2031. China's ETS will cover heavy industry by 2027 and could trade up to 11 billion tCO2e by 2030. Southeast Asia recorded 284 projects issuing 171.5 million tCO2e by April 2025, 73% from nature-based solutions. Japan, South Korea, and India add momentum, while EU CBAM pressures exporters to adopt internal pricing, funneling credits onto regional platforms.
Europe remains the regulatory bellwether. EU ETS auctions generated EUR 38.8 billion (USD 45.15 billion) in 2024, and maritime emissions add fresh demand from 2026. The U.K. negotiates potential relinking, Brazil's voluntary REDD+ projects feed global supply, and Gulf states explore sector-specific schemes, signaling expanding geographic diversity for the carbon credit trading platform market.
- Xpansiv
- AirCarbon Exchange (ACX)
- Climate Impact X
- CME Group Inc.
- Intercontinental Exchange (ICE)
- European Energy Exchange (EEX)
- Carbon Trade Exchange (CTX)
- Nasdaq
- Toucan
- Verra Registry
- Gold Standard
- ClearBlue Markets
- South Pole
- Flowcarbon
- Patch
- Regreener
- Carbonplace
- Thallo
- Cloverly
- IncubEx
Additional Benefits:
- The market estimate (ME) sheet in Excel format
- 3 months of analyst support
TABLE OF CONTENTS
1 Introduction
- 1.1 Study Assumptions & Market Definition
- 1.2 Scope of the Study
2 Research Methodology
3 Executive Summary
4 Market Landscape
- 4.1 Market Overview
- 4.2 Market Drivers
- 4.2.1 Escalating Corporate Net-Zero Commitments
- 4.2.2 Expanding Compliance Carbon Pricing Schemes
- 4.2.3 Increased Investor Demand for ESG Products
- 4.2.4 Technological Advancements in Digital MRV & Blockchain
- 4.2.5 Integration of Carbon Credits into Consumer Loyalty Platforms
- 4.2.6 Tokenization of Nature-Based Assets Enabling Micro-Transactions
- 4.3 Market Restraints
- 4.3.1 High Price Volatility of Carbon Credits
- 4.3.2 Lack of Global Standardization & Fragmented Regulations
- 4.3.3 Rising Scrutiny of Additionality & Permanence by Rating Agencies
- 4.3.4 Limited On-Chain Liquidity for Large Block Trades
- 4.4 Supply-Chain Analysis
- 4.5 Regulatory Landscape
- 4.6 Technological Outlook
- 4.7 Porter's Five Forces
- 4.7.1 Threat of New Entrants
- 4.7.2 Bargaining Power of Buyers
- 4.7.3 Bargaining Power of Suppliers
- 4.7.4 Threat of Substitutes
- 4.7.5 Competitive Rivalry
5 Market Size & Growth Forecasts
- 5.1 By Type
- 5.1.1 Voluntary Carbon Market Platforms
- 5.1.2 Compliance Carbon Market Platforms
- 5.2 By Application
- 5.2.1 Renewable Energy
- 5.2.2 Reforestation/Afforestation
- 5.2.3 Carbon Capture and Storage
- 5.2.4 Other Applications
- 5.3 By End-User
- 5.3.1 Corporates
- 5.3.2 Governments
- 5.3.3 Individuals
- 5.4 By Geography
- 5.4.1 North America
- 5.4.1.1 United States
- 5.4.1.2 Canada
- 5.4.1.3 Mexico
- 5.4.2 Europe
- 5.4.2.1 Germany
- 5.4.2.2 United Kingdom
- 5.4.2.3 France
- 5.4.2.4 Italy
- 5.4.2.5 NORDIC Countries
- 5.4.2.6 Russia
- 5.4.2.7 Rest of Europe
- 5.4.3 Asia-Pacific
- 5.4.3.1 China
- 5.4.3.2 India
- 5.4.3.3 Japan
- 5.4.3.4 South Korea
- 5.4.3.5 ASEAN Countries
- 5.4.3.6 Rest of Asia-Pacific
- 5.4.4 South America
- 5.4.4.1 Brazil
- 5.4.4.2 Argentina
- 5.4.4.3 Rest of South America
- 5.4.5 Middle East and Africa
- 5.4.5.1 Saudi Arabia
- 5.4.5.2 United Arab Emirates
- 5.4.5.3 South Africa
- 5.4.5.4 Egypt
- 5.4.5.5 Rest of Middle East and Africa
- 5.4.1 North America
6 Competitive Landscape
- 6.1 Market Concentration
- 6.2 Strategic Moves (M&A, Partnerships, PPAs)
- 6.3 Market Share Analysis (Market Rank/Share for key companies)
- 6.4 Company Profiles (includes Global level Overview, Market level overview, Core Segments, Financials as available, Strategic Information, Products & Services, and Recent Developments)
- 6.4.1 Xpansiv
- 6.4.2 AirCarbon Exchange (ACX)
- 6.4.3 Climate Impact X
- 6.4.4 CME Group Inc.
- 6.4.5 Intercontinental Exchange (ICE)
- 6.4.6 European Energy Exchange (EEX)
- 6.4.7 Carbon Trade Exchange (CTX)
- 6.4.8 Nasdaq
- 6.4.9 Toucan
- 6.4.10 Verra Registry
- 6.4.11 Gold Standard
- 6.4.12 ClearBlue Markets
- 6.4.13 South Pole
- 6.4.14 Flowcarbon
- 6.4.15 Patch
- 6.4.16 Regreener
- 6.4.17 Carbonplace
- 6.4.18 Thallo
- 6.4.19 Cloverly
- 6.4.20 IncubEx
7 Market Opportunities & Future Outlook
- 7.1 White-space & Unmet-Need Assessment
