
|
시장보고서
상품코드
2063241
태양광발전(PV) 시험 장비 : 시장 점유율 분석, 업계 동향 및 통계, 성장 예측(2026-2031년)Solar PV Testing Equipment - Market Share Analysis, Industry Trends & Statistics, Growth Forecasts (2026 - 2031) |
||||||
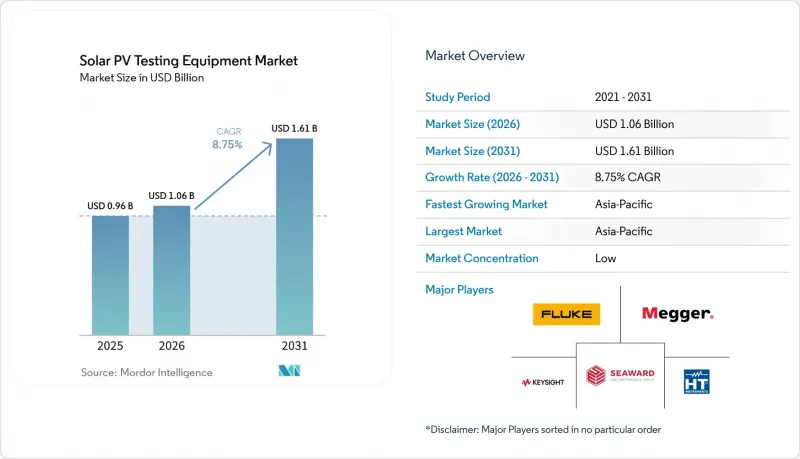
Mordor Intelligence에 의하면, 태양광발전(PV) 시험 장비 시장 규모는 2025년 9억 6,000만 달러로 평가되었습니다. 2026년 10억 6,000만 달러로 확대되고 2026년부터 2031년에 걸쳐 CAGR은 8.75%를 나타내, 2031년에는 16억 1,000만 달러에 이를 것으로 예측됩니다.
본 보고서는 장비 유형(전력 분석기, IV 곡선 트레이서 등), 기술(자동화 등), 시험 단계(설치 전, 현장, 유지보수), 용도(제조업체 등), 최종 사용자(에너지, 제조 등), 지역(북미, 유럽, 아시아·태평양, 남미, 중동 및 아프리카)별로 분류되어 있습니다. 시장 전망은 금액(달러) 단위로 제시되어 있습니다.
세계의 태양광발전(PV) 시험 장비 시장 동향 및 인사이트
전 세계 태양광 발전 설비 설치량의 확대
2024년 전 세계 태양광 발전 신규 설치량은 601GW에 달했으며, 누적 설치량은 2.26TW를 넘어섰고, 계통 연계 시험을 기다리는 대규모 태양광 발전 단지의 대기 물량이 발생했습니다. 아시아태평양은 이러한 발전 용량의 약 71%를 차지하고 있으며, 중국에서만 357GW가 가동을 시작함에 따라 공장 및 현장에서 시험을 기다리는 대기 줄이 더욱 길어지고 있습니다. 가동 개시는 기계적 준공 후에 이루어지기 때문에 태양광발전(PV) 시험 장비 시장의 수익은 일반적으로 설비 용량 증가보다 6-12개월 늦게 발생하여 매출 변동을 완화합니다. 출하량의 4분의 3 이상을 차지하게 된 양면 모듈의 급증으로 인해, 단면용 테스터로는 대응할 수 없는 후면 일사량 센서가 필요해지면서, 각 EPC 업체들은 설비 업그레이드를 서둘러야 하는 상황에 처해 있습니다. 그 결과, 유통업체에 따르면 1,500V IV 커브 트레이서의 미처리 주문이 현재 8주까지 밀려 있으며, 이는 2023년 리드 타임의 2배에 달하는 것으로, 수요가 얼마나 타이트한지 여실히 드러나고 있습니다.
태양광 발전 하드웨어 및 O&M 비용의 급격한 하락; 디지털화
2024년 4분기 유럽의 모듈 가격은 평균 1와트당 0.20유로로, 이로 인해 하드웨어 설비 투자가 축소되고 시운전 비용이 총 설치 비용의 3-5%까지 상승했습니다. 따라서 개발업체들은 시험을 수율 확보를 위한 안전장치로 간주하고 있습니다. 핫스팟을 놓치면 연간 발전 효율이 200-300 베이시스 포인트 하락하여, IRR이 부채 계약 조건을 밑돌 우려가 있기 때문입니다. 자산 관리 포털에 데이터를 자동으로 입력하는 클라우드 지원 분석기는 20-30%의 가격 프리미엄이 붙는 경우나, 수동 데이터 입력이 비용 면에서 현실적이지 않은 500MW 이상의 포트폴리오 규모에서는 여전히 매력적입니다. 따라서 하드웨어 비용의 감소는 역설적으로 고정밀 테스터에 대한 와트당 지출을 증가시켜, 프리미엄 공급업체에게는 호재가 됩니다. 이러한 디지털 전환은 동시에 구독 기반 수익 모델을 개척함으로써, 하드웨어 수요의 주기적인 변동으로부터 공급업체를 보호합니다.
첨단 시험 장비에 대한 고액의 설비 투자
1,500V 스트링 전체에 대해 IEC 62446-1의 모든 검사를 수행할 수 있는 완전 자동화 장비의 가격은 5만-8만 달러에 달하며, 이 금액은 이집트, 인도네시아, 아르헨티나의 소규모 설치 업체들의 연간 매출액을 상회합니다. 서유럽의 EPC 기업들은 200MW가 넘는 포트폴리오를 통해 이러한 장비 비용을 상각하고 있지만, 개발도상 지역의 시공업체들은 보험사가 인정하지 않을 가능성이 있는 휴대용 계측기나 열화상 카메라에 의존할 수밖에 없습니다. 은행이 장비의 잔존 가치에 대해 잘 알지 못하는 지역에서는 리스 솔루션이 여전히 부족하여, 비용 대비 효과의 격차를 더욱 벌리고 있습니다. 이에 서비스 기업들이 임대 장비 제공에 나서, 주문형 시운전에 대해 1MW당 500-1,500달러를 청구함으로써, 최종 사용자의 설비 투자 없이도 시장 점유율을 확대되고 있습니다.
부문별 분석
2025년, 파워 애널라이저는 태양광발전(PV) 시험 장비 시장의 매출의 35.3%를 차지했습니다. 이는 인버터 효율, 고조파 왜곡 및 계통 적합성 검증에서 다목적적인 역할을 반영한 것입니다. 한편, IV 커브 트레이서는 개발업체들이 스트링 수준의 진단을 강화하고, 보험사의 성능 비율 80%라는 기준치를 밑돌 가능성이 있는 오염으로 인한 핫스팟을 미연에 방지하기 위해 2031년까지 연평균 성장률(CAGR) 9.4%로 가장 높은 성장률을 나타낼 것으로 전망됩니다. 드론 탑재형 열화상 카메라는 하루에 최대 100MW를 스캔할 수 있어 지상 작업자에 비해 10배의 효율을 발휘하지만, 공항 주변의 항공 규제로 인해 휴대용 카메라의 틈새 시장은 여전히 유지되고 있습니다. IV 트레이스, 절연 저항 측정, 적외선 이미징 기능을 하나의 본체에 통합한 통합 테스터는 시운전 작업량을 30% 줄여주어, 이 제품군을 매력적인 업그레이드 옵션으로 자리매김하고 있습니다.
1,500V 정격의 2세대 트레이서는 현재 인도와 중동 전역의 입찰 서류에서 주류를 이루고 있는 반면, 2,000V를 지원하는 프로토타입은 2025년에 실증 시험에 들어갔습니다. 그 결과, 태양광발전(PV) 시험 장비 시장에서는 초기 1,500V 대응 장비의 재교정이 필요해지는 2028년에 중기적인 교체 수요가 급증할 것으로 예측됩니다. 2015년 이전에 가동된 프로젝트의 유지보수 프로그램에서는 여전히 열화상 카메라가 핵심 역할을 담당하고 있습니다. 이러한 프로젝트에서는 전기적 시험으로는 감지할 수 없는 밀봉재 층의 열화가 가속화되고 있기 때문입니다. 한편, 태양광 시뮬레이터는 여전히 공장의 품질 관리나 연구실에서의 사용으로 그 범위가 제한되어 있습니다.
2025년, 태양광발전(PV) 시험 장비 시장에서 수동식 장치의 점유율은 46.1%를 유지했으며, 이는 엄격한 현대 기준이 도입되기 전에 구입된 멀티미터의 잔재입니다. 그러나 노동력 부족으로 인해 도급업체들이 자본 설비에 대한 투자를 강요받는 가운데, 자동화 플랫폼 시장은 연평균 성장률(CAGR) 10.2%를 나타낼 전망입니다. 클라우드 기반 분석 장치는 500MW를 초과하는 포트폴리오를 관리하는 자산 운용사의 보고서 작성 효율을 높여줍니다. 이 정도 규모에서는 데이터 입력 감소로 인한 효과가 하드웨어의 높은 가격을 상쇄합니다. 리튬 이온 배터리 팩을 탑재한 휴대용 설계의 장치는 8시간 연속 가동을 실현하여, 외딴 사막 현장에 발전기 사용을 불필요하게 하고 물류 비용을 절감합니다.
그러나 완전한 자동화에는 규제상의 장벽이 있습니다. 보험 인수사는 여전히 원시 IV 곡선에 대한 전문가의 검토를 의무화하고 있으며, 이로 인해 인력 대체가 제한되고 있습니다. 그리드 장애 테스트를 자동으로 실행하는 프로그래밍 가능한 DC 전원 공급 장치 등, 기술자의 승인 서명이 필요한 하이브리드 시스템이 당분간 도입되는 전형적인 패턴이 되고 있습니다. 기존 테스터에 자동 로깅 기능을 추가하는 블루투스 모듈의 사후 장착 비용은 1,200달러 미만으로, 소규모 설치 업체에게 매력적일 뿐만 아니라 제품의 수명 주기도 연장해 줍니다. 그 결과, 태양광발전(PV) 시험 장비 업계는 이미 도입된 설비에 대한 지원을 유지하기 위해 혁신과 하위 호환성 사이의 균형을 맞추고 있습니다.
지역별 분석
2025년, 유럽은 태양광발전(PV) 시험 장비 시장 매출의 32.5%를 차지했습니다. 이는 엄격한 규정 준수 체제 외에도, 2024년 독일의 설치 건수 중 양면 모듈의 보급률이 17%에서 74%로 급증한 데 기인합니다. CINEA가 지원하는 ECODESIGN PV TESTING 프로젝트를 통한 유럽연합(EU)의 새로운 자금 지원은 이면 일사량 검증에 관한 기준 강화가 임박했음을 시사하며, 2020년대 중반에 다시 한번 구매 수요의 급증으로 이어질 가능성이 있습니다. 그러나 일부 회원국에서는 허가를 받기까지 4년 이상 걸리기 때문에 계통 연계 증명서가 확정될 때까지 시험 장비 조달이 지연되어 수요가 간헐적으로 집중되는 상황이 발생하고 있습니다.
아시아태평양은 가장 빠르게 성장하는 지역으로, 2031년까지 연평균 성장률(CAGR) 10.4%를 나타낼 전망입니다. 중국의 분산형 태양광 발전 설비 용량은 2025년 9월 기준 508GW를 넘어섰으며, ‘4가지 능력’ 규정이 적용되어 분석기를 통한 자가 복구 기능 및 상호작용 기능의 검증이 의무화되어 있습니다. 인도에서는 2024년에 31.9GW가 신규로 도입된 데 더해, 모듈 제조에 대한 생산 연계형 인센티브가 도입됨에 따라 공장 내용 테스터에 대한 수요도 함께 증가하고 있습니다. 동남아시아 전역의 기술자 부족으로 인해 완전 자동화 시스템의 도입이 주춤하고 있으며, 도급업체들은 지역 교정 실험실의 지원을 받는 견고한 수동식 도구를 선호하는 경향이 있습니다.
북미에서는 2024년에 47GW가 도입되었으나, 2TW를 초과하는 계통 연계 대기 목록으로 인해 공사 착수 통지라는 마일스톤이 연기되었고, 테스터 구매도 미뤄지고 있습니다. 그렇긴 하지만, ‘인플레이션 억제법’에 따른 장기적인 세액 공제가 견실한 파이프라인을 뒷받침하고 있으며, 송전망 업그레이드를 통해 용량이 확보되면 이는 장비 발주로 이어질 것입니다. 중동에서는 사우디아라비아와 UAE에서 기가와트 규모의 입찰이 가속화되고 있으며, 1,500V 스트링이 채택됨에 따라 고전압 인증 대응 장비에 대한 수요가 증가하고 있습니다. 아프리카와 남미에서는 자금 조달에 어려움을 겪고 있지만, 휴대용 테스터의 렌탈 모델을 통해 소규모 설치 업체의 도입 장벽이 낮아지고 있습니다.
기타 혜택 :
- 엑셀 형식 시장 예측(ME) 시트
- 3개월간의 애널리스트 지원
자주 묻는 질문
목차
제1장 서론
제2장 조사 방법
제3장 주요 요약
제4장 시장 구도
제5장 시장 규모 및 성장 예측
제6장 경쟁 구도
제7장 시장 기회 및 향후 전망
KTHAccording to Mordor Intelligence, the solar pV testing equipment market size is expected to grow from USD 0.96 billion in 2025 to USD 1.06 billion in 2026 and is forecast to reach USD 1.61 billion by 2031 at 8.75% CAGR over 2026-2031.

This report is Segmented by Equipment Type (Power Analyzers, IV Curve Tracers, and More), Technology (Automated, and More), Testing Phase (Pre-Installation, On-Site, Maintenance), Application (Manufacturers, and More), End-User (Energy, Manufacturing, and More), and Geography (North America, Europe, Asia-Pacific, South America, Middle East and Africa). Market Forecasts are Provided in Value (USD).
Global Solar PV Testing Equipment Market Trends and Insights
Escalating Global PV Installation Volumes
World solar additions hit 601 GW in 2024, lifting cumulative installations above 2.26 TW and generating a sizable backlog of arrays awaiting grid-connection testing. Asia-Pacific contributed roughly 71% of those megawatts, with China alone commissioning 357 GW, which in turn elongates factory and field-testing queues. Because commissioning happens after mechanical completion, Solar PV Testing Equipment Market revenues typically trail capacity additions by six to twelve months, smoothing topline volatility. The steep rise of bifacial modules, now more than three-quarters of shipments, necessitates rear-irradiance sensors unavailable in single-plane testers, pushing EPCs toward fleet upgrades. As a result, distributors report that back-orders for 1,500 V IV curve tracers now stretch eight weeks, double the 2023 lead time, underscoring demand tightness.
Rapid Cost Decline of PV Hardware & O&M Digitalization
Module prices across Europe averaged EUR 0.20 per watt in Q4 2024, compressing hardware capex and elevating commissioning to 3-5% of total installed cost. Developers, therefore, treat testing as yield insurance: missed hotspots can lower annual performance ratios by 200-300 basis points, pushing IRRs below debt covenants. Cloud-ready analyzers that autopopulate asset-management portals attract 20-30% price premiums yet remain attractive above 500 MW portfolio scale, where manual data entry becomes cost-prohibitive. Lower hardware costs thus paradoxically raise per-watt spending on high-precision testers, a tailwind for premium suppliers. This digital shift simultaneously unlocks subscription revenue models, cushioning vendors against cyclical hardware demand.
High CAPEX for Advanced Testing Equipment
Fully automated rigs able to execute all IEC 62446-1 checks across 1,500 V strings cost USD 50,000-80,000, a figure that eclipses the annual revenue of small installers in Egypt, Indonesia, and Argentina. European and U.S. EPCs amortize such gear over portfolios surpassing 200 MW, but contractors in developing regions rely on handheld meters and thermal cameras that insurers may reject. Leasing solutions remain scarce where banks lack familiarity with residual equipment values, deepening the affordability gap. Service companies are stepping in with rental fleets, charging USD 500-1,500 per MW for on-demand commissioning, thus broadening market reach without requiring end-user capex.
Other drivers and restraints analyzed in the detailed report include:
- Evolving Safety-Compliance Standards
- Shift to 1,500 V String Architectures
- Shortage of Certified PV Test Technicians in Emerging Markets
For complete list of drivers and restraints, kindly check the Table Of Contents.
Segment Analysis
Power analyzers contributed 35.3% of the Solar PV Testing Equipment market revenue in 2025, reflecting their multipurpose roles in inverter efficiency, harmonic distortion, and grid-compliance verification. IV curve tracers, however, are forecast to post the fastest 9.4% CAGR through 2031 as developers elevate string-level diagnostics to preempt soiling-induced hotspots that can breach insurers' 80% performance-ratio thresholds. Drone-borne thermal imagers scan up to 100 MW per day, outperforming ground crews by a factor of ten, yet aviation restrictions near airports preserve a niche for handheld cameras. Integrated testers that merge IV tracing, insulation resistance, and infrared imaging in one chassis reduce commissioning labor by 30%, positioning that category as an attractive upgrade pathway.
Second-generation tracers rated for 1,500 V now dominate bid documents across India and the Middle East, while 2,000 V-capable prototypes entered field trials in 2025. As a result, the Solar PV Testing Equipment Market expects a mid-cycle replacement bump in 2028 when early 1,500 V fleets require recalibration. Thermal imagers still underpin maintenance programs for projects commissioned before 2015, whose encapsulant layers are entering accelerated degradation phases invisible to electrical tests. Meanwhile, solar simulators remain confined to factory quality-control and research labs.
Manual devices retained 46.1% share of the Solar PV Testing Equipment Market in 2025, a legacy of multimeters purchased before stringent modern standards. Automated platforms, though, will expand at 10.2% CAGR as labor scarcities push contractors toward capital solutions. Cloud-enabled analyzers streamline report generation for asset managers overseeing portfolios beyond 500 MW, where data-entry savings outweigh hardware premiums. Portable designs powered by lithium-ion packs achieve eight-hour runtimes, eliminating generator needs at remote desert sites and cutting logistics costs.
Yet full autonomy faces regulatory friction: underwriters still mandate expert review of raw IV curves, capping labor displacement. Hybrid systems, such as programmable DC supplies that auto-sequence grid-fault tests but require technician countersignature, typify interim adoption patterns. Retrofit Bluetooth modules that add automated logging to legacy testers cost under USD 1,200, appealing to small-scale installers and extending product life cycles. Consequently, the Solar PV Testing Equipment industry balances innovation with backward compatibility to sustain installed-base relevance.
Geography Analysis
Europe captured 32.5% of the Solar PV Testing Equipment market revenue in 2025, underpinned by rigid compliance frameworks and a leap in bifacial-module penetration from 17% to 74% of German installs during 2024. New European Union funding, via the CINEA-backed ECODESIGN PV TESTING project, signals imminent tightening of standards for rear-side irradiance verification, likely triggering another mid-decade purchasing surge. However, permitting timelines stretching beyond four years in some member states delays tester procurements until grid-connection certificates are certain, injecting episodic demand lumps.
Asia-Pacific is the fastest-growing region, set to rise at 10.4% CAGR through 2031. China's distributed PV stock exceeded 508 GW by September 2025 and is governed by the "four-abilities" rule requiring analyzers to validate self-healing and interaction functions. India's 31.9 GW of 2024 additions, alongside its production-linked incentive for module manufacturing, feed parallel demand for factory-floor testers. Technician shortages across Southeast Asia temper uptake of fully automated systems, leading contractors to favor rugged manual tools backed by regional calibration labs.
North America installed 47 GW in 2024, yet interconnection queues surpassing 2 TW postpone notice-to-proceed milestones, deferring tester purchases. Nevertheless, the Inflation Reduction Act's long-dated tax credits underpin a robust pipeline that will convert to equipment orders as grid upgrades unlock capacity. The Middle East accelerates with gigawatt-scale tenders in Saudi Arabia and the UAE, adopting 1,500-V strings, demanding high-voltage certification equipment. Africa and South America grapple with financing headwinds, but rental models for portable testers lower adoption barriers for small-scale installers.
- Fluke Corporation (incl. Solmetric)
- Seaward Electronic Ltd.
- HT Instruments (HT-Italia)
- Chauvin Arnoux Group
- Megger Group
- Kyoritsu Electrical Instruments Works Ltd.
- Gossen Metrawatt GmbH
- MECO Instruments
- Metrel d.d.
- Keysight Technologies
- Yokogawa Electric Corporation
- Chroma ATE Inc.
- Newport Corporation (MKS Instruments)
- PV Measurements Inc.
- EKO Instruments
- OTT HydroMet(Kipp & Zonen)
- Sevensense
- Apogee Instruments
- Delta OHM
- AMETEK / Abet Technologies
- AEMC Instruments
- PV-One (IVy)
- CMW Solar
- Eltest Engineering
Additional Benefits:
- The market estimate (ME) sheet in Excel format
- 3 months of analyst support
TABLE OF CONTENTS
1 Introduction
- 1.1 Study Assumptions & Market Definition
- 1.2 Scope of the Study
2 Research Methodology
3 Executive Summary
4 Market Landscape
- 4.1 Market Overview
- 4.2 Market Drivers
- 4.2.1 Escalating global PV installation volumes
- 4.2.2 Rapid cost decline of PV hardware & O&M digitalization
- 4.2.3 Evolving safety-compliance standards (IEC 62446-1, NEC 2023)
- 4.2.4 Shift to 1,500 V string architectures needing high-voltage testers
- 4.2.5 ESG-driven zero-defect procurement policies by asset owners
- 4.2.6 Insurance underwriters mandating baseline performance data
- 4.3 Market Restraints
- 4.3.1 High CAPEX for advanced testing equipment
- 4.3.2 Shortage of certified PV test technicians in emerging markets
- 4.3.3 Smart inverters' built-in self-diagnostics curbing external tester demand
- 4.3.4 Cyber-security concerns over cloud-connected test gear
- 4.4 Supply-Chain Analysis
- 4.5 Regulatory Landscape
- 4.6 Technological Outlook
- 4.7 Porter's Five Forces Analysis
- 4.7.1 Threat of New Entrants
- 4.7.2 Bargaining Power of Buyers
- 4.7.3 Bargaining Power of Suppliers
- 4.7.4 Threat of Substitutes
- 4.7.5 Competitive Rivalry
5 Market Size & Growth Forecasts
- 5.1 By Equipment Type
- 5.1.1 Power Analyzers
- 5.1.2 IV Curve Tracers
- 5.1.3 Thermal Imagers
- 5.1.4 Solar Simulators
- 5.1.5 Multimeters
- 5.1.6 Shunt Resistors
- 5.2 By Technology
- 5.2.1 Automated Testing Equipment
- 5.2.2 Manual Testing Equipment
- 5.2.3 Portable Testing Equipment
- 5.2.4 Integrated Testing Systems
- 5.3 By Testing Phase
- 5.3.1 Pre-Installation Testing
- 5.3.2 On-Site Testing
- 5.3.3 Maintenance Testing
- 5.4 By Application
- 5.4.1 Solar Panel Manufacturers
- 5.4.2 Solar System Installers
- 5.4.3 Solar Farms and Utility-Scale Installations
- 5.4.4 Research and Development
- 5.4.5 Maintenance and Repair Services
- 5.5 By End-User Industry
- 5.5.1 Energy and Power
- 5.5.2 Manufacturing
- 5.5.3 Construction and Infrastructure
- 5.5.4 Government and Public Sector
- 5.5.5 Research Institutions
- 5.6 By Geography
- 5.6.1 North America
- 5.6.1.1 United States
- 5.6.1.2 Canada
- 5.6.1.3 Mexico
- 5.6.2 Europe
- 5.6.2.1 Germany
- 5.6.2.2 United Kingdom
- 5.6.2.3 France
- 5.6.2.4 Italy
- 5.6.2.5 NORDIC Countries
- 5.6.2.6 Russia
- 5.6.2.7 Rest of Europe
- 5.6.3 Asia-Pacific
- 5.6.3.1 China
- 5.6.3.2 India
- 5.6.3.3 Japan
- 5.6.3.4 South Korea
- 5.6.3.5 ASEAN Countries
- 5.6.3.6 Rest of Asia-Pacific
- 5.6.4 South America
- 5.6.4.1 Brazil
- 5.6.4.2 Argentina
- 5.6.4.3 Rest of South America
- 5.6.5 Middle East and Africa
- 5.6.5.1 Saudi Arabia
- 5.6.5.2 United Arab Emirates
- 5.6.5.3 South Africa
- 5.6.5.4 Egypt
- 5.6.5.5 Rest of Middle East and Africa
- 5.6.1 North America
6 Competitive Landscape
- 6.1 Market Concentration
- 6.2 Strategic Moves (M&A, Partnerships, PPAs)
- 6.3 Market Share Analysis (Market Rank/Share for key companies)
- 6.4 Company Profiles (includes Global level Overview, Market level overview, Core Segments, Financials as available, Strategic Information, Products & Services, and Recent Developments)
- 6.4.1 Fluke Corporation (incl. Solmetric)
- 6.4.2 Seaward Electronic Ltd.
- 6.4.3 HT Instruments (HT-Italia)
- 6.4.4 Chauvin Arnoux Group
- 6.4.5 Megger Group
- 6.4.6 Kyoritsu Electrical Instruments Works Ltd.
- 6.4.7 Gossen Metrawatt GmbH
- 6.4.8 MECO Instruments
- 6.4.9 Metrel d.d.
- 6.4.10 Keysight Technologies
- 6.4.11 Yokogawa Electric Corporation
- 6.4.12 Chroma ATE Inc.
- 6.4.13 Newport Corporation (MKS Instruments)
- 6.4.14 PV Measurements Inc.
- 6.4.15 EKO Instruments
- 6.4.16 OTT HydroMet(Kipp & Zonen)
- 6.4.17 Sevensense
- 6.4.18 Apogee Instruments
- 6.4.19 Delta OHM
- 6.4.20 AMETEK / Abet Technologies
- 6.4.21 AEMC Instruments
- 6.4.22 PV-One (IVy)
- 6.4.23 CMW Solar
- 6.4.24 Eltest Engineering
7 Market Opportunities & Future Outlook
- 7.1 White-space & Unmet-need Assessment
