
|
시장보고서
상품코드
2063247
태양전지 : 시장 점유율 분석, 업계 동향 및 통계, 성장 예측(2026-2031년)Solar Cell - Market Share Analysis, Industry Trends & Statistics, Growth Forecasts (2026 - 2031) |
||||||
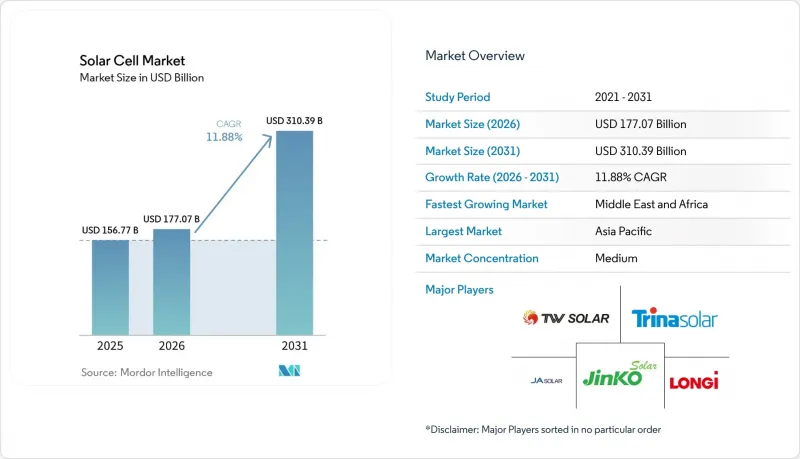
Mordor Intelligence에 의하면, 태양전지 시장 규모는 2025년에 1,567억 7,000만 달러로 평가되었습니다. 2026년에 1,770억 7,000만 달러에 달하고, 2031년까지 3,103억 9,000만 달러에 이를 것으로 예측되며, 2026년부터 2031년에 걸쳐 CAGR은 11.88%를 나타낼 전망입니다.
본 보고서는 유형별(결정질 실리콘, 기타), 셀 기술별(P형 PERC, N형 TOPCon, HJT, IBC, BC, 탠덤), 용도별(주거용, 상업용, 산업용, 전력회사용, 부유식 태양광 발전, 소비자용 전자기기, 자동차, 항공우주, 기타), 지역별(북미, 유럽, 아시아태평양, 남미, 중동 및 아프리카)로 분류되어 있습니다. 시장 전망은 금액(달러) 기준으로 제시되어 있습니다.
세계의 태양전지 시장 동향과 인사이트
평균 발전 비용(LCOE)의 하락
2024년, 유틸리티급 태양광 발전의 세계 평균 LCOE는 kWh당 0.043달러에 달했으며, 중국에서는 0.033달러/kWh를 기록하여 조사 대상 시장의 90%에서 신규 석탄 화력 및 가스 화력 발전 비용을 밑돌았습니다. 2024년 인도 입찰에서는 3.9GW 규모에 대해 kWh당 0.026달러라는 사상 최저 가격을 기록했으며, 이는 화력 피크 발전소에 있어 구조적인 전환점을 시사하고 있습니다. 브라질에서는 2024년 조달 가격이 1MWh당 24달러로 결정되었으며, 이는 라틴아메리카 전력 시스템에서도 태양광 발전이 최저 비용의 전력원으로 간주되고 있음을 입증했습니다. 미국 프로젝트의 평균 비용은 여전히 1kWh당 0.070달러이지만, 모듈 가격 하락과 추적 알고리즘을 통한 발전량 증가로 인해 그 격차는 점차 좁혀지고 있습니다. 태양광 발전과 에너지 저장을 결합한 하이브리드 시스템은 과거에는 연소 터빈이 독점하던 보조 서비스 수익을 확보하게 되면서, ERCOT 및 CAISO의 용량 시장 경제성을 재정의하고 있습니다.
세계의 탈탄소화 목표와 인센티브
미국의 ‘인플레이션 감축법’ 제45X조의 세액 공제 혜택에 힘입어, 국내에서 15GW 규모의 신규 발전 용량 발표가 잇따르면서 퍼스트 솔라의 로드맵은 2026년까지 25GW로 상향 조정되었습니다. 유럽의 ‘탄소 국경 조정 메커니즘’은 탄소 배출량이 높은 수입품의 입고 비용을 1W당 0.02-0.04달러 인상함으로써, 조달처를 지역 내 공급원으로 전환시키고 있습니다. 중국의 제14차 5개년 계획에서는 2030년까지 풍력·태양광 발전 용량을 1,200GW로 늘리겠다는 목표가 확정된 반면, 인도의 24억 달러 규모의 PLI(생산 연계형 인센티브) 제도는 셀 제조업체들이 정부의 ‘승인 모델 제조업체 목록’에 등록되도록 장려하고 있습니다. 만안 국가들에서 국가 주도로 AI 데이터센터 도입을 의무화함에 따라, 양면 수광형 및 저열화 모듈에 대한 프리미엄 수요가 창출되고 있으며, 이는 전력 시장을 넘어 정책 적용 범위가 확대되고 있음을 보여줍니다.
공급 과잉으로 인한 모듈 가격 폭락
2025년, 중국의 폴리실리콘 생산량은 277만 톤에 달했으나, 세계 수요는 180만 톤에 그쳤고, 현물 실리콘 가격은 60% 하락하여 1kg당 12달러에 달했습니다. 이에 이어 모듈 가격도 하락하여 1W당 0.10-0.12달러까지 떨어졌고, 8기가와트 규모의 Tier 2 생산 능력이 가동을 중단하게 되었습니다. 수직 통합형 대기업은 가치 창출을 내부화함으로써 EBITDA의 8-10%를 유지하고 있는 반면, 순수한 조립 제조업체는 현금 흐름의 악화나 강제적인 통합의 가능성에 직면해 있습니다. 이 경기 침체는 역설적으로 기술 혁신을 가속화하고 있으며, 기업들은 이익률이 낮은 상황에서도 상품화를 피하기 위해 TOPCon 및 HJT에 대한 투자를 추진하고 있습니다.
부문별 분석
2025년, 결정질 실리콘 설계가 태양전지 시장의 84.6%를 차지했으며, 단결정 유형은 24-25%의 효율을 달성했고, 웨이퍼 비용은 하락했습니다. CIGS나 비정질 실리콘과 같은 틈새 분야는 현재, 효율 저하보다는 유연성이 중시되는 BIPV(건축 통합형 태양광 발전) 및 경량 전자 기기를 주요 대상으로 삼고 있습니다.
신흥 태양전지 기술로는 페로브스카이트, 유기 태양전지(OPV), 양자점, 그리고 염료감응형 태양전지(DSSC)가 있습니다. 2031년까지는 결정질 실리콘이 대규모 발전소 및 지붕 설치형 설비에서 주류를 이루는 반면, 페로브스카이트 탠덤은 공간이 제한된 상업시설이나 BIPV 용도와 같은 프리미엄 부문을 목표로 하고 있습니다. 페로브스카이트 모듈의 IEC 61215 인증은 2027년까지 취득될 전망이며, 이를 통해 프로젝트 파이낸싱이 가능해집니다. OPV는 여전히 초저전력 용도로만 제한되어 있으며, 양자점 셀은 개발 단계에 있고, DSSC는 고성능 페로브스카이트와의 경쟁에 직면해 있습니다. 페로브스카이트 모듈에 대한 IEC 61215 인증 초안이 현재 작성 중이며, 승인될 경우 2027년 이후부터 더 대규모의 프로젝트 파이낸싱 자금 조달이 가능해질 것입니다. 한편, 옥상이나 건축용 유리에 적용함에 따라 현장에서의 신뢰성에 대해서는 불확실한 점이 있기는 하지만, 선점한 기업들은 고가 시장에서 투자 회수가 가능해집니다.
지역별 분석
2025년, 중국이 폴리실리콘 및 모듈 생산 라인을 확대하여 총 생산 능력이 400GW를 넘어섬에 따라, 아시아태평양은 매출 점유율 64.3%를 유지했습니다. 인도의 24억 달러 규모의 PLI 보조금과 ALMM 규정에 따라 연간 12GW 규모의 수주가 국내 공급업체로 유입된 반면, 일본과 한국은 기술적 리더십을 바탕으로 아세안(ASEAN) 국가들에 대한 수출에 주력했습니다. 베트남과 말레이시아는 무역 중립적인 입지를 활용해 미국 및 EU의 바이어들에게 접근함으로써 생산 능력을 각각 5GW로 확대했습니다. 아시아·태평양 지역의 태양전지 시장 규모는 2031년까지 2,100억 달러에 달할 것으로 전망됩니다.
중동 및 아프리카는 사우디아라비아의 NEOM 프로젝트에서 2.6GW가 배정된 것과 UAE가 2030년까지 모하메드 빈 라시드 파크에서 5GW를 달성할 계획에 힘입어 연평균 성장률(CAGR) 23.2%라는 가장 빠른 성장세를 기록하고 있습니다. 이집트의 벤반 콤플렉스나 남아프리카공화국의 REIPPPP는 다자간 금융이 국가 신용 리스크를 완화하고, 지역의 부하 곡선을 재구성하는 대규모 프로젝트를 실현한 대표적인 사례입니다. 송전망과 연계된 해수 담수화 및 그린 수소는 추가적인 전력 수요를 이끌어내며, 물 부족으로 어려움을 겪는 국가들의 태양전지 시장 확대를 뒷받침하고 있습니다.
미국의 IRA(인플레이션 억제법)에 따른 45배의 세액 공제는 11GW를 초과하는 국내 CdTe 클러스터를 뒷받침하고 있는 반면, EU의 넷제로 산업법은 국내로 회귀한 30GW의 생산 능력에 자금을 지원하고 있습니다. 캐나다의 각 주는 석탄을 단계적으로 폐지하기 위해 연방 정부의 세액 공제 제도와 연계하고 있으며, 브라질의 입찰에서는 세계 최고 수준의 저가로 낙찰을 성사시켜, 유틸리티 규모의 건설 분야에서 새로운 거점이 될 조짐을 보이고 있습니다. 미국 인플레이션 억제법(IRA)에 따른 45배의 세액 공제는 퍼스트 솔라의 2026년까지 25GW 생산 능력 목표를 뒷받침하고 있으며, 이 중 6GW는 오하이오주와 앨라배마주에 추가될 예정입니다. EU의 2024년 ‘넷 제로 산업법’은 2030년까지 30GW를 국내로 되돌리기 위해 30억 유로를 배정하여 마이어-버거와 에넬을 지원하고 있습니다. 캐나다의 5GW 규모 태양광 발전 계획은 석탄 발전을 대체하고 있으며, 브라질과 아르헨티나는 태양광 발전 용량을 확대하고, 국경을 넘는 송전선을 통해 칠레로 전력을 수출하고 있습니다.
기타 혜택 :
- 엑셀 형식 시장 예측(ME) 시트
- 3개월간의 애널리스트 지원
자주 묻는 질문
목차
제1장 서론
제2장 조사 방법
제3장 주요 요약
제4장 시장 구도
제5장 시장 규모 및 성장 예측
제6장 경쟁 구도
제7장 시장 기회 및 향후 전망
KTH 26.06.22According to Mordor Intelligence, the solar cell market size is projected to be USD 156.77 billion in 2025, USD 177.07 billion in 2026, and reach USD 310.39 billion by 2031, growing at a CAGR of 11.88% from 2026 to 2031.

This report is Segmented by Type (Crystalline-Silicon, Others), Cell Technology (P-Type PERC, N-Type TOPCon, HJT, IBC, BC, Tandem), Application (Residential, Commercial, Industrial, Utility, Floating PV, Consumer Electronics, Automotive, Aerospace, Others), and Geography (North America, Europe, Asia-Pacific, South America, Middle East and Africa). The Market Forecasts are Provided in Terms of Value (USD).
Global Solar Cell Market Trends and Insights
Declining Levelized Cost of Electricity (LCOE)
Utility solar reached a global average LCOE of USD 0.043 kWh in 2024, with China at USD 0.033 kWh, undercutting new coal and gas in 90% of tracked markets. Record-low tariffs of USD 0.026 kWh were achieved for 3.9 GW of Indian capacity in 2024 auctions, signaling a structural reset for thermal peaker plants. In Brazil, 2024 procurements cleared at USD 24 MWh, proving Latin American grids also view solar as the least-cost supply. U.S. projects still average USD 0.070 kWh, yet the gap is narrowing as module prices fall and tracker algorithms boost specific yield. Solar-plus-storage hybrids now capture ancillary-service income once reserved for combustion turbines, redefining capacity-market economics in ERCOT and CAISO.
Global Decarbonization Targets and Incentives
The U.S. Inflation Reduction Act's Section 45X credits triggered 15 GW of new domestic capacity announcements, lifting First Solar's roadmap to 25 GW by 2026. Europe's Carbon Border Adjustment Mechanism raises the landed cost of high-carbon imports by USD 0.02-0.04 W, redirecting procurement toward regional lines. China's 14th Five-Year Plan locks in 1,200 GW of wind and solar by 2030, while India's USD 2.4 billion PLI incentives push cell makers onto the government's Approved List of Models and Manufacturers. Sovereign AI-datacenter mandates in the Gulf add premium demand for bifacial and low-degradation modules, illustrating the policy's widening scope beyond power markets.
Oversupply-Driven Module Price Crash
China's polysilicon output rose to 2.77 million tonnes in 2025, versus global demand of 1.8 million tonnes, causing spot silicon prices 60% to USD 12 kg. Module prices followed, touching USD 0.10-0.12 W and pushing eight gigawatts of tier-2 capacity offline. Vertically integrated giants preserve 8-10% EBITDA by internalizing value capture, whereas pure-play assemblers see cash-flow stress and potential forced consolidation. The downturn is paradoxically accelerating technology upgrades, as firms invest in TOPCon and HJT to escape commoditization even while margins remain thin.
Other drivers and restraints analyzed in the detailed report include:
- Corporate Clean-Energy PPAs Boom
- Commercialization of N-Type TOPCon & HJT Cells
- Grid-Connection Bottlenecks
For complete list of drivers and restraints, kindly check the Table Of Contents.
Segment Analysis
Crystalline-silicon designs controlled 84.6% of the solar cell market in 2025, with monocrystalline variants delivering 24-25% efficiencies and falling wafer costs. Niche avenues such as CIGS and amorphous silicon now target BIPV or lightweight electronics where flexibility overshadows efficiency sacrifice.
Emerging solar technologies include perovskite, organic photovoltaic (OPV), quantum-dot, and dye-sensitized solar cells (DSSC). Crystalline silicon will dominate utility-scale and rooftop installations through 2031, while perovskite tandems target premium segments like space-constrained commercial and BIPV applications. IEC 61215 certification for perovskite modules is expected by 2027, enabling project financing. OPVs remain limited to ultra-low-power uses, quantum-dot cells are in development, and DSSCs face competition from higher-performing perovskites. IEC 61215 certification drafts for perovskite modules are in process, and approval could unlock larger project-finance pools post-2027. In the interim, rooftop and architectural-glass applications allow early movers to recoup higher price points despite field-reliability unknowns.
Geography Analysis
Asia-Pacific retained 64.3% revenue share in 2025 as China ramped polysilicon and module lines exceeding 400 GW of combined capacity. India's USD 2.4 billion PLI subsidies and ALMM rules rerouted 12 GW of annual orders to domestic suppliers, while Japan and South Korea leveraged technology leadership to serve ASEAN imports. Vietnam and Malaysia expanded output to 5 GW each, using trade-neutral positioning to reach U.S. and EU buyers. The solar cell market size across Asia-Pacific is projected to reach USD 210 billion by 2031.
The Middle East and Africa post the fastest growth at 23.2% CAGR, anchored by Saudi Arabia's 2.6 GW NEOM allocation and the UAE's march to 5 GW at its Mohammed bin Rashid park by 2030. Egypt's Benban complex and South Africa's REIPPPP illustrate how multilateral finance de-risks sovereign credit, unlocking scale projects that reshape regional load curves. Grid-integrated desalination and green hydrogen drive additional off-take, supporting a widening solar cell market in water-stressed states.
The U.S. IRA's 45X credit supports a domestic CdTe cluster exceeding 11 GW, while the EU's Net-Zero Industry Act funds 30 GW of reshored capacity. Canadian provinces align with federal tax credits to phase out coal, and Brazil's auctions clear at world-class low tariffs, signaling new poles of utility-scale buildout. The U.S. Inflation Reduction Act's 45X credit drives First Solar's 25 GW capacity target by 2026, with 6 GW added in Ohio and Alabama. The EU's 2024 Net-Zero Industry Act allocates EUR 3 billion to reshore 30 GW by 2030, aiding Meyer Burger and Enel. Canada's 5 GW solar pipeline replaces coal, while Brazil and Argentina expand solar capacity, exporting electricity to Chile via cross-border interconnections.
- LONGi Green Energy Technology Co., Ltd.
- Tongwei Solar Co., Ltd.
- JA Solar Technology Co., Ltd.
- Trina Solar Co., Ltd.
- JinkoSolar Holding Co., Ltd.
- First Solar, Inc.
- Canadian Solar Inc.
- Hanwha Q CELLS Co., Ltd.
- Risen Energy Co., Ltd.
- SunPower Corporation
- Maxeon Solar Technologies
- REC Group
- Yingli Green Energy Holding Co. Ltd.
- Panasonic Holdings Corporation
- Sharp Corporation
- Aiko Solar (Jiangxi) Co., Ltd.
- Runergy (Jiangsu) Co., Ltd.
- Astronergy (Chint)
- Huasun Energy Co., Ltd.
- Meyer Burger Technology AG
- Oxford PV Ltd.
- Heliatek GmbH
- Solaria Corporation
- Suntech Power Co., Ltd.
- Emeren Group Ltd.
Additional Benefits:
- The market estimate (ME) sheet in Excel format
- 3 months of analyst support
TABLE OF CONTENTS
1 Introduction
- 1.1 Study Assumptions & Market Definition
- 1.2 Scope of the Study
2 Research Methodology
3 Executive Summary
4 Market Landscape
- 4.1 Market Overview
- 4.2 Market Drivers
- 4.2.1 Declining levelised cost of electricity (LCOE)
- 4.2.2 Global decarbonisation targets & incentives
- 4.2.3 Corporate clean-energy PPAs boom
- 4.2.4 Commercialisation of n-type TOPCon & HJT cells
- 4.2.5 Perovskite-silicon tandem pilot lines (2026+)
- 4.2.6 Grid-forming-inverter mandates favouring high-efficiency cells
- 4.3 Market Restraints
- 4.3.1 Oversupply-driven module price crash
- 4.3.2 Grid-connection bottlenecks
- 4.3.3 Looming silver & indium supply constraints
- 4.3.4 Trade-barrier uncertainty (AD/CVD, CBAM)
- 4.4 Supply-Chain Analysis
- 4.5 Raw-Material (Polysilicon, Silver, Glass) Analysis
- 4.6 Regulatory Landscape
- 4.7 Technological Outlook
- 4.8 Porter's Five Forces Analysis
- 4.8.1 Threat of New Entrants
- 4.8.2 Bargaining Power of Buyers
- 4.8.3 Bargaining Power of Suppliers
- 4.8.4 Threat of Substitutes
- 4.8.5 Competitive Rivalry
5 Market Size & Growth Forecasts
- 5.1 By Type
- 5.1.1 Crystalline-Silicon Solar Cells
- 5.1.1.1 Monocrystalline Silicon
- 5.1.1.2 Polycrystalline Silicon
- 5.1.2 Thin-Film Solar Cells
- 5.1.2.1 Cadmium Telluride (CdTe)
- 5.1.2.2 Amorphous Silicon (a-Si)
- 5.1.2.3 Copper Indium Gallium Selenide (CIGS)
- 5.1.3 Emerging Technologies
- 5.1.3.1 Perovskite Solar Cells
- 5.1.3.2 Organic Photovoltaic (OPV) Cells
- 5.1.3.3 Quantum-Dot Solar Cells
- 5.1.3.4 Dye-Sensitised Solar Cells (DSSC)
- 5.1.1 Crystalline-Silicon Solar Cells
- 5.2 By Cell Technology
- 5.2.1 P-type PERC
- 5.2.2 n-type TOPCon
- 5.2.3 Heterojunction (HJT)
- 5.2.4 Interdigitated Back-Contact (IBC)
- 5.2.5 Back-Contact (BC)
- 5.2.6 Tandem (Perovskite-Si, III-V)
- 5.3 By Application
- 5.3.1 Residential - Rooftop
- 5.3.2 Commercial
- 5.3.3 Industrial
- 5.3.4 Ground-Mounted Utility
- 5.3.5 Floating PV
- 5.3.6 Consumer Electronics
- 5.3.7 Automotive and Transportation
- 5.3.8 Aerospace and Defense
- 5.3.9 Others (Agrivoltaic, Wearables, Off-grid, etc.)
- 5.4 By Geography
- 5.4.1 North America
- 5.4.1.1 United States
- 5.4.1.2 Canada
- 5.4.1.3 Mexico
- 5.4.2 Europe
- 5.4.2.1 Germany
- 5.4.2.2 United Kingdom
- 5.4.2.3 France
- 5.4.2.4 Italy
- 5.4.2.5 NORDIC Countries
- 5.4.2.6 Russia
- 5.4.2.7 Rest of Europe
- 5.4.3 Asia-Pacific
- 5.4.3.1 China
- 5.4.3.2 India
- 5.4.3.3 Japan
- 5.4.3.4 South Korea
- 5.4.3.5 ASEAN Countries
- 5.4.3.6 Rest of Asia-Pacific
- 5.4.4 South America
- 5.4.4.1 Brazil
- 5.4.4.2 Argentina
- 5.4.4.3 Rest of South America
- 5.4.5 Middle East and Africa
- 5.4.5.1 Saudi Arabia
- 5.4.5.2 United Arab Emirates
- 5.4.5.3 South Africa
- 5.4.5.4 Egypt
- 5.4.5.5 Rest of Middle East and Africa
- 5.4.1 North America
6 Competitive Landscape
- 6.1 Market Concentration
- 6.2 Strategic Moves (M&A, Partnerships, PPAs)
- 6.3 Market Share Analysis (Market Rank/Share for key companies)
- 6.4 Company Profiles (includes Global level Overview, Market level overview, Core Segments, Financials as available, Strategic Information, Products & Services, and Recent Developments)
- 6.4.1 LONGi Green Energy Technology Co., Ltd.
- 6.4.2 Tongwei Solar Co., Ltd.
- 6.4.3 JA Solar Technology Co., Ltd.
- 6.4.4 Trina Solar Co., Ltd.
- 6.4.5 JinkoSolar Holding Co., Ltd.
- 6.4.6 First Solar, Inc.
- 6.4.7 Canadian Solar Inc.
- 6.4.8 Hanwha Q CELLS Co., Ltd.
- 6.4.9 Risen Energy Co., Ltd.
- 6.4.10 SunPower Corporation
- 6.4.11 Maxeon Solar Technologies
- 6.4.12 REC Group
- 6.4.13 Yingli Green Energy Holding Co. Ltd.
- 6.4.14 Panasonic Holdings Corporation
- 6.4.15 Sharp Corporation
- 6.4.16 Aiko Solar (Jiangxi) Co., Ltd.
- 6.4.17 Runergy (Jiangsu) Co., Ltd.
- 6.4.18 Astronergy (Chint)
- 6.4.19 Huasun Energy Co., Ltd.
- 6.4.20 Meyer Burger Technology AG
- 6.4.21 Oxford PV Ltd.
- 6.4.22 Heliatek GmbH
- 6.4.23 Solaria Corporation
- 6.4.24 Suntech Power Co., Ltd.
- 6.4.25 Emeren Group Ltd.
7 Market Opportunities & Future Outlook
- 7.1 White-space & Unmet-Need Assessment
