
|
시장보고서
상품코드
2063261
청정 수소 : 시장 점유율 분석, 업계 동향 및 통계, 성장 예측(2026-2031년)Clean Hydrogen - Market Share Analysis, Industry Trends & Statistics, Growth Forecasts (2026 - 2031) |
||||||
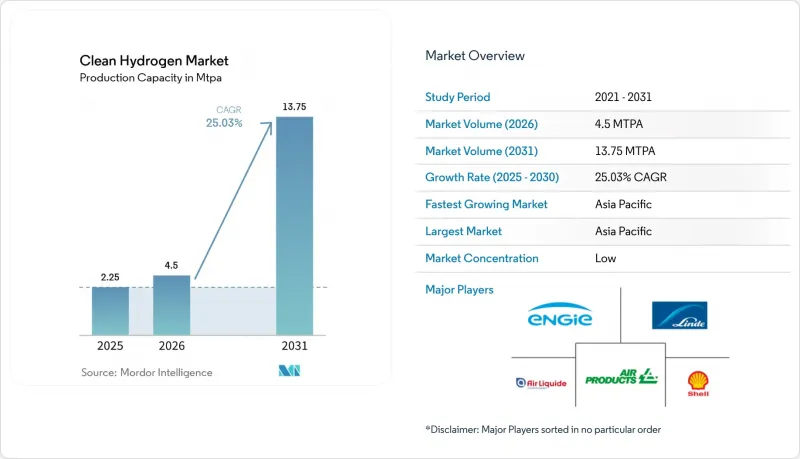
Mordor Intelligence에 의하면, 생산능력 기반 청정 수소 시장 규모는 2025년 225만 톤/년으로 평가되었습니다. 2026년에는 450만 톤/년으로 확대되어 2026년부터 2031년에 걸쳐 CAGR은 25.03%를 나타내, 2031년에는 1,375만 톤/년에 이를 것으로 예측됩니다.

본 보고서는 생산 방식(그린 수소, 블루 수소, 터콰이즈 수소, 기타), 전해조 기술(알칼리, PEM, 기타), 공급 형태(압축 가스, 액체 수소, 기타), 용도(운송, 산업, 기타) 및 지역(북미, 유럽, 아시아태평양, 기타)별로 분류되어 있습니다. 시장 전망은 수량(톤) 기준으로 제시되어 있습니다.
세계의 청정 수소 시장 동향과 인사이트
2026년 이후, 급증하는 전해조의 생산 과잉이 가격 폭락을 초래할 것
2025년, 전 세계 전해조의 정격 용량은 연간 61-63GW에 달했으나, 가동 중인 용량은 고작 2.15GW에 그쳐 공급 과잉이 발생했습니다. 이에 따라 유럽의 알칼리형 전해조의 가격은 kW당 2,407달러, PEM형은 2,547달러까지 하락했습니다. 중국 공급업체들은 가동 중인 공장의 생산 능력 절반 이상을 장악하고 있으며, 시장 점유율을 유지하기 위해 원가 이하로 모듈을 수출하고 있어 유럽 및 미국 제조업체들의 이익률을 압박하고 있습니다. 하드웨어 가격 하락에 따라, 2030년까지 태양광 자원이 풍부한 지역에서는 보조금 없이 생산된 그린 수소의 균등화 비용이 1kg당 1.50-2.50달러까지 하락하여, 탄소 포집 비용의 급등으로 어려움을 겪고 있는 블루 수소의 가격대를 상회할 것으로 예측됩니다. 이러한 가격 경쟁으로 인해, 저렴한 재생 가능 전력이 풍부한 중동과 인도 두 지역에서 최종 투자 결정이 가속화되고 있습니다. 그러나 모듈 가격의 급락으로 중소 OEM 업체들의 운전자금이 압박을 받고 있어, 향후 2년 동안 업계 재편이 진행될 가능성이 높아지고 있습니다.
EU, 인도, 브라질에서 도입된 IRA형 생산세액공제
미국 인플레이션 억제법(IRA)이 규정하고 있는 저탄소 수소에 대한 1kg당 최대 3달러의 45V 세액 공제는 유럽의 ‘수소 은행’, 인도의 SIGHT 제도, 그리고 브라질에서 검토 중인 인센티브 체계가 현재 본받고 있는 세계적인 기준이 되고 있습니다. 이러한 보조금은 예측 가능한 수익의 하한선을 설정함으로써, 개발자가 더 낮은 스프레드로 비회수성 부채를 확보할 수 있도록 해줍니다. 인도에서만 해도 전해 제조 및 생산에 대한 인센티브로 24억 달러를 배정했으며, 이를 통해 AM Green의 연간 100만 톤 규모 그린 암모니아 프로젝트에 대한 최종 투자 결정(FID)이 이끌어졌습니다. 그러나 ‘One Big, Beautiful Bill Act’에 포함된 조기 만료 조항(미국 내 프로젝트에 2028년 1월 1일까지 건설을 시작하도록 의무화하는 조항)으로 인해, 2025년에는 연간 490만 톤을 초과하는 프로젝트가 중단되면서 정책 리스크가 여전히 존재한다는 사실이 부각되었습니다.
2030년 이후 재생에너지 출력 억제 페널티(계통 연계료)
독일은 2024년에 8.2 TWh의 친환경 전력을 감축했으며, 현재 잉여 전력 발생 시간대에 전해 장치에 대해 5.8-17.4 달러/MWh를 부과하는 시간대별 요금제를 도입함으로써, 에너지 비용이 제로라는 가정을 뒤집고 있습니다. 스페인과 덴마크에서도 이와 유사한 변동 요금제의 시범 운영이 진행되고 있습니다. 알칼리 전해조는 출력 조절에 5-15분이 소요되기 때문에 리튬이온 축전지만큼 신속하게 가격 변동을 흡수할 수 없어, 규제 당국은 계통 안정화를 위해 축전지를 우선적으로 활용하고 있습니다. 또한, EU 규정에서는 재생에너지 발전량과 수소 생산량을 1시간 단위로 일치시킬 것을 의무화하고 있어, 입찰 구역을 넘나들며 저렴한 수입품을 조달하는 개발업자의 차익 거래 여지를 제한하고 있습니다. 2030년 이후, 송전망에 부과되는 추가 비용으로 인해 수소 비용이 1kg당 0.20-0.50달러 증가할 가능성이 있으며, 이로 인해 가스 자원이 풍부한 지역에서 블루 수소와의 경쟁력이 약화될 우려가 있습니다.
부문별 분석
2025년 시점에서 청정 수소 시장 점유율의 68.5%를 블루 수소가 차지했으며, 천연가스 개질과 탄소 포집을 결합한 방식의 선점 우위가 뚜렷이 드러났습니다. 그러나 그린 수소로의 전환 속도는 더 빨라, 2031년까지 연평균 성장률(CAGR) 34.6%로 확대될 것으로 전망됩니다. 이는 전해조 비용의 감소로 인해 태양광 발전이 풍부한 지역에서는 공급 가격 차이가 1Kg당 0.20달러 미만으로 좁혀졌기 때문입니다. 이러한 변화로 인해, 과거 프로젝트 파이낸싱 모델에서 수증기 개질 프로젝트를 유리한 위치에 놓이게 했던 ‘블루 수소 프리미엄’이 축소되고 있습니다. 특히, 탄소 포집에 대한 정부의 인센티브가 줄어들기 시작한 지역에서는 그 현상이 두드러집니다. 이에 따라 개발사는 아시아로의 대규모 수출을 견인할 연간 21만 9,000톤 규모의 NEOM 복합 시설 등 기가와트급 전해 클러스터 건설에 계속해서 착수하고 있습니다.
2026년 이후, 그린 프로젝트와 연계된 청정 수소 시장 규모는 발표된 설비 용량 기준으로는 블루 수소를 앞지르겠지만, 가동 중인 생산량 기준으로는 여전히 블루 수소가 주류를 이루고 있습니다. CCS(이산화탄소 포집·저장) 비용의 상승(2025년 톤당 50-100달러에서 2030년까지 80-150달러로)은 블루 수소의 가격 경쟁력을 약화시키는 한편, 재생에너지 확충, 토지 임대차 제도 개혁, 그리고 세액 공제를 통해 전해 프로젝트의 추진이 가속화되고 있습니다. 터콰이즈 수소와 바이오매스 가스화는 탄소 수익화 실증 사례가 부족하고 물류상의 장벽이 존재하기 때문에 청정 수소 시장 규모에서 차지하는 비중이 낮습니다. CCS의 비용 곡선이 평탄해지지 않는 한, 정책 리스크로 인해 블루 수소 프로젝트의 파이프라인이 더욱 축소될 것으로 예상되며, 이로 인해 조달 입찰에서 그린 수소가 기준이 되는 흐름이 형성될 여지가 생깁니다.
알칼리계 시스템은 자본 집약도가 낮고, 염소-알칼리 산업에서 수십 년에 걸친 도입 실적이 있는 만큼, 2025년에는 청정 수소 시장 규모의 58.9%를 차지했습니다. 중국 공급업체들이 가격 경쟁을 촉발하고 수출 입찰에서 점유율을 확대함에 따라, 2025년 중 유럽의 모듈 가격은 kW당 2,436달러 아래로 떨어졌습니다. 그러나 PEM 부문은 이리듐 적재량이 2020년 kW당 2-3그램에서 2025년에는 0.3-0.5그램으로 감소하고, 촉매 비용이 70% 이상 절감됨에 따라 그 격차를 좁혀가고 있습니다. 급격한 출력 상승률과 부분 부하 시의 유연성(정격 용량의 10%까지 1초 미만으로 응답 가능) 덕분에, PEM은 풍력·태양광 발전 하이브리드 시스템에서 최적의 선택지가 되고 있습니다.
고체 산화물 전해(SOEC) 시장 점유율은 작지만, 시범 운영에서 72%의 전기 효율을 기록했으며, 산업 폐열 회수를 통해 스택 수준에서 85% 이상의 효율을 목표로 하고 있습니다. 이는 전력 비용이 1메가와트시당 40달러를 초과하는 시장에서 1Kg당 0.30-0.80달러의 비용 절감으로 이어질 가능성이 있어, SOEC를 철강 및 암모니아 복합 시설을 위한 대안으로 자리매김하고 있습니다. 한편, 음이온 교환막(AEM)의 시제품은 귀금속을 사용하지 않고도 PEM과 유사한 성능을 발휘할 가능성을 지니고 있지만, 4만 시간을 넘는 내구성에 대한 검증은 아직 미흡합니다. 전반적으로 기술 구성은 비용 중심의 알칼리형 우위에서 PEM을 거쳐, 장래에는 SOEC가 유연한 재생에너지 및 고품질 열의 통합과 관련된 용도를 개척해 나가는 보다 균형 잡힌 구성으로 전환되고 있습니다.
지역별 분석
아시아태평양은 2025년 생산량의 43.7%를 차지하며 1위를 기록했으며, 2031년까지의 지역별 연평균 성장률(CAGR)은 27.4%로 가장 높을 것으로 예측됩니다. 2025년에 가동을 시작한 전 세계 59개 프로젝트 중 중국에서만 25개가 가동을 시작했으며, 여기에는 중국석유화학(Sinopec)의 연간 2만 톤 규모 쿠차 전해조 복합 시설도 포함되어 있습니다. 20억 5,000만 달러 규모의 인센티브로 뒷받침된 인도의 ‘국가 그린 수소 미션’은 암모니아 및 모빌리티 분야의 시범 프로젝트를 통해 연간 100만 톤 이상의 확정 생산 능력을 창출했습니다. 일본은 2030년까지 연간 300만 톤, 2050년까지 연간 2,000만 톤을 목표로 하는 수입 인프라를 구축하고 있으며, 이는 해당 지역의 수출에 대한 구조적인 수요를 보여주는 것입니다. 아세안 전역에서는 인도네시아와 베트남이 저비용 수력 발전 부지를 검토하고 있으나, 그 실행 여부는 항만 허가 및 자금 조달이 가능한 판매 계약의 유무에 달려 있습니다.
유럽은 2025년 생산량에서 큰 비중을 차지했으나, 재생에너지 출력 억제에 따른 벌금 증가와 엄격한 시간적 일관성 규제로 인해 과제에 직면해 있습니다. 독일은 2024년에 8.2TWh의 친환경 전력을 제한하고, 수소 비용에 1kg당 0.20-0.50달러를 추가하는 동적 송전망 요금을 도입하고 있습니다. 그럼에도 불구하고, 유럽 대륙에서는 파이프라인의 간선망이 점차 정비되고 있습니다. 구체적으로는 총 길이 3,300km의 ‘SoutH2 회랑’과 2030년까지 완공될 예정인 총 길이 1만 1,600km의 ‘수소 백본(1단계)’입니다. 네덜란드와 스페인의 주요 클러스터에서는 해상 풍력 발전의 전력 구매 계약(PPA)과 200-250MW 규모의 전해 설비를 결합하여, 정유시설로공급 및 수출이라는 야심찬 목표를 뒷받침하고 있습니다.
북미에서는 미국 멕시코만 연안 지역이 기존 1,000마일에 달하는 수소 파이프라인과 12억 달러 규모의 허브 보조금의 혜택을 받고 있지만, 45V 세제 혜택의 조기 종료로 인해, 이 프로젝트는 2028년까지 최종 투자 결정(FID)을 내려야 하는 상황에 직면해 있으며, 2025년에는 연간 490만 톤 이상의 프로젝트가 중단되었습니다. 사우디아라비아의 NEOM 복합 단지는 태양광 자원을 활용해 1kg당 1.50-2.50달러의 친환경 암모니아를 공급하며, 이 지역을 수출 강국으로 도약시키고 있습니다. 브라질은 2026년에 인센티브를 확정하고, 암모니아 수출 회랑에 주력할 전망입니다. 한편, 남아프리카의 백금 및 이리듐 광산은 중요한 PEM 촉매를 공급하고 있어, 소재 안보 측면에서 지정학적 중요성을 높이고 있습니다.
기타 혜택 :
- 엑셀 형식 시장 예측(ME) 시트
- 3개월간의 애널리스트 지원
자주 묻는 질문
목차
제1장 서론
제2장 조사 방법
제3장 주요 요약
제4장 시장 구도
제5장 시장 규모 및 성장 예측
제6장 경쟁 구도
제7장 시장 기회 및 향후 전망
KTHAccording to Mordor Intelligence, the clean hydrogen market size in terms of production capacity is expected to grow from 2.25 MTPA in 2025 to 4.5 MTPA in 2026 and is forecast to reach 13.75 MTPA by 2031 at 25.03% CAGR over 2026-2031.
This report is Segmented by Production Method (Green Hydrogen, Blue Hydrogen, Turquoise Hydrogen, Others), Electrolyzer Technology (Alkaline, PEM, and More), Delivery Form (Compressed Gas, Liquid Hydrogen, and More), Application (Transportation, Industrial, and More), and Geography (North America, Europe, Asia-Pacific, and More). The Market Forecasts are Provided in Terms of Volume (Tons).
Global Clean Hydrogen Market Trends and Insights
Soaring electrolyzer manufacturing over-capacity drives price collapse post-2026
Global nameplate electrolyzer capacity hit 61-63 GW per year in 2025, but only 2.15 GW was operating, creating an oversupply that forced European alkaline prices down to USD 2,407 per kilowatt and PEM to USD 2,547per kilowatt. Chinese vendors control more than half of the installed factory capacity and are exporting modules below cost to maintain their share, impairing Western manufacturers' margins. As hardware deflates, the unsubsidized levelized cost of green hydrogen is projected to fall toward USD 1.50-2.50 per kilogram in high-solar regions by 2030, overtaking blue hydrogen ranges burdened by escalating carbon-capture charges. The price war is accelerating final-investment decisions across the Middle East and India, two locations with abundant low-priced renewable electricity. However, plummeting module prices are squeezing working-capital lines for smaller OEMs, raising the prospect of sector consolidation over the next two years.
IRA-style production tax credits replicated in EU, India, Brazil
The U.S. Inflation Reduction Act's 45V credit of up to USD 3 per kilogram for low-carbon hydrogen has become a global benchmark that Europe's Hydrogen Bank, India's SIGHT scheme, and Brazil's pending incentive framework now mirror. These subsidies establish predictable revenue floors, permitting developers to secure non-recourse debt at lower spreads. India alone earmarked USD 2.4 billion for electrolysis manufacturing and production incentives, triggering a 1 MTPA green-ammonia FID by AM Green. Yet an accelerated sunset clause in the One Big, Beautiful Bill Act, which requires U.S. projects to start construction before January 1, 2028, prompted cancellations exceeding 4.9 MTPA in 2025, underscoring persistent policy risk.
2030-onwards renewable-power curtailment penalties (grid fees)
Germany curtailed 8.2 TWh of green power in 2024 and is introducing time-of-use tariffs that charge electrolyzers USD 5.8-17.4/MWh during surplus periods, undercutting assumptions of zero-cost energy. Similar dynamic-fee pilots are underway in Spain and Denmark. Because alkaline electrolyzers need 5-15 minutes to ramp, they cannot absorb volatility as quickly as lithium-ion storage, prompting regulators to favor batteries for grid balancing. EU rules also force hourly matching between renewable output and hydrogen production, limiting developers' ability to arbitrage cheap imports across bidding zones. From 2030, grid penalties could add USD 0.20-0.50/kg to hydrogen costs, eroding competitiveness versus blue hydrogen in gas-rich regions.
Other drivers and restraints analyzed in the detailed report include:
- Rise of green-premium procurement mandates by steel and ammonia buyers
- Development of H2 pipeline corridors in EU, U.S. Gulf and Middle East
- CCS cost inflation undermines blue-H2 competitiveness
For complete list of drivers and restraints, kindly check the Table Of Contents.
Segment Analysis
Blue hydrogen retained 68.5% of the clean hydrogen market share in 2025, underscoring the early-mover advantage of reforming natural gas paired with carbon capture. Yet the green pathway is on a faster cadence, expanding at 34.6% CAGR through 2031 as falling electrolyzer costs compress the delivered price gap to less than USD 0.20 per kilogram in high-solar regions. That swing reduces the blue premium that once placed steam-reforming projects ahead on project finance models, especially where government incentives for captured carbon have begun to taper. Developers, therefore, continue to break ground on gigawatt-scale electrolysis clusters, such as the 219,000-tonne-per-year NEOM complex, which will anchor large export volumes into Asia.
From 2026 onward, the clean hydrogen market size attached to green projects eclipses blue in announced capacity, even though blue still dominates volumes in operation. CCS cost escalation, running from USD 50-100 per tonne in 2025 toward USD 80-150 per tonne by 2030, erodes blue's price edge, while renewable energy additions, land-leasing reforms, and tax credits speed up electrolysis pipelines. Turquoise hydrogen and biomass gasification has low share of the clean hydrogen market size because of unproven carbon monetization and logistics barriers. Unless CCS price curves flatten, policy risk is expected to dilute further blue project pipelines, opening room for green to become the reference pathway in procurement tenders.
Alkaline systems captured 58.9% of the clean hydrogen market size in 2025, benefiting from lower capital intensity and decades of deployment in the chlor-alkali industry. European module quotations slipped below USD 2,436 per kilowatt during 2025 as Chinese suppliers triggered a price war, widening their reach in export tenders. The PEM segment, however, is closing the gap, helped by iridium-loading reductions from 2-3 grams per kilowatt in 2020 to as low as 0.3-0.5 grams per kilowatt in 2025, cutting catalyst bills by more than 70%. Faster ramp rates and partial-load flexibility, reaching 10% of nameplate capacity in sub-second response, make PEM the preferred option for co-located wind-solar hybrids.
Solid-oxide electrolysis commands a smaller market share, yet pilot runs have logged 72% electrical efficiency and aim for stack-level efficiencies above 85% once industrial waste heat is harvested. That translates into a potential USD 0.30-0.80 per kilogram saving in markets where power costs exceed USD 40 per megawatt-hour, positioning SOEC for steel and ammonia complexes. Meanwhile, anion-exchange membrane prototypes promise PEM-like dynamics without noble metals, but lifetime validation past 40,000 hours is still lacking. Overall, the technology mix is tilting from cost-driven alkaline dominance toward a more balanced profile in which PEM and, later, SOEC carve out applications tied to flexible renewables and high-grade heat integration.
Geography Analysis
Asia-Pacific led with 43.7% of 2025 volumes and should post the highest regional CAGR at 27.4% through 2031. China alone commissioned 25 of the 59 global projects that came online in 2025, including Sinopec's 20,000-tonne-per-year Kuqa electrolyzer complex. India's National Green Hydrogen Mission, backed by USD 2.05 billion in incentives, has seeded more than 1 MTPA of committed capacity across ammonia and mobility pilots. Japan is building import infrastructure that targets 3 MTPA by 2030 and 20 MTPA by 2050, signalling a structural pull on regional exports. Across ASEAN, Indonesia and Vietnam eye low-cost hydropower sites, though execution hinges on port permitting and bankable offtake deals.
Europe accounted for a significant share of the 2025 output but faces challenges due to increasing renewable curtailment penalties and strict temporal matching regulations. Germany curtailed 8.2 TWh of green power in 2024 and is rolling out dynamic grid fees that add USD 0.20-0.50 per kilogram to hydrogen costs. Still, the continent is knitting a pipeline backbone: the 3,300 km SoutH2 Corridor and an 11,600 km first-phase Hydrogen Backbone by 2030. Major clusters in the Netherlands and Spain pair offshore-wind PPAs with 200-250 MW electrolyzers, anchoring refinery supply and export ambitions.
In North America, the U.S. Gulf Coast benefits from 1,000 miles of existing hydrogen pipelines and USD 1.2 billion in hub grants, but the accelerated 45V sunset forces projects to reach FID before 2028, triggering more than 4.9 MTPA of cancellations in 2025. Saudi Arabia's NEOM complex leverages solar resources to deliver green ammonia at USD 1.50-2.50 per kilogram, advancing the region as an export powerhouse. Brazil expects to finalize incentives in 2026 and focus on ammonia export corridors, while South Africa's platinum and iridium mines supply critical PEM catalysts, raising geopolitical stakes for material security.
- Air Liquide
- Linde plc
- Air Products
- Shell
- BP
- Engie
- Orsted
- Plug Power
- Nel ASA
- ITM Power
- Siemens Energy
- Thyssenkrupp Nucera
- Cummins
- Topsoe
- Kawasaki Heavy
- Hyundai Motor Group
- Toyota
- Mitsubishi Power
- Posco Future M
- ADNOC
- ACWA Power
Additional Benefits:
- The market estimate (ME) sheet in Excel format
- 3 months of analyst support
TABLE OF CONTENTS
1 Introduction
- 1.1 Study Assumptions & Market Definition
- 1.2 Scope of the Study
2 Research Methodology
3 Executive Summary
4 Market Landscape
- 4.1 Market Overview
- 4.2 Market Drivers
- 4.2.1 Soaring electrolyser manufacturing over-capacity drives price collapse post-2026
- 4.2.2 IRA-style production tax credits replicated in EU, India, Brazil
- 4.2.3 Rise of "green-premium" procurement mandates by steel & ammonia buyers
- 4.2.4 Development of H2 pipeline corridors in EU, US Gulf & Middle East
- 4.2.5 Corporate PPAs bundling renewable power + H2 offtake
- 4.2.6 Break-through in solid-oxide electrolysis efficiency >85 % (lab-to-pilot)
- 4.3 Market Restraints
- 4.3.1 2030-onwards renewable power curtailment penalties (grid fees)
- 4.3.2 CCS cost inflation undermines blue-H2 competitiveness
- 4.3.3 Delay in global H2 certification interoperability
- 4.3.4 Geopolitical risk around critical minerals for PEM stacks
- 4.4 Supply-Chain Analysis
- 4.5 Regulatory & Policy Landscape
- 4.6 Technological Outlook
- 4.7 Porter's Five Forces
- 4.7.1 Threat of New Entrants
- 4.7.2 Bargaining Power of Buyers
- 4.7.3 Bargaining Power of Suppliers
- 4.7.4 Threat of Substitutes
- 4.7.5 Competitive Rivalry
5 Market Size & Growth Forecasts
- 5.1 By Production Method
- 5.1.1 Green Hydrogen
- 5.1.2 Blue Hydrogen
- 5.1.3 Turquoise (Pyrolysis) Hydrogen
- 5.1.4 Others
- 5.2 By Electrolyzer Technology
- 5.2.1 Alkaline
- 5.2.2 PEM
- 5.2.3 Solid-Oxide
- 5.2.4 Anion-Exchange
- 5.3 By Delivery Form
- 5.3.1 Compressed Gas
- 5.3.2 Liquid Hydrogen
- 5.3.3 Ammonia
- 5.3.4 LOHC
- 5.4 By Application
- 5.4.1 Transportation (FCEV, Rail, Marine, Aviation)
- 5.4.2 Industrial (Ammonia Production, Methanol Production, Steelmaking, etc)
- 5.4.3 Power Generation
- 5.4.4 Others
- 5.5 By Geography
- 5.5.1 North America
- 5.5.1.1 United States
- 5.5.1.2 Canada
- 5.5.1.3 Mexico
- 5.5.2 Europe
- 5.5.2.1 Germany
- 5.5.2.2 United Kingdom
- 5.5.2.3 France
- 5.5.2.4 Italy
- 5.5.2.5 NORDIC Countries
- 5.5.2.6 Russia
- 5.5.2.7 Rest of Europe
- 5.5.3 Asia-Pacific
- 5.5.3.1 China
- 5.5.3.2 India
- 5.5.3.3 Japan
- 5.5.3.4 South Korea
- 5.5.3.5 ASEAN Countries
- 5.5.3.6 Rest of Asia-Pacific
- 5.5.4 South America
- 5.5.4.1 Brazil
- 5.5.4.2 Argentina
- 5.5.4.3 Rest of South America
- 5.5.5 Middle East and Africa
- 5.5.5.1 Saudi Arabia
- 5.5.5.2 United Arab Emirates
- 5.5.5.3 South Africa
- 5.5.5.4 Egypt
- 5.5.5.5 Rest of Middle East and Africa
- 5.5.1 North America
6 Competitive Landscape
- 6.1 Market Concentration
- 6.2 Strategic Moves (M&A, Partnerships, PPAs)
- 6.3 Market Share Analysis (Market Rank/Share for key companies)
- 6.4 Company Profiles (includes Global level Overview, Market level overview, Core Segments, Financials as available, Strategic Information, Products & Services, and Recent Developments)
- 6.4.1 Air Liquide
- 6.4.2 Linde plc
- 6.4.3 Air Products
- 6.4.4 Shell
- 6.4.5 BP
- 6.4.6 Engie
- 6.4.7 Orsted
- 6.4.8 Plug Power
- 6.4.9 Nel ASA
- 6.4.10 ITM Power
- 6.4.11 Siemens Energy
- 6.4.12 Thyssenkrupp Nucera
- 6.4.13 Cummins
- 6.4.14 Topsoe
- 6.4.15 Kawasaki Heavy
- 6.4.16 Hyundai Motor Group
- 6.4.17 Toyota
- 6.4.18 Mitsubishi Power
- 6.4.19 Posco Future M
- 6.4.20 ADNOC
- 6.4.21 ACWA Power
7 Market Opportunities & Future Outlook
- 7.1 White-space & Unmet-need Assessment
