
|
시장보고서
상품코드
2063281
자동차 계기판 : 시장 점유율 분석, 업계 동향 및 통계, 성장 예측(2026-2031년)Automotive Instrument Cluster - Market Share Analysis, Industry Trends & Statistics, Growth Forecasts (2026 - 2031) |
||||||
 Mordor Intelligence
Mordor Intelligence에 의하면, 자동차 계기판 시장 규모는 2025년 102억 3,000만 달러로 평가되었습니다. 2026년 110억 4,000만 달러에서 2031년까지 161억 3,000만 달러로 확대되고 2026년부터 2031년에 걸쳐 CAGR은 7.89%를 나타낼 것으로 예측됩니다.
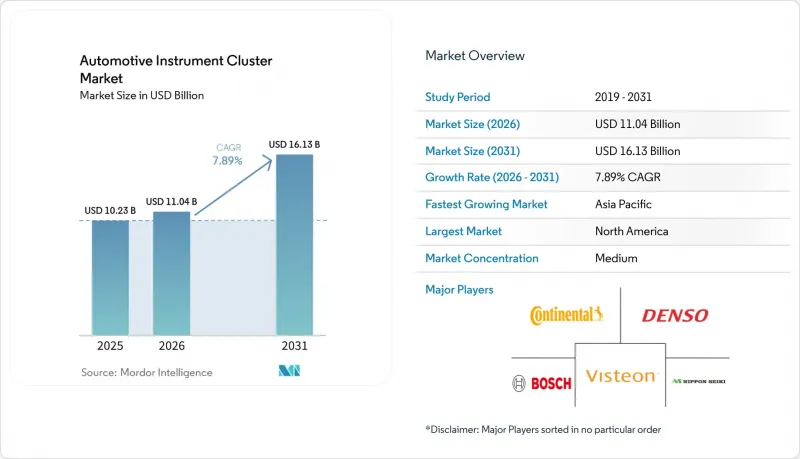
본 보고서는 클러스터 유형(아날로그 클러스터, 디지털 클러스터 등), 차종(이륜차, 삼륜차 등), 추진 방식(내연기관(ICE), 배터리 전기차(BEV) 등), 표시 기술(아날로그 게이지, LCD 등), 판매 채널(OEM, 애프터마켓), 지역별로 분류되어 있습니다. 시장 전망은 금액(달러) 기준으로 제시되어 있습니다.
세계의 자동차 계기판 시장 동향 및 인사이트
아날로그에서 풀 디지털 계기판으로의 전환
자동차 제조업체들은 소프트웨어 전용 레이아웃을 통해 공구 교체 비용을 절감하고, 무선 방식을 통한 현지화를 지원하며, 다양한 운전 보조 그래픽을 표시할 수 있게 됨에 따라 기계식 계기판을 점차 폐지하고 있습니다. 한때 옵티트론 다이얼을 선호했던 일본 브랜드들도 현재는 양산 모델 전반에 풀 LCD 계기판을 탑재하고 있어, 전 세계적으로 디지털 계기판으로의 전환점이 도래했음을 보여주고 있습니다. 특정 픽업트럭에서 발생한 화면이 검게 변하는 결함을 계기로 포드가 2025년에 실시한 리콜은 아날로그 방식의 이중화 기능이 상실될 때 철저한 검증이 얼마나 중요한지를 여실히 보여주었습니다. 물리적 조작 방식을 그리워하는 구매자들에게 안심을 주기 위해, 프리미엄 브랜드들은 촉각 피드백과 물리적 깊이감을 재현하는 고대비 OLED 패널을 채택하고 있습니다. 클러스터의 신뢰성이 안전성의 대체 지표로 작용하는 가운데, 글꼴의 가독성, 색채 과학, 즉각적인 기동 성능을 정교하게 다듬은 공급업체가 디자인 경쟁에서 우위를 점하고 있습니다.
전기차 생산 확대에 따라 배터리 상태 표시가 필요해졌습니다.
배터리식 파워트레인의 도입에 따라, 계기판에는 상세한 에너지 데이터, 충전 상태, 잔여 주행 거리, 회생 제동 강도, 그리고 온도에 따른 주행 가능 거리가 표시되어야 합니다. 쉐보레 ‘에퀴녹스 EV’의 계기판은 충전률, 에너지 사용 내역, 실시간 전력 흐름을 한눈에 확인할 수 있는 디스플레이를 구현하여 새로운 기준을 제시하고 있습니다. 잔여 주행 거리에 대한 운전자의 불안감은 지형이나 기상 상황에 적응할 수 있는 동적인 시각 정보에 대한 수요를 높이고 있습니다. 따라서 클러스터는 수동적인 계기판에서 능동적인 코칭 도구로 진화하여, 배터리 상태를 유지하는 운전 습관을 장려하고 있습니다. 내연기관의 단계적 폐지를 발표하는 지역이 늘어남에 따라, 계기판 공급업체들은 배터리 분석 기능을 전기차 전용의 부가 기능이 아닌 핵심 기능으로 탑재하고 있습니다.
대중 시장 부문의 높은 비용과 가격에 대한 민감성
디지털 계기판은 아날로그 계기판에 비해 여전히 재료비가 비싸기 때문에 구매자가 저렴한 가격을 중시하는 보급형 자동차나 오토바이의 경우 진입 장벽이 되고 있습니다. 애프터마켓 키트는 최신 디스플레이에 대한 소비자 수요를 보여주는 한편, 지불 의향의 한계도 드러내고 있습니다. 이 공급업체는 백라이트, 터치 센서, 기판 어셈블리를 자체적으로 보유하는 수직 통합을 추구하며, 비용을 1달러라도 절감하기 위해 노력하고 있습니다. 일부 OEM은 옵션을 계층화하여 풀 디지털 계기판을 프리미엄 등급으로만 제한하고 있지만, 이로 인해 규모의 경제가 단절되어 구매력에 미치는 영향력이 약화되고 있습니다.
부문별 분석
2025년, 아날로그식 계기판은 자동차용 계기판 시장 점유율의 49.14%를 차지했으며, 이는 비용을 중시하는 모델과 견고하고 단순한 사양을 중시하는 상용차 차량군이 뒷받침하고 있습니다. 그러나 연평균 성장률(CAGR) 8.34%를 기록하며 성장하고 있는 풀 디지털 클러스터는 내비게이션, ADAS 알림, 개인화 기능을 통합한 차세대 콕핏의 기반이 되고 있습니다. 이 공급업체는 발광 패널을 활용해 깊은 검은색과 낮은 지연 시간을 구현함으로써, 스포츠, 에코, 자율주행 모드를 전환할 때 상황에 맞는 테마를 적용할 수 있게 했습니다. 운전 지원 상태를 표시하도록 요구하는 규제로 인해, 물리적 지침만으로는 부족해지면서 이러한 전환이 가속화되고 있습니다. 애호가들 사이에서는 여전히 바늘의 촉각적인 움직임이 높이 평가되고 있으며, 유서 깊은 브랜드들은 향수를 불러일으키는 매개체로서 아날로그 다이얼과 중앙 디스플레이를 결합하기도 합니다.
자동차 계기판 시장은 디지털 수요에 맞추어 공급 체계를 정비함으로써 이에 대응하고 있습니다. 각 제조업체는 한 번만 컴파일하면 모든 화면 크기에 적용할 수 있는 그래픽 파이프라인에 투자하여 엔지니어링 부담을 줄이고 있습니다. 클러스터가 헤드업 디스플레이와 동기화됨에 따라 중복된 경고 표시가 줄어들고, 보다 상세한 지도를 표시할 수 있는 공간이 확보됩니다. 아날로그 계기는 눈부심이나 진동, 장갑을 낀 채로도 조작할 수 있는 편의성이 디자인보다 우선시되는 신흥 시장의 이륜차나 틈새 시장의 오프로드 기계에 점점 더 제한적으로 채택되고 있습니다. 그러나 이러한 분야에서도 하이브리드 솔루션이 서서히 확산되고 있어, 대시보드 전체를 재설계하지 않고도 최소한의 정보를 표시하기 위해 기계식 계기 사이에 소형 TFT 디스플레이가 탑재되는 사례가 나타나고 있습니다.
승용차는 2025년 자동차 계기판 시장 점유율의 56.21%를 차지했으며, 2031년까지 연평균 성장률(CAGR) 7.75%를 기록하며 가장 빠르게 성장하고 있는 부문이기도 합니다. 이는 생산 대수의 대부분을 차지한다는 점과, 커넥티드 인테리어에 대한 소비자 수요를 반영한 것입니다. 전기 크로스오버 차량이나 프리미엄 세단에서는 대형 디지털 계기판이 자주 도입되고 있으며, 모델 사이클의 갱신에 따라 중형 부문으로도 확산되고 있습니다. 예전에는 속도계와 연료계만으로도 충분했던 오토바이도, 현재는 소형 TFT 스크린을 채택해 내비게이션 화살표나 착신 알림을 표시하게 되었으며, 이는 도시 지역 라이더들 사이에서 확산되고 있는 스마트폰 문화를 반영하고 있습니다. 플릿용 밴이나 중형 트럭은 아직 뒤처져 있지만, 규제에 따른 데이터 기록 요건이 운전자의 운전 평가 피드백을 표준화하는 디지털 대시보드로의 전환을 촉진하고 있습니다.
자동차 계기판 시장에서 승용차의 우위는 규모의 경제를 창출하며, 이것이 오토바이 및 소형 상용차 분야로도 파급됨에 따라 시장 진입 장벽을 낮추고 있습니다. 라이더들은 순간적인 기어 위치 표시와 블루투스 음악 알림 기능을 높이 평가하고 있으며, 이 컴팩트한 계기판은 라이프스타일의 상징이 되고 있습니다. 자동차 제조업체들은 여러 차체 스타일에서 디자인 언어를 통일하고 있기 때문에 SUV와 해치백은 색상 포인트를 달리하면서도 기본이 되는 그래픽을 공유하고 있습니다. 이러한 접근 방식을 통해 소프트웨어 검증에 소요되는 오버헤드가 줄어듭니다. 이는 업데이트 빈도가 빨라지는 상황에서 매우 중요합니다. 상용차 업체들은 신뢰성 지표를 면밀히 주시하고 있으며, 솔리드 스테이트 클러스터가 실제 현장에서의 내구성을 입증한다면, 화물 가시성에 대한 수요가 높은 버스나 라스트 마일 배송용 트라이크에 대한 채택도 확대될 것입니다.
지역별 분석
2025년 북미는 자동차 계기판 시장 점유율의 35.66%를 차지했습니다. 이는 픽업트럭과 SUV의 견조한 생산 대수에 더해, 대형이며 맞춤 설정이 가능한 스크린을 원하는 소비자들 수요에 힘입은 결과입니다. 연방 정부의 운전 중 주의 산만 방지 지침에 따라 디트로이트의 자동차 제조업체들은 글꼴의 가독성과 경고 메시지의 우선순위를 검증해야 하는 상황에 놓여 있으며, 이는 전 세계의 디자인 언어에 영향을 미치고 있습니다. 또한, 해당 지역에서는 테마 번들을 통해 수익을 창출하는 무선 업데이트(OTA)의 시범 운영도 진행되고 있어, 공급업체들에게 있어 세계 진출에 앞서 북미에서 테스트베드 역할을 하고 있습니다. 반도체 부족으로 인한 공급 차질은 니어쇼어링에 대한 관심을 높였으며, USMCA(미국·멕시코·캐나다 협정)의 규정을 준수하면서도 리드타임을 단축할 수 있는 멕시코의 전자 부품 공장에 대한 새로운 투자를 촉진했습니다. 야간 주행 시의 햅틱 피드백 및 최저 밝기에 관한 주 차원의 새로운 규제는 계기판 백라이트 요건을 더욱 구체화하고 있습니다.
아시아태평양은 가장 빠르게 성장하고 있으며, 2031년까지의 연평균 성장률(CAGR)은 8.05%로 전망됩니다. 중국의 전동화 추진에 따라 배터리 분석 기능을 갖춘 계기판이 요구되고 있는 반면, 2027년에 예정된 물리적 스위치의 의무화는 중요한 조작 기능을 확보하기 위한 조치로서, 계기판의 지속적인 역할을 뒷받침하고 있습니다. 세계 최대의 이륜차 시장인 인도에서는 라이더들이 내비게이션 안내나 착신 알림을 원함에 따라 TFT 디스플레이가 급속히 보급되고 있습니다. 안드라프라데시 주에서 패널 모듈을 현지 조립함으로써 관세 부담이 줄어들고, 공급이 확보되고 있습니다. 일본은 디스플레이 분야의 심도 있는 전문 지식을 바탕으로 고대비 패널을 수출하고 있지만, 공장 통합은 수익성이 높은 OLED 라인으로의 전환을 시사하고 있습니다. 동남아시아 국가들에서는 소형 컬러 클러스터를 탑재한 저가형 전기 스쿠터가 호평을 받으며, 새로운 판매 시장층이 열리고 있습니다.
유럽은 전반적인 성장 속도가 둔화되고는 있지만, 여전히 기술 동향의 선구자 역할을 하고 있습니다. 고급차 제조업체들은 운전석과 조수석 영역에 걸쳐 있는 곡면 OLED 계기판의 실험을 진행 중이며, 소프트웨어를 활용해 내비게이션과 엔터테인먼트 표시 영역을 동적으로 할당하고 있습니다. UNECE(유엔 유럽 경제 위원회)의 규정에 기반한 사이버 보안 거버넌스는 인증 비용을 증가시키는 한편, 고급차 구매자들 간의 신뢰를 뒷받침하는 역할을 하고 있습니다. 유럽의 안전 기준에 따르면, 클러스터에 운전 보조 아이콘을 표시하는 것이 의무화되어 있어, 아날로그 방식을 고수해 온 제조업체들도 하이브리드형 또는 완전 디지털 시스템으로의 전환을 강요받고 있습니다. 지정학적 요인에 따른 에너지 가격 변동에 대응하여, 차량 관리 업체들은 에코 드라이브 점수를 표시하는 대시보드가 탑재된 전기 밴의 도입을 추진하고 있습니다. 동유럽의 수탁 제조업체들은 단일 국가 리스크를 회피하고자 하는 서유럽 브랜드들의 조립 프로그램을 유치하고 있으며, EU의 탄소국경조정메커니즘(CBAM)에 따라 클러스터 내 주요 하위 부품의 현지 조달이 더욱 촉진될 가능성이 있습니다.
기타 혜택 :
- 엑셀 형식 시장 예측(ME) 시트
- 3개월간의 애널리스트 지원
자주 묻는 질문
목차
제1장 서론
제2장 조사 방법
제3장 주요 요약
제4장 시장 구도
제5장 시장 규모 및 성장 예측
제6장 경쟁 구도
제7장 시장 기회 및 향후 전망
KTH 26.06.22According to Mordor Intelligence, the automotive instrument cluster market size is projected to expand from USD 10.23 billion in 2025 and USD 11.04 billion in 2026 to USD 16.13 billion by 2031, registering a 7.89% CAGR between 2026 and 2031.
This report is Segmented by Cluster Type (Analog Cluster, Digital Cluster, and More), Vehicle Type (Two-Wheelers, Three-Wheelers, and More), Propulsion Type (Internal Combustion Engine (ICE), Battery Electric Vehicle (BEV), and More), Display Technology (Analog Gauge, LCD, and More), Sales Channel (OEM, Aftermarket), and Geography. The Market Forecasts are Provided in Terms of Value (USD).
Global Automotive Instrument Cluster Market Trends and Insights
Shift from Analog to Fully-Digital Clusters
Automakers are retiring mechanical gauges because software-only layouts cut tool-change expense, support over-the-air localization, and accommodate rich driver-assistance graphics. Japanese brands that once favored optitron dials now ship full-LCD meters across volume models, underscoring a global tipping point toward digital clusters. Ford's 2025 recall, triggered by black-screen failures on certain pickups, highlighted the importance of rigorous validation when analog redundancy disappears. To reassure buyers who miss tactile pointers, premium marques are adding haptic feedback and high-contrast OLED panels that mimic physical depth. Suppliers that refine font legibility, color science, and instantaneous wake-up behavior are winning design contests as cluster reliability becomes a safety proxy.
Growing EV Production Needing Battery-State Displays
Battery-electric powertrains compel clusters to show granular energy data, state of charge, distance-to-empty, regenerative braking intensity, and temperature-linked range. Chevrolet's Equinox EV cluster sets a new baseline, presenting charge percentage, energy history, and real-time power flow at a single glance. Driver anxiety over remaining range intensifies demand for dynamic visuals that adapt to terrain and weather. The cluster, therefore, evolves from a passive gauge set to an active coaching tool, nudging behavior that preserves battery health. As more jurisdictions announce combustion-engine phase-outs, instrument-cluster suppliers bundle battery analytics as a core feature rather than an electric-only add-on.
High Cost and Price Sensitivity in Mass-Market Segments
Digital clusters still add material cost compared to analog units, an obstacle in entry-level cars and motorcycles, where buyers favor lower transaction prices. Aftermarket kits demonstrate consumer demand for modern displays but also reveal willingness-to-pay thresholds. Suppliers pursue vertical integration, owning back-light, touch sensor, and board assembly, to shave every dollar. Some OEMs tier options, reserving full digital clusters for premium trims, yet that fragments scale economies and dilutes purchasing leverage.
Other drivers and restraints analyzed in the detailed report include:
- ADAS and Connected-Car Integration Into HMI
- Software-Defined Vehicle Architectures Driving Re-Configurable Clusters
- Legacy Supply-Chain Shortages for ICs / Displays
For complete list of drivers and restraints, kindly check the Table Of Contents.
Segment Analysis
Analog units retained 49.14% of the Automotive instrument cluster market share in 2025, underpinned by cost-driven models and commercial fleets that value rugged simplicity. Yet fully digital clusters, growing at 8.34% CAGR, anchor next-generation cockpits that merge navigation, ADAS alerts, and personalization. Suppliers leverage emissive panels to achieve deep blacks and low latency, enabling context-sensitive themes that switch between sport, eco, and autonomous modes. Regulatory mandates to surface driver-assist status make physical pointers insufficient, accelerating the pivot. Enthusiast circles still admire the tactile sweep of a needle, and heritage brands sometimes blend analog rings with center screens as a bridge to nostalgia.
The Automotive instrument cluster market responds by aligning supply with digital demand. Manufacturers invest in graphics pipelines that compile once and deploy across screen sizes, reducing engineering overhead. As clusters synchronize with head-up displays, redundant warnings fade, freeing real estate for richer maps. Analog holdouts increasingly serve emerging-market two-wheelers or niche off-highway machinery, where glare, vibration, and glove-friendly controls trump styling. Even there, hybrid solutions creep in, a compact TFT inserts between mechanical gauges to satisfy minimum information sets without re-engineering entire dashboards.
Passenger cars captured 56.21% of the Automotive instrument cluster market share in 2025 and are also the fastest-growing segment at 7.75% CAGR through 2031, reflecting lion 's-share production volumes and consumer appetite for connected interiors. Electric crossovers and premium sedans frequently debut large digital clusters that cascade to mid-segments within model-cycle refreshes. Two-wheelers, once content with speed and fuel needles, now adopt small TFT screens to show navigation arrows and call alerts, mirroring smartphone culture among urban riders. Fleet vans and medium trucks lag, yet regulatory data-logging requirements nudge them toward digital dashboards that standardize driver-score feedback.
Within the Automotive instrument cluster market, passenger-car dominance seeds scale economies that bleed into motorcycles and light commercial vehicles, lowering entry barriers. Riders appreciate instantaneous gear-position cues and Bluetooth music prompts, turning compact clusters into lifestyle statements. Carmakers unify design language across multiple body styles, so an SUV and a hatchback share underlying graphics while toggling color accents. The approach reduces software validation overhead, which is crucial as update cadence accelerates. Commercial operators watch reliability metrics; once solid-state clusters prove durable in the field, adoption broadens to buses and last-mile delivery trikes with escalating cargo-visibility needs.
Geography Analysis
North America secured 35.66% of the Automotive instrument cluster market share in 2025, aided by strong pickup and SUV output and consumers eager for large, configurable screens. Federal distraction guidelines press Detroit automakers to validate font clarity and alert priorities, influencing global design language. The region also pilots over-the-air updates that monetize theme bundles, giving suppliers a North American test bed before global rollout. Supply disruptions during semiconductor shortages spurred interest in near-shoring, driving fresh investment in Mexican electronics plants that can meet USMCA rules while shortening lead times. Emerging state-level mandates for haptic feedback and minimum luminance during night driving further shape the back-light requirements for clusters.
Asia-Pacific is the fastest climber, slated for an 8.05% CAGR through 2031. China's electrification push demands clusters tuned to battery analytics, while its 2027 mandate for physical switches safeguards critical controls, confirming the cluster's enduring role. India, the world's largest two-wheeler market, is seeing rapid adoption of TFT displays as riders seek navigation prompts and call alerts. Local assembly of panel modules in Andhra Pradesh reduces tariff load and secures supply. Japan leverages deep display expertise to export high-contrast panels, although plant consolidations signal a shift toward higher-margin OLED lines. Southeast Asian nations welcome budget electric scooters with small color clusters, opening new volume tiers.
Europe remains a technology trendsetter despite slower overall expansion. Luxury OEMs experiment with curved OLED clusters spanning the driver and passenger zones, using software to dynamically allocate space between navigation and entertainment. Cybersecurity governance, anchored by UNECE regulations, adds certification costs but also underwrites trust among premium buyers. The continent's safety rules require clusters to host driver-assist icons, coaxing analog holdouts toward hybrid or full digital systems. Geopolitical energy volatility nudges fleets to electrified vans whose dashboards showcase eco-driving scores. Eastern European contract manufacturers attract assembly programs that hedge Western brands against single-country risk, and EU carbon border rules may further promote local sourcing of critical sub-components within their clusters.
- Continental AG
- Robert Bosch GmbH
- Denso Corporation
- Visteon Corporation
- Yazaki Corporation
- Nippon Seiki Co., Ltd.
- Marelli S.p.A.
- Panasonic Automotive Systems Co., Ltd.
- Pricol Limited
- Stoneridge Inc.
- Valeo SA
- Harman International
- LG Display Co., Ltd.
- Hyundai Mobis Co., Ltd.
- Forvia SE
- Innolux Corporation
Additional Benefits:
- The market estimate (ME) sheet in Excel format
- 3 months of analyst support
TABLE OF CONTENTS
1 Introduction
- 1.1 Study Assumptions & Market Definition
- 1.2 Scope of the Study
2 Research Methodology
3 Executive Summary
4 Market Landscape
- 4.1 Market Overview
- 4.2 Market Drivers
- 4.2.1 Shift from Analog to Fully-Digital Clusters
- 4.2.2 Growing EV Production Needing Battery-State Displays
- 4.2.3 ADAS and Connected-Car Integration Into HMI
- 4.2.4 Software-Defined Vehicle Architectures Driving Re-Configurable Clusters
- 4.2.5 Flexible OLED Panels Reducing BOM Cost
- 4.2.6 Demand for Immersive 3D/AR Cockpit Experiences
- 4.3 Market Restraints
- 4.3.1 High Cost and Price Sensitivity in Mass-Market Segments
- 4.3.2 Legacy Supply-Chain Shortages for ICs / Displays
- 4.3.3 Cyber-Security Compliance Burden for Connected Clusters
- 4.3.4 Stricter Driver-Distraction Regulations Capping UI Complexity
- 4.4 Value / Supply-Chain Analysis
- 4.5 Regulatory Landscape
- 4.6 Technological Outlook
- 4.7 Porter's Five Forces
- 4.7.1 Threat of New Entrants
- 4.7.2 Bargaining Power of Suppliers
- 4.7.3 Bargaining Power of Buyers
- 4.7.4 Threat of Substitutes
- 4.7.5 Competitive Rivalry
5 Market Size & Growth Forecasts (Value, (USD))
- 5.1 By Cluster Type
- 5.1.1 Analog Cluster
- 5.1.2 Digital Cluster
- 5.1.3 Hybrid Cluster
- 5.2 By Vehicle Type
- 5.2.1 Two-Wheelers
- 5.2.2 Three-Wheelers
- 5.2.3 Passenger Cars
- 5.2.4 Light Commercial Vehicles (LCV)
- 5.2.5 Medium and Heavy Commercial Vehicles (MHCVs)
- 5.2.6 Buses and Coaches
- 5.3 By Propulsion Type
- 5.3.1 Internal Combustion Engine (ICE)
- 5.3.2 Battery Electric Vehicle (BEV)
- 5.3.3 Plug-in Hybrid Electric Vehicle (PHEV)
- 5.3.4 Hybrid Electric Vehicle (HEV)
- 5.3.5 Fuel Cell Electric Vehicle (FCEV)
- 5.4 By Display Technology
- 5.4.1 Analog Gauge
- 5.4.2 LCD
- 5.4.3 OLED
- 5.4.4 TFT
- 5.4.5 HUD (Head-Up Display)
- 5.5 By Sales Channel
- 5.5.1 Original Equipment Manufacturer (OEM)
- 5.5.2 Aftermarket
- 5.6 By Geography
- 5.6.1 North America
- 5.6.1.1 United States
- 5.6.1.2 Canada
- 5.6.1.3 Rest of North America
- 5.6.2 South America
- 5.6.2.1 Brazil
- 5.6.2.2 Argentina
- 5.6.2.3 Rest of South America
- 5.6.3 Europe
- 5.6.3.1 United Kingdom
- 5.6.3.2 Germany
- 5.6.3.3 Spain
- 5.6.3.4 Italy
- 5.6.3.5 France
- 5.6.3.6 Russia
- 5.6.3.7 Rest of Europe
- 5.6.4 Asia-Pacific
- 5.6.4.1 India
- 5.6.4.2 China
- 5.6.4.3 Japan
- 5.6.4.4 South Korea
- 5.6.4.5 Rest of Asia-Pacific
- 5.6.5 Middle East and Africa
- 5.6.5.1 United Arab Emirates
- 5.6.5.2 Saudi Arabia
- 5.6.5.3 Turkey
- 5.6.5.4 Egypt
- 5.6.5.5 South Africa
- 5.6.5.6 Rest of Middle East and Africa
- 5.6.1 North America
6 Competitive Landscape
- 6.1 Market Concentration
- 6.2 Strategic Moves
- 6.3 Market Share Analysis
- 6.4 Company Profiles (Includes Global Level Overview, Market Level Overview, Core Segments, Financials as Available, Strategic Information, Market Rank/Share for Key Companies, Products and Services, SWOT Analysis, and Recent Developments)
- 6.4.1 Continental AG
- 6.4.2 Robert Bosch GmbH
- 6.4.3 Denso Corporation
- 6.4.4 Visteon Corporation
- 6.4.5 Yazaki Corporation
- 6.4.6 Nippon Seiki Co., Ltd.
- 6.4.7 Marelli S.p.A.
- 6.4.8 Panasonic Automotive Systems Co., Ltd.
- 6.4.9 Pricol Limited
- 6.4.10 Stoneridge Inc.
- 6.4.11 Valeo SA
- 6.4.12 Harman International
- 6.4.13 LG Display Co., Ltd.
- 6.4.14 Hyundai Mobis Co., Ltd.
- 6.4.15 Forvia SE
- 6.4.16 Innolux Corporation
7 Market Opportunities & Future Outlook
- 7.1 White-Space & Unmet-Need Assessment