

|
시장보고서
상품코드
2063283
화학제품 TIC 시장 : 시장 점유율 분석, 업계 동향 및 통계, 성장 예측(2026-2031년)Chemical TIC - Market Share Analysis, Industry Trends & Statistics, Growth Forecasts (2026 - 2031) |
||||||
 Mordor Intelligence
에 의하면, 화학제품 TIC 시장은 2025년에 238억 4,000만 달러로 평가되었고, 2026년 250억 3,000만 달러로 추정되고, 2031년까지 319억 1,000만 달러로 성장할 전망이며, 2026-2031년 연평균 복합 성장률(CAGR)은 4.98%에 이를 것으로 추정되고 있습니다.
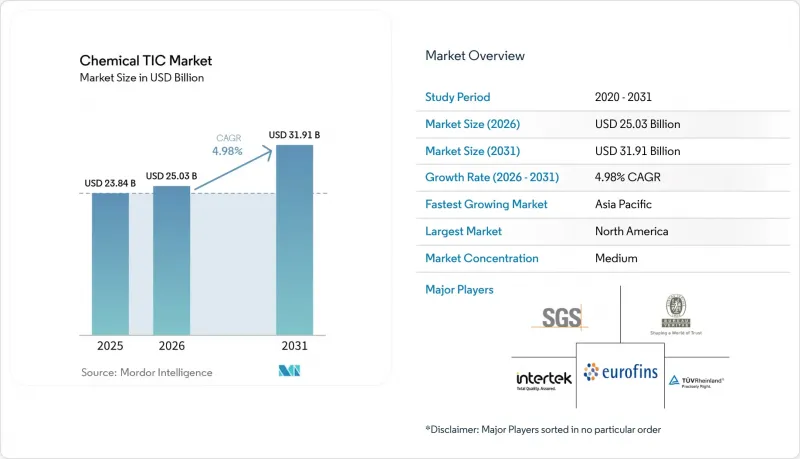
본 보고서는 서비스 유형별(시험, 검사, 인증), 조달 유형별(사내, 외부 위탁), 서비스 제공 형태별(온사이트, 오프사이트 및 실험실, 원격 및 디지털) 및 지역별(북미, 유럽, 아시아태평양, 중동 및 아프리카, 남미)로 분류되어 있습니다. 시장 전망은 금액(달러) 기준으로 제시되어 있습니다.
세계의 화학제품 TIC 시장 동향 및 인사이트
세계 화학제품 안전 규제 강화
EU의 '1물질 1평가' 규정 및 미국의 PFAS 기준치 강화로 인해 신청 기간이 단축되고 분석 기준이 상향 조정되었습니다. EPA 메소드 533, 537.1 및 1633과 같은 프로그램은 현재 계약 수주 여부를 결정하는 기준이 되고 있으며, 검증된 프로토콜을 갖추지 못한 검사 기관은 수익성이 높은 지자체 입찰에 참여할 기회를 잃고 있습니다. EU 통합 서류 제도에 따라 각국에서의 중복 심사가 사라졌기 때문에 수출업체 입장에서는 조기에 규정 준수 조치를 취하는 것이 필수적입니다. 이러한 움직임들이 맞물리면서, 여러 관할 구역에서 인가를 받은 검사 기관의 경쟁 우위가 더욱 강화되고, 수익성이 높은 규정 준수 시험이 활성화되고 있습니다.
강화되는 지속가능성 및 ESG 공시 의무화
EU의 CSRD(기업 지속가능성 보고 지침) 및 ESRS(환경·사회·지배구조 보고 기준)에 따라, 2024년도 보고서부터 약 5만 개 기업에 대해 제3자 보증이 의무화되었습니다. 검증 대상은 현재 온실가스 배출량, 물, 폐기물, 생물다양성 지표까지 확대되어 있으며, 이는 라이프사이클 분석, 환경 제품 선언, 탄소 발자국 라벨에 대한 수요를 이끌고 있습니다. 미국 증권거래위원회(SEC)의 유사한 규정은 적용 범위가 다소 제한적이지만, 여전히 감사 가능한 스코프 1 및 2 데이터를 요구하고 있습니다. 이에 대해 대형 시험·검사·인증(TIC) 그룹은 재무 감사, 환경 감사, 프로세스 감사를 패키지로 묶어 다년 계약을 체결하는 방식으로 대응하고 있습니다.
고급 분석 장비의 높은 도입 비용
1조 분의 1 수준까지 검출하는 데 필요한 LC-MS/MS 및 ICP-MS 시스템은 일반적으로 50만 달러 이상의 비용이 듭니다. 연간 유지보수 계약 및 소모품 비용은 초기 비용에 최대 20%가 추가됩니다. 클린룸 건설, 초순수 시스템, 특수 폐기물 처리 라인 등을 포함하면, 수익성이 확보되는 샘플 수는 연간 2만 5,000건을 넘어, 지역 연구소에서는 도저히 달성할 수 없는 수준이 됩니다. 신흥 시장에서는 저비용 자금 조달 기회가 제한적이기 때문에 이러한 장벽은 더욱 높아져, 소규모 기업들은 제휴나 사업 매각을 선택할 수밖에 없는 상황에 처해 있습니다.
부문별 분석
인증 서비스 시장은 2031년까지 연평균 성장률(CAGR) 5.25%로 확대될 전망이며, 이는 '설계 단계부터의 안전성(safe-by-design)'에 대한 강조, 재활용 소재 함유량 검증, 그리고 탄소 중립 표시에 대한 수요를 반영한 것입니다. 시험 서비스는 PFAS 검출, 원료의약품의 배치 출시 및 수출 적합성 검사에 힘입어 2025년 화학물질 TIC 시장에서 62.23%라는 압도적인 점유율을 유지했습니다. 가치 제안은 단순한 처리 능력에서 신뢰할 수 있는 데이터 패키지와 신속한 대응으로 전환되고 있습니다. ISO/IEC 17025 인증은 여전히 시장 진입의 기본 조건이지만, 현재 고객들은 이를 ISO 9001이나 ISO 14001, 또는 EPA 국가환경시험소인증프로그램(NELAP)과 같은 업계별 인증 체계와 결합하여 요구하고 있습니다. 이에 대응하여 인증 기관들은 특히 아시아태평양에서 틈새 시장을 공략하는 LCA 컨설팅 기업을 인수하거나, 자체적인 친환경 라벨 포트폴리오를 확대하는 방식으로 대응하고 있습니다.
주목할 만한 변화로, 자동차 및 소비자 가전 등 하류 부문에서 자발적인 화학물질 발자국 벤치마킹이 확산되고 있으며, 이에 따라 공급업체들은 독립적인 '제조 공정 전(cradle-to-gate)' 인증을 취득해야 하는 상황에 직면해 있습니다. 제품의 환경 발자국과 관련된 EU의 규제 강화와 지속 가능한 제품을 위한 에코디자인 규정 또한 새로운 수익원을 창출하고 있습니다. 그 결과, 화학물질 TIC 시장 규모에서 인증이 차지하는 비중은 꾸준히 증가할 것으로 예상되는 반면, 시험소에서는 가격이 아닌 방법론의 심도나 데이터의 완전성을 통해 차별화가 진행되고 있습니다. 검사 업무는 가동 개시 전의 안전 심사나 자산 건전성 점검에서 여전히 중요하지만, 드론, 열화상 카메라, 가스 감지기의 도입으로 인해 현장의 노동 시간은 점차 줄어들고 있습니다.
지역별 분석
북미는 2025년에 32.31%의 시장 점유율을 차지했습니다. 이는 PFAS 규제, 의약품 배치 승인 수요, 그리고 화학 제조 역량의 국내 복귀에 힘입은 결과입니다. 새로운 수질 기준에 따라 LC-MS/MS를 이용한 지속적인 모니터링이 의무화됨에 따라, 미국의 검사 기관들은 2027년 4월의 준수 기한을 앞두고 인증을 취득하기 위해 적극적으로 사업 확장을 추진했습니다. SGS-ATS와 같은 인수를 통해 지리적 서비스 범위가 즉시 확대된 반면, 애리조나주와 루이지애나주에서의 시설 건설은 가동 전 안전 감사를 필요로 했습니다. 캐나다와 멕시코는 다국적 기업들이 공급망을 이전하는 '니어쇼어링'의 혜택을 누리고 있으며, 지역별 시험 허브 설립이 촉진되고 있습니다.
유럽은 CSRD(화학물질 지속가능성 전략) 및 지역 전체의 순환 경제 목표를 통해 견고한 기반을 유지하고 있습니다. 현재 약 5만 개 기업이 지속가능성 데이터에 대한 제한적 보증 또는 합리적 보증을 취득해야 하는 의무가 있으며, 이로 인해 인증 기관의 업무량이 증가하고 있습니다. 독일, 프랑스, 영국, 이탈리아가 수주를 주도하고 있지만, 에너지 가격 급등과 탈탄소화 비용으로 인해 일부 현지 검사 기관의 이익률이 압박받고 있습니다. 2029년에 도입될 예정인 EU 공통 데이터 플랫폼은 국경을 초월한 인증의 상호 인정을 더욱 효율화할 것으로 기대되며, 대규모 사업자에게 경쟁 우위를 제공할 것입니다.
아시아태평양은 연평균 성장률(CAGR) 5.81%를 기록하며, 2031년까지 가장 빠르게 성장할 지역입니다. 중국만 해도 2025-2026년 1,200만 톤 이상의 폴리올레핀 생산 능력 확충을 계획하고 있으며, 한편 인도는 향후 10년 동안 870억 달러 규모의 석유화학 투자를 목표로 하고 있습니다. 신규 플랜트 건설에는 가동 전 안전 심사, ISO 14001 인증, 제품 품질 증명이 필요하며, 이것이 수년에 걸친 TIC(기술 도입 비용) 수요를 뒷받침하고 있습니다. 상하이, 뭄바이, 싱가포르의 지역 허브는 그 대상 범위를 배터리 재료, 수소, 반도체용 화학제품으로 확대되고 있습니다.
기타 혜택 :
- 엑셀 형식 시장 예측(ME) 시트
- 3개월간의 애널리스트 지원
자주 묻는 질문
목차
제1장 서론
제2장 조사 방법
제3장 주요 요약
제4장 시장 구도
제5장 시장 규모 및 성장 예측
제6장 경쟁 구도
제7장 시장 기회 및 향후 전망
AJY 26.06.22According to Mordor Intelligence, the chemical TIC market was valued at USD 23.84 billion in 2025 and is estimated to grow from USD 25.03 billion in 2026 to USD 31.91 billion by 2031, at a CAGR of 4.98% from 2026 to 2031.
This report is Segmented by Service Type (Testing, Inspection, and Certification), Sourcing Type (In-House, and Outsourced), Mode of Service Delivery (On-Site, Off-site/Laboratory, and Remote/Digital), and Geography (North America, Europe, Asia-Pacific, Middle East, Africa, and South America). The Market Forecasts are Provided in Terms of Value (USD).
Global Chemical TIC Market Trends and Insights
Tightening Global Chemical-Safety Regulations
One-substance-one-assessment rules in the EU and stricter PFAS thresholds in the United States have cut filing times and raised analytical standards. Programs such as EPA Methods 533, 537.1, and 1633 now serve as pass-or-fail gates for contract awards, so labs without validated protocols lose access to lucrative municipal tenders. The unified EU dossier removes duplicate national reviews, making early compliance essential for exporters. These moves, taken together, widen the moat for laboratories with multi-jurisdictional accreditation, boosting high-margin compliance testing.
Rising Sustainability and ESG Disclosure Mandates
The EU CSRD and ESRS made third-party assurance obligatory for roughly 50 000 companies starting with fiscal-year 2024 reports. Verification now covers greenhouse gas emissions, water, waste, and biodiversity metrics, driving demand for life-cycle analysis, environmental product declarations, and carbon footprint labels. Similar rules by the U.S. SEC, though narrower, still require auditable Scope 1 and 2 data. Large testing, inspection and certification (TIC) groups have responded by bundling financial, environmental, and process audits, locking in multi-year contracts.
High Capital Cost of Advanced Analytical Instrumentation
LC-MS/MS and ICP-MS systems required for parts-per-trillion detection routinely cost more than USD 500 000. Annual service contracts and consumables add as much as 20% to the initial outlay. When cleanroom build-outs, ultra-pure water systems, and specialized waste lines are included, breakeven volumes can exceed 25 000 samples per year, levels unattainable for regional labs. Limited access to low-cost credit in emerging markets exacerbates the barrier, forcing smaller firms to enter into partnerships or divestments.
Other drivers and restraints analyzed in the detailed report include:
- Surge in PFAS Ultra-Trace Testing Demand
- Growing Outsourcing to Specialized TIC Providers
- Shortage of Skilled Chemists and Inspectors
For complete list of drivers and restraints, kindly check the Table Of Contents.
Segment Analysis
Certification services are expanding at a 5.25% CAGR through 2031, reflecting demand for safe-by-design claims, recycled-content verification, and carbon-neutral labels. Testing retained a dominant 62.23% share of the chemical TIC market in 2025, driven by PFAS detection, active pharmaceutical ingredient batch release, and export conformity checks. The value proposition is moving from sheer throughput to defensible data packages and quick turnaround. ISO/IEC 17025 accreditation remains the basic entry ticket, but clients now bundle it with ISO 9001 and ISO 14001, or sector-specific schemes such as the EPA National Environmental Laboratory Accreditation Program. Certification bodies are responding by acquiring niche LCA consultancies and expanding voluntary ecolabel portfolios, especially in the Asia-Pacific.
A notable shift is the rise of voluntary chemical-footprint benchmarks in downstream sectors such as automotive and consumer electronics, which press suppliers to obtain independent cradle-to-gate attestations. Tighter EU rules on Product Environmental Footprints and the Ecodesign for Sustainable Products Regulation are also steering new revenue. As a result, certification's share of the chemical TIC market size is projected to climb steadily, while testing laboratories differentiate on method depth and data integrity rather than price. Inspection stays relevant for pre-start-up safety reviews and asset-integrity checks, but drones, thermal cameras, and gas detectors are reducing on-site labor hours.
Geography Analysis
North America captured 32.31% market share in 2025, driven by PFAS regulations, pharmaceutical batch-release demand, and the reshoring of chemical capacity. New water-quality standards require continuous LC-MS/MS monitoring, so laboratories in the United States expanded aggressively to secure accreditation before the April 2027 compliance deadline. Acquisitions such as SGS-ATS immediately increased geographic coverage, while facility builds in Arizona and Louisiana attracted pre-operational safety audits. Canada and Mexico benefit from near-shoring as multinational producers relocate supply chains, spurring the establishment of regional test hubs.
Europe maintains a robust base because of the CSRD, the Chemicals Strategy for Sustainability, and region-wide circular-economy objectives. About 50 000 companies must now secure limited or reasonable assurance on sustainability data, driving volume to certified bodies. Germany, France, the United Kingdom, and Italy dominate orders, though elevated energy prices and decarbonization costs erode margins for some local labs. The coming EU common data platform, slated for 2029, is expected to further streamline cross-border certificate recognition, giving scale players an edge.
Asia-Pacific with 5.81% CAGR is the fastest-growing territory through 2031. China alone plans more than 12 million tonnes of extra polyolefin capacity between 2025 and 2026, while India targets USD 87 billion in petrochemical investments over the decade. Each greenfield plant requires start-up safety reviews, ISO 14001 certifications, and product-quality attestations, underpinning multi-year TIC demand. Regional hubs in Shanghai, Mumbai, and Singapore are widening their scope to battery materials, hydrogen, and semiconductor-grade chemicals.
- SGS SA
- Bureau Veritas SA
- Intertek Group plc
- Eurofins Scientific SE
- TUV Rheinland AG
- DEKRA SE
- Applus Services SA
- UL LLC (UL Solutions Inc.)
- DNV AS
- TUV SUD AG
- ALS Limited
- Element Materials Technology Group Limited
- Lloyd's Register Group Limited
- MISTRAS Group, Inc.
- TUV Nord AG
- Kiwa N.V.
- SOCOTEC Group SA
- Apave International
- Centre Testing International Group Co., Ltd.
- Core Laboratories N.V.
Additional Benefits:
- The market estimate (ME) sheet in Excel format
- 3 months of analyst support
TABLE OF CONTENTS
1 INTRODUCTION
- 1.1 Study Assumptions and Market Definition
- 1.2 Scope of the Study
2 RESEARCH METHODOLOGY
3 EXECUTIVE SUMMARY
4 MARKET LANDSCAPE
- 4.1 Market Overview
- 4.2 Market Drivers
- 4.2.1 Tightening Global Chemical-Safety Regulations
- 4.2.2 Growing Outsourcing to Specialized TIC Providers
- 4.2.3 Rapid Industrial Growth in Asia-Pacific Chemical Production
- 4.2.4 Rising Sustainability and ESG Disclosure Mandates
- 4.2.5 Surge in PFAS Ultra-Trace Testing Demand
- 4.2.6 Digital-Twin Validation for Chemical Plants
- 4.3 Market Restraints
- 4.3.1 High Capital cost of Advanced Analytical Instrumentation
- 4.3.2 Shortage of Skilled Chemists and Inspectors
- 4.3.3 Price Pressure on Commoditized Routine Tests
- 4.3.4 Cyber-Security Liabilities of Cloud-Connected Labs
- 4.4 Industry Value-Chain Analysis
- 4.5 Regulatory Landscape
- 4.6 Technological Outlook
- 4.7 Impact of Macroeconomic Factors on the Market
- 4.8 Porter's Five Forces Analysis
- 4.8.1 Threat of New Entrants
- 4.8.2 Bargaining Power of Suppliers
- 4.8.3 Bargaining Power of Buyers
- 4.8.4 Threat of Substitutes
- 4.8.5 Competitive Rivalry
5 MARKET SIZE AND GROWTH FORECASTS (VALUE)
- 5.1 By Service Type
- 5.1.1 Testing
- 5.1.2 Inspection
- 5.1.3 Certification
- 5.2 By Sourcing Type
- 5.2.1 In-house
- 5.2.2 Outsourced
- 5.3 By Mode of Service Delivery
- 5.3.1 On-site
- 5.3.2 Off-site / Laboratory
- 5.3.3 Remote / Digital
- 5.4 By Geography
- 5.4.1 North America
- 5.4.1.1 United States
- 5.4.1.2 Canada
- 5.4.1.3 Mexico
- 5.4.2 Europe
- 5.4.2.1 United Kingdom
- 5.4.2.2 Germany
- 5.4.2.3 France
- 5.4.2.4 Italy
- 5.4.2.5 Rest of Europe
- 5.4.3 Asia-Pacific
- 5.4.3.1 China
- 5.4.3.2 Japan
- 5.4.3.3 India
- 5.4.3.4 South Korea
- 5.4.3.5 Rest of Asia-Pacific
- 5.4.4 Middle East
- 5.4.4.1 Israel
- 5.4.4.2 Saudi Arabia
- 5.4.4.3 United Arab Emirates
- 5.4.4.4 Turkey
- 5.4.4.5 Rest of Middle East
- 5.4.5 Africa
- 5.4.5.1 South Africa
- 5.4.5.2 Egypt
- 5.4.5.3 Rest of Africa
- 5.4.6 South America
- 5.4.6.1 Brazil
- 5.4.6.2 Argentina
- 5.4.6.3 Rest of South America
- 5.4.1 North America
6 COMPETITIVE LANDSCAPE
- 6.1 Market Concentration
- 6.2 Strategic Moves
- 6.3 Market Share Analysis
- 6.4 Company Profiles (includes Global Level Overview, Market Level Overview, Core Segments, Financials as available, Strategic Information, Market Rank/Share, Products and Services, Recent Developments)
- 6.4.1 SGS SA
- 6.4.2 Bureau Veritas SA
- 6.4.3 Intertek Group plc
- 6.4.4 Eurofins Scientific SE
- 6.4.5 TUV Rheinland AG
- 6.4.6 DEKRA SE
- 6.4.7 Applus Services SA
- 6.4.8 UL LLC (UL Solutions Inc.)
- 6.4.9 DNV AS
- 6.4.10 TUV SUD AG
- 6.4.11 ALS Limited
- 6.4.12 Element Materials Technology Group Limited
- 6.4.13 Lloyd's Register Group Limited
- 6.4.14 MISTRAS Group, Inc.
- 6.4.15 TUV Nord AG
- 6.4.16 Kiwa N.V.
- 6.4.17 SOCOTEC Group SA
- 6.4.18 Apave International
- 6.4.19 Centre Testing International Group Co., Ltd.
- 6.4.20 Core Laboratories N.V.
7 MARKET OPPORTUNITIES AND FUTURE OUTLOOK
- 7.1 White-Space and Unmet-Need Assessment


