
|
시장보고서
상품코드
2063452
마이크로어레이 스캐너 시장 : 점유율 분석, 업계 동향과 통계, 성장 예측(2026-2031년)Microarray Scanners - Market Share Analysis, Industry Trends & Statistics, Growth Forecasts (2026 - 2031) |
||||||
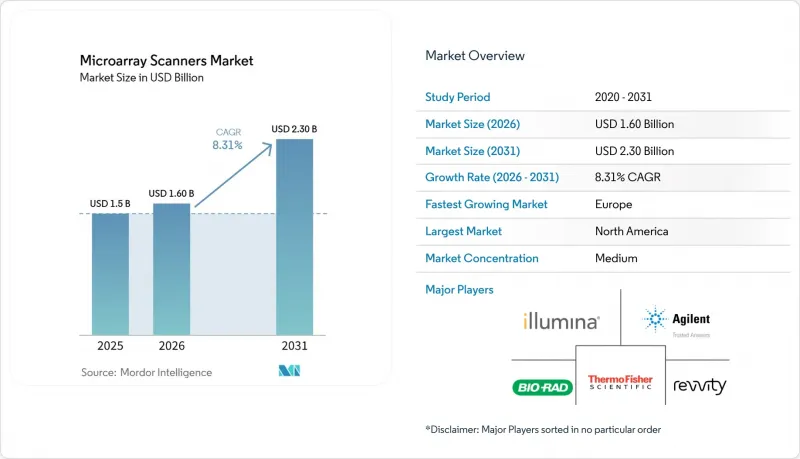
Mordor Intelligence에 의하면, 마이크로어레이 스캐너 시장 규모는 2025년 15억 달러에서 2026년에는 16억 달러로 확대되어 2026년부터 2031년까지 CAGR 8.31%로 성장을 지속하여, 2031년까지 23억 달러에 이를 것으로 예측됩니다.

본 보고서는 제품 유형(형광 스캐너 등), 지원 기술(DNA/CGH/SNP, 메틸화, 단백질/항체/글리칸, miRNA/트랜스크립토믹스), 용도(조사, 진단/임상세포유전학, 신약 개발, 농업 유전체학), 최종 사용자(학술/연구 기관, 제약/생명공학, 병원/진단, 기타), 지역별로 분류되어 있습니다. 시장 전망은 금액(달러) 단위로 제시되어 있습니다.
세계 마이크로어레이 스캐너 시장 동향 및 인사이트
가이드라인에 따른 산전 및 산후 CMA가 임상 검사 건수를 뒷받침하고 있습니다.
모체-태아 의학회(SMFM)는 2025년 1월, CMA를 제1선택 산전 검사로 재확인하였으며, 미국 산부인과 학회(ACOG)도 2026년 3월에 이 입장에 동조하여, 미국 CPT 코드 81228, 81229 및 81349에 따른 보험 급여를 유지했습니다. 캐나다의 전문 기관들도 이와 같은 지지를 유지하고 있어, 북미 전역에서 안정적인 임상 수요의 최저 수준이 확보되고 있습니다. 이러한 정책 덕분에, 엑솜 시퀀싱이 공적 보험 적용 대상이 되더라도 기존 스캐너들이 즉시 구식이 되는 사태는 방지되고 있습니다. 따라서 병원들은 세포유전학 분야의 혁신적인 기술 도입보다는 구형 하드웨어의 교체에 자금을 할당하고 있습니다. 그러나 직접 비교 시험에서 시퀀싱의 진단적 수율이 CMA를 지속적으로 상회하는 경우, 이 완충 효과는 약화될 가능성이 있습니다.
GWAS/에피유전체학 분야에서는 시퀀싱에 비해 조사 어레이가 여전히 비용 대비 효율이 뛰어납니다.
예산이 제한적이고 코호트 규모가 10,000개 표본을 초과하는 대규모 집단 연구에서는 여전히 어레이 기술이 선호되고 있습니다. 일루미나(Illumina)사의 Global Screening Array는 유전자형 분석 비용이 샘플당 40달러인 반면, 비슷한 규모의 저심도 시퀀싱은 80-100달러가 듭니다. MethylationEPIC v2.0은 200달러로 100만 개에 가까운 CpG 부위프로파일링이 가능하며, 전장 유전체 비설파이트 시퀀싱 비용의 4분의 1 수준에 불과해 중국과 일본의 역학 프로그램을 지원하고 있습니다. 비용 면에서의 우위뿐만 아니라, 성숙한 정보학 파이프라인이 구축되어 있는 만큼, 자금 지원 기관은 향후 10년 동안 어레이 연구에 대한 지원을 계속할 전망입니다. 그렇긴 하지만, 어레이를 통해서는 희귀 변이 또는 구조적 변이에 대한 정보를 얻을 수 없기 때문에 정밀 종양학 분야에서 그 역할은 제한적입니다.
시퀀싱에 대한 대안적 압력(소아과에서 ES/GS의 1순위 선택)
2024년 체코에서 실시된 코호트 연구에 따르면, 엑솜 시퀀싱의 진단적 유용성은 48.9%에 달한 반면, CMA(염색체 마이크로어레이)의 과거 유용성은 15-20%에 그쳤습니다. 미국 의학유전학회는 현재 발달 지연에 대한 1차 검사 방법으로 엑솜 시퀀싱을 인정하고 있으며, 이로 인해 마이크로어레이의 독자적인 임상적 타당성이 점차 사라지고 있습니다. 일루미나(Illumina)사의 NovaSeq X는 200달러에 전장 유전체 분석을 제공할 수 있어, 분석 건당 경쟁을 심화시키고 있습니다. 병원 측은 스캐너를 교체할지, 아니면 더 광범위한 진단 메뉴를 지원할 수 있는 시퀀싱 플랫폼에 자금을 투입할지 검토하고 있습니다.
부문별 분석
2025년 시점에서 마이크로어레이 스캐너 시장의 46.53%를 형광 측정 장치가 차지했으나, 화학 발광과 근적외선 채널을 통합한 트리플 모달 검출 기술의 부상에 힘입어, CCD/CMOS 생체분자 이미저 시장은 2031년까지 연평균 성장률(CAGR) 8.57%를 나타낼 것으로 예측됩니다. 제약 기업들이 384-어레이 펩타이드 스크리닝에 대응하기 위해 슬라이드 처리를 자동화함에 따라, 오토로더용 마이크로어레이 스캐너 시장 규모는 2031년까지 3억 5,000만 달러에 달할 것으로 전망됩니다. 비색 스캐너는 틈새 시장이긴 하지만, 레이저 안전 대책 인프라가 갖춰지지 않은 알레르기 검사 실험실에서는 여전히 없어서는 안 될 존재입니다. Innopsys 및 Azure Biosystems와 같은 공급업체들은 16비트 동적 범위를 갖춘 냉각 센서를 공동으로 판매하고 있으며, 1마이크론의 분해능을 구현함으로써 저농도 단백질의 포집 능력을 향상시키고 있습니다. 리퍼브 형광 장비는 1만 5,000달러 미만으로 판매되고 있어, 예산이 제한된 연구실에서는 장비의 수명을 연장하는 한편, 신규 장비 주문은 감소하고 있습니다.
현재 설비 투자 예산에서는 웨스턴 블롯, 핵산, 항체 이미징을 통합하여 실험 공간과 유지보수 비용을 절감할 수 있는 플랫폼이 우선적으로 고려되고 있습니다. Tecan PowerScanner나 Bio-Rad VersaDoc에서 업그레이드를 고려 중인 연구소에서는 워크플로우의 미래 대비를 위해 멀티모드 대체 기종을 선택하는 사례가 늘고 있습니다. Innopsys의 InnoScan 1100 AL과 Azure의 Sapphire는 IVDR(체외진단용 의료기기 규정) 준수로 인해 영상 장비의 통합이 시급한 유럽 시장에서 전년 대비 30%의 수주 증가를 기록하고 있습니다. 형광 전용 시스템은 임상 CMA 실험실에서 여전히 그 중요성을 유지하고 있습니다. 이는 규제상 검증 기준이 기존의 염료에만 적용되기 때문이지만, 신생 시설에서는 단일 모드 옵션을 피하고 통합형 이미저를 선호하여 도입하고 있습니다. 이러한 제품 구성의 변화는 2031년까지의 마이크로어레이 스캐너 시장 동향에 있어 매우 중요합니다.
DNA/CGH/SNP 어레이는 2025년 매출의 51.78%를 차지했으나, 단백질, 항체 및 글리칸 어레이는 2031년까지 연평균 성장률(CAGR) 8.63%로 성장할 전망입니다. 제약 기업들은 항체 특이성을 대규모로 분석하기 위해 9,000개의 특징을 가진 단백질 어레이에 의존하고 있으며, 이러한 활동은 시퀀싱으로는 대체할 수 없습니다. 메틸화 어레이는 시료 1개당 200달러로 93만 5,000곳의 CpG 위치를 분석할 수 있어, 비용과 처리 시간 면에서 비설파이트 시퀀싱을 능가하며 역학 분야에서 확고한 입지를 유지하고 있습니다. 마이크로RNA 및 트랜스크립토믹스 어레이는 RNA-seq에 시장 점유율을 빼앗기고 있지만, 새로운 아이소폼을 규명하는 것보다 비용을 우선시하는 1,000개 이상의 검체를 대상으로 하는 디스커버리 스크리닝에서는 여전히 활용되고 있습니다.
단백질 어레이는 스캐너의 처리 능력을 다각화시켜, 기존의 세포유전학 이외의 분야에서도 수요를 유지하고 있습니다. 글리칸 칩은 바이러스학자들이 바이러스 수용체의 선택성을 규명하는 데 도움을 주며, 펩타이드 라이브러리는 LC-MS보다 신속하게 키나아제 억제제의 선택성을 매핑합니다. 이러한 분석법들은 모두 유리 슬라이드와 고감도 레이저 여기 방식에 의존하고 있어, 하드웨어의 중요성을 다시 한번 입증하고 있습니다. DNA 어레이의 처리량은 한계에 도달할 가능성이 있지만, 비핵산 표적 전체의 총 처리량 덕분에 이용률은 높은 수준을 유지하고 있으며, 이로 인해 마이크로어레이 스캐너 시장을 위협할 수 있는 시퀀싱의 역풍을 완화하고 있습니다.
지역별 분석
북미는 2025년 매출의 44.16%를 차지했으나, 유럽은 검사실에 규격에 부합하는 스캐너로 업그레이드할 것을 의무화하는 체외진단용 의료기기 규정(IVDR)의 시행에 힘입어 연평균 성장률(CAGR) 8.59%로 성장을 주도할 전망입니다. 유럽의 마이크로어레이 스캐너 시장은 2031년까지 연평균 성장률(CAGR) 8.59%로 성장할 것으로 전망됩니다. 아시아·태평양 지역은 중국의 ‘제14차 5개년 계획’에 따른 유전체 연구 지출과 일본의 AMED 코호트 연구의 혜택을 받고 있지만, 인도와 동남아시아에서는 스캐너 비용이 여전히 비싸기 때문에 보급이 더딘 실정입니다. 중동은 사우디아라비아와 UAE가 보험 환급 제도를 공식적으로 도입함에 따라 성장하고 있지만, 절대적인 판매 대수는 여전히 소규모입니다. 아프리카와 남미에서는 인프라 부족으로 인해 2031년까지 신규 도입 대수가 100대 미만에 그칠 것으로 예측됩니다.
IVDR는 소프트웨어 검증 및 시판 후 조사 기준을 강화함으로써, 구매자들이 규제 대응 역량이 풍부한 공급업체를 선택하도록 유도하고 있습니다. 미국의 병원들은 안정적인 CPT 지급 체계 하에서 CMA 처리 능력을 유지하고 있지만, 시퀀싱 지침의 잠재적인 변경 사항을 예의주시하고 있습니다. 중국은 CapitalBio를 통해 국내 생산을 중시하고 있으며, 이를 통해 이미 도입한 장비를 환율 변동의 영향으로부터 보호하고 있습니다. 일본 AMED(의료·건강·노동성)의 자금 지원에 힘입어 SNP 어레이는 국가 바이오뱅크 전략의 중심적인 위치를 계속 차지하고 있는 반면, 싱가포르의 정밀의학 이니셔티브는 동남아시아의 조상 조사 프로젝트에 대응하기 위해 스캐너 주문을 점차 늘리고 있습니다. 따라서 지역별 차이가 수익 구성에 영향을 미치기는 하지만, 규정 준수, 서비스 수준, 그리고 멀티모드 이미징 기술을 모두 갖춘 공급업체에게는 전반적으로 유리하게 작용하고 있습니다.
기타 혜택:
- 엑셀 형식 시장 예측(ME) 시트
- 3개월간의 애널리스트 지원
자주 묻는 질문
목차
제1장 서론
제2장 조사 방법
제3장 주요 요약
제4장 시장 구도
제5장 시장 규모와 성장 예측
제6장 경쟁 구도
제7장 시장 기회와 향후 전망
JHSAccording to Mordor Intelligence, the microarray scanners market size is expected to grow from USD 1.5 billion in 2025 to USD 1.60 billion in 2026 and is forecast to reach USD 2.30 billion by 2031 at 8.31% CAGR over 2026-2031.
This report is Segmented by Product Type (Fluorescence Scanners, and More), Technology Supported (DNA/CGH/SNP, Methylation, Protein/Antibody/Glycan, MiRNA/Transcriptomics), Application (Research, Diagnostics/Clinical Cytogenetics, Drug Discovery, Agrigenomics), End User (Academic/Research, Pharma/Biotech, Hospitals/Diagnostics, Cros), and Geography. Market Forecasts are Provided in Value (USD).
Global Microarray Scanners Market Trends and Insights
Guideline-Backed Prenatal/Postnatal CMA Sustains Clinical Scanning Volumes
The Society for Maternal-Fetal Medicine reaffirmed CMA as first-tier prenatal testing in January 2025, and the American College of Obstetricians and Gynecologists echoed this position in March 2026, preserving reimbursement under U.S. CPT codes 81228, 81229, and 81349. Canada's professional bodies maintain similar endorsements, ensuring a stable clinical demand floor across North America. These policies shield existing scanner fleets from immediate obsolescence even as exome sequencing gains public coverage. Hospitals therefore, allocate capital toward refreshing legacy hardware rather than embracing disruptive technologies in cytogenetics. The cushion, however, may thin if sequencing's diagnostic yield continues to outperform CMA in head-to-head trials.
Research Arrays Remain Cost-Effective for GWAS/Epigenomics vs Sequencing
Large population studies still prefer array technology when budgets are tight and cohort sizes exceed 10,000 samples. Illumina's Global Screening Array costs USD 40 per genotyping sample, versus USD 80-100 for low-pass sequencing at equivalent scale . MethylationEPIC v2.0 profiles nearly one million CpG sites for USD 200, fourfold cheaper than whole-genome bisulfite sequencing, supporting epidemiology programs in China and Japan. Cost advantages, coupled with mature informatics pipelines, encourage funders to extend array grants through the remainder of the decade. Nevertheless, arrays do forfeit rare-variant and structural-variant insight, limiting their role in precision oncology.
Sequencing Substitute Pressure (ES/GS First-Tier in Pediatrics)
A 2024 Czech cohort study showed exome sequencing achieving 48.9% diagnostic yield versus CMA's historical 15-20%. The American College of Medical Genetics now permits exome sequencing as a first-tier test for developmental delay, eroding the unique clinical justification for arrays. Illumina's NovaSeq X can deliver whole genomes at USD 200, intensifying cost-per-answer competition. Hospitals weigh whether to refresh scanners or divert funds to sequencing platforms that satisfy broader diagnostic menus.
Other drivers and restraints analyzed in the detailed report include:
- Large Installed Base Prolongs Scanner Replacement Cycles
- Growth in Protein/Glycan/Peptide Arrays Expands Use Cases
- High Instrument Cost and Specialized Staffing Needs
For complete list of drivers and restraints, kindly check the Table Of Contents.
Segment Analysis
Fluorescence instruments dominated 46.53% of the Microarray scanners market share in 2025, yet CCD/CMOS biomolecular imagers are expected to clock an 8.57% CAGR through 2031, fueled by triple-modal detection that integrates chemiluminescence and near-infrared channels. The Microarray scanners market size for autoloaders is projected to reach USD 350 million by 2031 as pharmaceutical companies automate slide handling to support 384-array peptide screens. Colorimetric scanners, though niche, remain vital in allergy testing labs that lack laser safety infrastructure. Vendors such as Innopsys and Azure Biosystems co-market cooled sensors with 16-bit dynamic range, delivering 1-micron resolution that enhances low-abundance protein capture. Refurbished fluorescence units sell for under USD 15,000, stretching lifecycles in cost-constrained labs but lowering new-unit bookings.
Capital budgets now favor platforms that aggregate Western blot, nucleic-acid, and antibody imaging to cut bench-space and maintenance costs. Laboratories upgrading from Tecan PowerScanner or Bio-Rad VersaDoc often pick multi-mode replacements to future-proof workflows. Innopsys' InnoScan 1100 AL and Azure's Sapphire show 30% year-over-year booking growth in Europe, where IVDR compliance urges consolidation of imaging assets. Fluorescence-only systems maintain relevance in clinical CMA labs because regulatory validation exists only for legacy dyes, yet emerging facilities skip single-mode options in favor of converged imagers. The product mix shift is pivotal to the Microarray scanners market trajectory through 2031.
DNA/CGH/SNP arrays still generated 51.78% of 2025 revenue, but protein, antibody, and glycan arrays will ascend at an 8.63% CAGR by 2031. Pharmaceutical companies rely on 9,000-feature protein arrays to probe antibody specificity at scale, an activity that cannot be substituted by sequencing. Methylation arrays remain entrenched in epidemiology because they interrogate 935,000 CpG loci for USD 200 per sample, beating bisulfite sequencing on cost and turnaround. MicroRNA and transcriptomics arrays lose share to RNA-seq, but persist in more than1,000-sample discovery screens that prioritize cost over novel isoform resolution.
Protein arrays diversify scanner payloads, sustaining demand outside classical cytogenetics. Glycan chips help virologists decode viral receptor preferences; peptide libraries map kinase inhibitor selectivity faster than LC-MS. Such assays all depend on glass slides and high-sensitivity laser excitation, reaffirming hardware importance. DNA array volume may plateau, yet aggregate throughput across non-nucleic targets keeps utilization high, tempering sequencing headwinds that otherwise threaten the Microarray scanners market.
Geography Analysis
North America delivered 44.16% of 2025 revenue, but Europe will lead growth at an 8.59% CAGR thanks to In Vitro Diagnostic Regulation enforcement that compels labs to upgrade to compliant scanners. The Microarray scanners market in Europe is forecast to grow at 8.59% CAGR by 2031. Asia-Pacific benefits from China's 14th Five-Year Plan genomics spending and Japan's AMED cohorts, but penetration lags in India and Southeast Asia, where scanner cost remains prohibitive. The Middle East grows as Saudi Arabia and the UAE formalize reimbursement, although absolute volumes remain modest. Africa and South America add fewer than 100 new units through 2031 due to infrastructure shortfalls.
IVDR raises the bar on software validation and post-market surveillance, steering buyers toward vendors with deep regulatory resources. U.S. hospitals maintain CMA throughput under stable CPT payment but monitor sequencing guidelines for potential shifts. China emphasizes domestic manufacturing through CapitalBio, insulating its installed base from foreign currency swings. Japan's AMED funds keep SNP arrays central to national biobank strategies, while Singapore's Precision Medicine Initiative adds incremental scanner orders to serve Southeast Asian ancestry projects. Regional heterogeneity therefore shapes the revenue mix but uniformly favors vendors that combine compliance, service depth, and multi-mode imaging technology.
- Agilent Technologies
- Applied Precision
- Arrayit
- Azure Biosystems (Sapphire)
- Bio-Rad Laboratories
- CapitalBio Technology
- Cytiva
- Grace Bio-Labs
- Hamamatsu Photonics
- Illumina
- Innopsys
- LI-COR Biosciences
- Molecular Devices
- Oxford Gene Technology
- RayBiotech
- Revvity, Inc
- SCIENION
- Sensovation
- Tecan Group
- Thermo Fisher Scientific
Additional Benefits:
- The market estimate (ME) sheet in Excel format
- 3 months of analyst support
TABLE OF CONTENTS
1 Introduction
- 1.1 Study Assumptions & Market Definition
- 1.2 Scope of the Study
2 Research Methodology
3 Executive Summary
4 Market Landscape
- 4.1 Market Overview
- 4.2 Market Drivers
- 4.2.1 Guideline-Backed Prenatal/Postnatal CMA Sustains Clinical Scanning Volumes
- 4.2.2 Research Arrays Remain Cost-Effective For GWAS/Epigenomics Vs Sequencing
- 4.2.3 Large Installed Base of Arrays Prolongs Scanner Replacement Cycles
- 4.2.4 Growth In Protein/Glycan/Peptide Arrays Expands Use Cases
- 4.2.5 Multi-Mode Imagers Broaden Access to Slide-Based Microarray Scanning
- 4.2.6 MEA Policy Codification (E.G., Western Asia) Strengthens CMA Utilization
- 4.3 Market Restraints
- 4.3.1 Sequencing Substitute Pressure (ES/GS First Tier In Pediatrics)
- 4.3.2 High Instrument Cost and Specialized Staffing Needs
- 4.3.3 Cross-Platform File/Format Incompatibilities
- 4.3.4 Legacy Product Discontinuations and Parts/Service Risk
- 4.4 Supply-Chain Analysis
- 4.5 Regulatory Landscape
- 4.6 Technological Outlook
- 4.7 Porter's Five Forces
- 4.7.1 Threat of New Entrants
- 4.7.2 Bargaining Power of Suppliers
- 4.7.3 Bargaining Power of Buyers
- 4.7.4 Threat of Substitutes
- 4.7.5 Industry Rivalry
5 Market Size & Growth Forecasts (Value, USD)
- 5.1 By Product Type
- 5.1.1 Fluorescence microarray scanners
- 5.1.2 CCD/CMOS biomolecular imagers used for microarrays
- 5.1.3 Colorimetric microarray scanners
- 5.1.4 Autoloaders & workflow accessories
- 5.2 By Technology Supported
- 5.2.1 DNA/CGH/SNP microarrays
- 5.2.2 Methylation microarrays
- 5.2.3 Protein/antibody/glycan microarrays
- 5.2.4 miRNA/transcriptomics arrays
- 5.3 By Application
- 5.3.1 Research applications
- 5.3.2 Disease diagnostics/clinical cytogenetics (CMA, oncology)
- 5.3.3 Drug discovery and screening
- 5.3.4 Agrigenomics/non-human arrays
- 5.4 By End User
- 5.4.1 Academic & research institutes
- 5.4.2 Pharmaceutical & biotechnology companies
- 5.4.3 Hospitals & diagnostic laboratories
- 5.4.4 Contract research/service labs
- 5.5 By Geography
- 5.5.1 North America
- 5.5.1.1 United States
- 5.5.1.2 Canada
- 5.5.1.3 Mexico
- 5.5.2 Europe
- 5.5.2.1 Germany
- 5.5.2.2 United Kingdom
- 5.5.2.3 France
- 5.5.2.4 Italy
- 5.5.2.5 Spain
- 5.5.2.6 Rest of Europe
- 5.5.3 Asia-Pacific
- 5.5.3.1 China
- 5.5.3.2 India
- 5.5.3.3 Japan
- 5.5.3.4 South Korea
- 5.5.3.5 Australia
- 5.5.3.6 Rest of Asia-Pacific
- 5.5.4 Middle East and Africa
- 5.5.4.1 GCC
- 5.5.4.2 South Africa
- 5.5.4.3 Rest of Middle East and Africa
- 5.5.5 South America
- 5.5.5.1 Brazil
- 5.5.5.2 Argentina
- 5.5.5.3 Rest of South America
- 5.5.1 North America
6 Competitive Landscape
- 6.1 Market Concentration
- 6.2 Market Share Analysis
- 6.3 Company Profiles {(includes Global level Overview, Market level overview, Core Segments, Financials as available, Strategic Information, Market Rank/Share for key companies, Products & Services, and Recent Developments)}
- 6.3.1 Agilent Technologies Inc.
- 6.3.2 Applied Precision
- 6.3.3 Arrayit Corporation
- 6.3.4 Azure Biosystems (Sapphire)
- 6.3.5 Bio-Rad Laboratories
- 6.3.6 CapitalBio Technology
- 6.3.7 Cytiva
- 6.3.8 Grace Bio-Labs
- 6.3.9 Hamamatsu Photonics
- 6.3.10 Illumina Inc.
- 6.3.11 Innopsys
- 6.3.12 LI-COR Biosciences
- 6.3.13 Molecular Devices
- 6.3.14 Oxford Gene Technology
- 6.3.15 RayBiotech
- 6.3.16 Revvity, Inc
- 6.3.17 SCIENION
- 6.3.18 Sensovation
- 6.3.19 Tecan Group
- 6.3.20 Thermo Fisher Scientific
7 Market Opportunities & Future Outlook
- 7.1 White-space & unmet-need assessment
