
|
시장보고서
상품코드
2063720
증거 접근 및 네트워크 분야 인공지능(AI) : 시장 점유율 분석, 업계 동향 및 통계, 성장 예측(2026-2031년)AI In Evidence Access And Networks - Market Share Analysis, Industry Trends & Statistics, Growth Forecasts (2026 - 2031) |
||||||
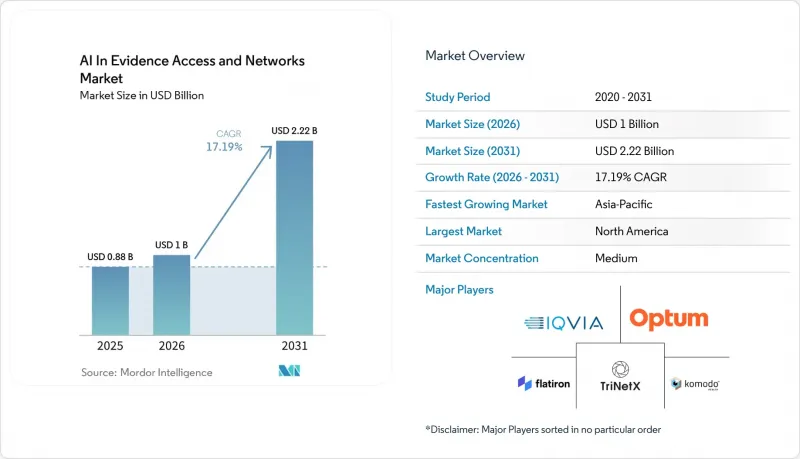
Mordor Intelligence에 의하면, 증거 접근 및 네트워크 분야 인공지능(AI) 시장 규모는 2025년 8억 8,000만 달러로 평가되었습니다. 2026년에는 10억 달러로 확대되어 2031년까지 22억 2,000만 달러에 이를 것으로 예측됩니다.
2026년부터 2031년까지의 연평균 성장률(CAGR)은 17.19%로 전망됩니다.
본 보고서는 구성 요소(데이터 플랫폼 및 네트워크, 분석 및 서비스), 데이터 소스(전자 건강 기록, 기타), 기술(자연어 처리(NLP), 기타), 최종 사용자(제약 및 생명공학 기업, 기타), 지역(북미, 유럽, 아시아태평양, 기타)별로 세분화되어 있습니다. 시장 전망은 금액(달러) 기준으로 제시되어 있습니다.
세계의 증거 접근 및 네트워크 분야 인공지능(AI) 시장 동향 및 인사이트
의약품 승인 과정에서 RWE(실세계 데이터)에 대한 규제 당국의 수용도가 높아지고 있습니다.
FDA는 2025년까지 주로 RWE를 바탕으로 승인된 사례를 이미 23건 기록하고 있으며, 이는 관찰 데이터를 통해 새로운 무작위 대조 시험을 실시하지 않아도 적응증 확대를 확보할 수 있음을 입증하고 있습니다. 2026년 3월, ICH M14 지침에서 ‘목적 적합 데이터’ 및 ‘인과 추론 설계’가 정의됨에 따라, 에비던스 액세스 및 네트워크 내 AI 시장 관련 신청에 대해 엄격하고 명확한 틀이 마련되었습니다. 이와 동시에, EMA의 DARWIN EU는 1억 8,000만 명의 환자를 아우르는 30개의 파트너를 추가하여, 이 연합을 유럽의 표준 아키텍처로 전환했습니다. 일본, 중국, 캐나다는 각각 RWE 플레이북을 발표함으로써, 승인 후 안전성 및 유효성 신호에 대한 전 세계적인 처리 기간을 단축했습니다. 현재 후원사는 지속적인 증거 창출을 기본적인 의무로 간주하고 있으며, 조화로운 데이터 네트워크에 대한 지속적인 투자를 추진하고 있습니다.
EHR 및 청구 데이터량의 기하급수적인 증가
2025년, 의료 분야에서는 175 엑사바이트의 데이터가 생성되어 2018년 대비 7배로 급증했습니다. 그 중 약 80%는 비정형화된 진료 기록이나 영상에 갇힌 채로 남아 있습니다. 미국 내 병원만 해도 연간 약 50페타바이트의 데이터를 생성하고 있어, 기존의 SQL 데이터 웨어하우스로는 이를 감당하기 어려운 문제가 있습니다. 2026년 4월에 발간된 HL7 FHIR-to-OMOP 가이드에 따라, 임상 모델과 관찰 모델 간의 매핑이 마침내 표준화되었으며, 에비던스 액세스 및 네트워크 분야 인공지능(AI) 시장은 맞춤형 추출·변환·로드(ETL) 코드를 사용하지 않고도 여러 기관의 데이터 세트를 쿼리할 수 있게 되었습니다. 동시에, AI 기반 청구 심사 엔진이 청구 처리 주기를 단축시켰으며, 결과 조사의 원동력이 되는 구조화된 청구 기록을 급증시켰습니다. 이러한 데이터의 급증으로 인해, 벤더들은 개인정보 보호 규정을 준수하면서 페타바이트 규모의 데이터를 처리할 수 있도록 토큰화, 익명화 및 자연어 처리(NLP) 파이프라인을 확장해야 하는 상황에 직면해 있습니다.
엄격한 데이터 개인정보 보호 규정(HIPAA, GDPR(EU 개인정보보호규정) 등)
2023년, 의료 분야에서 발생한 단일 데이터 침해 사고로 인한 평균 손해액은 930만 달러에 달했으며, 침해 사실을 발견하기까지 걸린 기간은 287일에 이르렀습니다. 이에 따라, 에비던스 액세스 및 네트워크 분야 인공지능(AI) 시장 관련 규정 준수 예산이 확대되고 있습니다. GDPR(EU 개인정보보호규정)의 벌금 상한선은 전 세계 매출액의 4%로 설정되어 있어, 공급업체들은 유럽 시장을 위한 별도의 데이터 레이크를 운영할 수밖에 없어 비용 구조가 부풀어 오르고 있습니다. 중국의 ‘개인정보보호법’과 인도의 ‘디지털 개인 데이터 보호법’에서는 국내에서의 처리를 의무화하고 있어, 이로 인해 여러 지역에 걸친 증거의 연속성이 단절되고 있습니다. 토큰화 도구는 위험을 줄여주지만, 많은 중견 CRO가 감당하기 어려운 라이선스 비용이 발생하기 때문에 플랫폼 전환이 지연되고 있습니다.
부문별 분석
데이터 플랫폼 및 네트워크는 4억 8,000만 달러의 매출을 창출했으며, 이는 2025년 ‘증거 접근 및 네트워크 분야 인공지능(AI)’ 시장 규모의 54.57%에 해당하며, 페타바이트 규모의 데이터를 수집, 토큰화 및 연동하는 데 필요한 초기 투자 규모를 여실히 보여주고 있습니다. 그러나 광고주들이 예산을 단순한 인프라에서 해석 가능한 인사이트로 전환함에 따라, 분석 및 서비스 분야는 2031년까지 연평균 성장률(CAGR) 18.34%를 나타낼 것으로 전망됩니다. Oracle의 생명과학 AI 데이터 플랫폼은 1억 2,900만 건의 익명화된 기록과 에이전트형 모델을 융합하고 있으며, 이는 의사결정 지원으로의 전환을 시사하고 있습니다. 플랫아이언의 Veeva EDC 연동 기능은 양식 입력 시간을 37초로 단축함으로써, 서비스 팀이 스폰서의 업무 부담을 줄일 수 있음을 입증했습니다. 플랫폼과 컨설팅 스택을 통합하는 벤더(Datavant+Aetion, Tempus+Deep 6 AI)는 현금 흐름을 안정화하기 위한 다년 계약을 체결했습니다.
스토리지 비용의 하락과 오픈소스 연방 학습 프레임워크의 보급에 따라 경쟁 압박이 커지고 있습니다. 서비스 기업들은 독자적인 설명 가능한 AI 모듈을 도입함으로써 상품화 현상에 대응하고 있습니다. FDA의 문서화 요건으로 인해 규제 컨설팅에 대한 수요가 증가하고 있으며, CRO가 플랫폼 접근 권한을 화이트 라벨 방식으로 제공하는 사례가 늘어나면서 밸류체인의 경계가 모호해지고 있습니다. 그 결과, 플랫폼 이용료는 감소하는 반면, 에비던스 액세스 및 네트워크 분야 인공지능(AI) 시장 관련 수익 중 서비스가 차지하는 비중은 점차 증가할 것입니다.
전자건강기록(EHR)은 그 임상적 상세도를 반영하여 2025년 매출의 60.25%를 차지했으나, 청구 데이터 기반 피드는 2031년까지 연평균 성장률(CAGR) 19.42%로 이를 추월할 전망이며, 지불자 분석 분야의 증거 접근 및 네트워크 시장 규모에서 AI가 더 큰 비중을 차지하게 될 것입니다. Komodo의 ‘CMS Innovator’s License’는 1억 3,000만 명의 피보험자에 관한 익명화된 청구 데이터를 제공하며, 이는 경쟁사가 쉽게 재현할 수 없는 귀중한 자산입니다. Symphony Health는 연간 680억 건의 거래 데이터를 종단적 경로로 통합하고 있으며, 복약 순응도 및 비용 분석에 있어 청구 데이터는 필수적인 요소로 자리 잡고 있습니다.
유전체학 및 웨어러블 분야는 여전히 초기 단계이지만, 급속히 성장하고 있습니다. Tempus는 650만 명의 환자에 대한 분자 데이터를 실제 임상 결과와 통합하고 있으며, 애플이 41만 9,297명이 참여한 ‘Heart Study’를 통해 대규모 센서 기반 평가 지표의 유효성을 입증했습니다. 정밀 의학(Precision Medicine)의 파이프라인이 증가함에 따라, 오믹스 피드는 낮은 수준에서 출발하겠지만, 증거 접근 및 네트워크 분야 인공지능(AI) 시장 점유율에서 입지를 확대해 나갈 것입니다.
지역별 분석
북미는 2025년 에비던스 액세스 및 네트워크 분야 인공지능(AI) 시장 매출의 48.31%를 차지했습니다. 이는 FDA의 RWE 지침, 방대한 지불자 데이터 세트, 그리고 2026년 7월까지 FHIR API 사용을 의무화하는 CMS의 상호운용성 약속에 힘입은 결과입니다. Datavant의 300여 개사에 달하는 파트너 생태계와 Optum의 종합적인 클레임 마트는 이 지역의 인프라 성숙도를 보여줍니다. 캐나다의 ‘전 캐나다 건강 데이터 헌장’은 주 간 데이터 교환의 조화를 목표로 하고 있지만, 멕시코의 사회보장 네트워크는 5,000만 명의 수혜자를 포괄하고 있음에도 불구하고 EHR과의 긴밀한 통합에는 이르지 못하고 있습니다.
유럽은 DARWIN EU의 1억 8,000만 명 환자를 보유한 연합은 물론, 영국의 OpenSAFELY, 프랑스의 Health Data Hub 등 각국의 자원이 제공하는 혜택을 누리고 있습니다. GDPR(EU 개인정보보호규정)은 비용이 많이 드는 현지화를 요구하고 있지만, 산학 협력이 공공 부문 차원에서 이를 보완하고 있습니다. 독일의 ‘의료정보학 이니셔티브’는 대학병원들을 연결하고 있지만, 남부 주들의 진전은 더딘 임베디드니다. 다층적인 거버넌스를 극복할 의지가 있는 벤더는 미국과 맞먹는 규모의 연속적인 대륙 규모 코호트에 접근할 수 있습니다.
아시아태평양은 중국의 21개 성에 걸쳐 진행되는 RWE 시범 사업과 인도의 5억 8,000만 건에 달하는 디지털 헬스 계정의 뒷받침을 받아 2031년까지 연평균 성장률(CAGR) 20.12%를 나타낼 것으로 예측되며, 이는 지역별 성장률 중 가장 높은 수치입니다. 일본 PMDA의 지침은 실세계 데이터 제출 요건을 명확히 하고 있으며, 싱가포르의 전자건강기록(EHR) 100% 도입은 고정밀 샌드박스 환경을 제공합니다. 중국과 인도의 현지화 법에 따라 국내에서 데이터를 처리해야 할 의무가 부과되고 있지만, 이러한 격차를 해소하기 위해 국내 클라우드 업체와 스타트업의 네트워크가 급증하고 있습니다. 호주와 한국은 거의 전 인구를 아우르는 디지털 기록 시스템을 구축하는 데 가까워지고 있지만, 지역 거버넌스 문제에 직면해 있습니다. 한편, GCC 국가들은 국가 차원의 EHR 청사진을 수립하고 있으며, 이는 2028년 이후에 본격화될 전망입니다. 이러한 움직임들은 전반적으로, 전 세계적 차원에서 증거 접근성 및 네트워크 시장의 확대에 있어 AI에 구조적인 호재가 될 것입니다.
기타 혜택 :
- 엑셀 형식 시장 예측(ME) 시트
- 3개월간의 애널리스트 지원
자주 묻는 질문
목차
제1장 서론
제2장 조사 방법
제3장 주요 요약
제4장 시장 구도
제5장 시장 규모 및 성장 예측
제6장 경쟁 구도
제7장 시장 기회 및 향후 전망
KTH 26.06.24According to Mordor Intelligence, the aI in evidence access and networks market size is projected to expand from USD 0.88 billion in 2025 to USD 1.00 billion in 2026 and is expected to reach USD 2.22 billion by 2031, with the CAGR over 2026-2031 projected to be 17.19%.

This report is Segmented by Component (Data Platforms and Networks, Analytics and Services), Data Source (Electronic Health Records, and Others), Technology (Natural Language Processing (NLP), and Others), End User (Pharmaceutical and Biotech Companies, and Others), and Geography (North America, Europe, Asia-Pacific, and Others). The Market Forecasts are Provided in Terms of Value (USD).
Global AI In Evidence Access And Networks Market Trends and Insights
Rising Regulatory Acceptance of RWE in Drug Approvals
The FDA already counted 23 approvals supported primarily by RWE through 2025, confirming that observational data can secure label expansions without fresh randomized trials. March 2026 saw the ICH M14 guideline define fit-for-purpose data and causal-inference design, placing stringent but clear rails around AI in evidence access and networks market submissions. In parallel, the EMA's DARWIN EU added 30 partners covering 180 million patients, turning federation into Europe's default architecture. Japan, China and Canada each published RWE playbooks, compressing global timelines for post-approval safety and effectiveness signals. Sponsors now view continuous evidence generation as a baseline obligation, driving sustained spend on harmonized data networks.
Exponential Growth of EHR and Claims Data Volumes
Healthcare created 175 exabytes of data in 2025, a sevenfold jump from 2018, with roughly 80% locked in unstructured notes and images. U.S. hospitals alone generate about 50 petabytes yearly, challenging legacy SQL warehouses. The HL7 FHIR-to-OMOP guide, published April 2026, finally standardizes mappings between clinical and observational models, allowing the AI in evidence access and networks market to query multi-site datasets without bespoke extract-transform-load (ETL) code. Simultaneously, AI adjudication engines trimmed claims-processing cycles, swelling structured billing records that fuel outcomes research. This data deluge compels vendors to scale tokenization, de-identification and NLP pipelines capable of onboarding petabytes while meeting privacy statutes.
Stringent Data-Privacy Regulations (HIPAA, GDPR, etc.)
A single healthcare breach averaged USD 9.3 million in 2023 and carried a 287-day discovery lag, amplifying compliance budgets across the AI in evidence access and networks market. GDPR fines cap at 4% of global revenue, pushing vendors to host duplicate European data lakes that inflate cost structures. China's Personal Information Protection Law and India's Digital Personal Data Protection Act require in-country processing, fracturing multiregional evidence loops. Tokenization tools mitigate risk yet add license fees many mid-tier CROs cannot shoulder, slowing platform migrations.
Other drivers and restraints analyzed in the detailed report include:
- Pharma Demand for Accelerated Trial Design and Post-Marketing Studies
- Integration of AI/ML for Rapid Insight Generation
- Fragmented and Non-Interoperable Healthcare Data Sources
For complete list of drivers and restraints, kindly check the Table Of Contents.
Segment Analysis
Data platforms and networks generated USD 0.48 billion, equal to 54.57% of 2025 revenue in the AI in evidence access and networks market size, underscoring the up-front spend required for ingesting, tokenizing and federating petabyte-scale data. However, analytics and services are forecasted to post an 18.34% CAGR to 2031 as sponsors divert budgets from raw infrastructure to interpretable insights. Oracle's Life Sciences AI Data Platform blends 129 million de-identified records with agentic models, signaling the pivot toward decision support. Flatiron's Veeva EDC linkage cut form-completion time to 37 seconds, proving service layers can eliminate sponsor labor. Vendors that unite platform and consulting stacks-Datavant + Aetion, Tempus + Deep 6 AI-lock in multi-year deals that stabilize cash flows.
Competitive pressure mounts as storage costs fall and open-source federated learning frameworks spread. Service firms counter commoditization by embedding proprietary explainable-AI modules. FDA's documentation mandates magnify demand for regulatory consulting, and CROs increasingly white-label platform access, blurring value-chain borders. Consequently, services will account for a rising slice of AI in evidence access and networks market revenue even as platform fees recede.
Electronic health records contributed 60.25% of 2025 revenue, reflecting their clinical granularity, yet claims-based feeds are projected to outpace at 19.42% CAGR to 2031 and should capture a larger portion of AI in evidence access and networks market size for payer analytics. Komodo's CMS Innovator's License delivered de-identified claims for 130 million beneficiaries, a trove competitors cannot easily replicate. Symphony Health merges 68 billion annual transactions into longitudinal pathways, making claims indispensable for adherence and cost analyses.
Genomics and wearables remain nascent but fast growing. Tempus weaves molecular data from 6.5 million patients into real-world outcomes, and Apple's 419,297-participant Heart Study validated large-scale sensor endpoints. As precision-medicine pipelines multiply, omics feeds will expand their ownership of AI in evidence access and networks market share, albeit from a low base.
Geography Analysis
North America contributed 48.31% of 2025 AI in evidence access and networks market revenue, fueled by FDA RWE guidance, rich payer datasets and the CMS interoperability pledge requiring FHIR APIs by July 2026. Datavant's 300-partner ecosystem and Optum's comprehensive claims mart demonstrate regional infrastructure maturity. Canada's pan-Canadian Health Data Charter aims to harmonize provincial exchanges, while Mexico's social-security network covers 50 million beneficiaries but lacks tight EHR integration.
Europe benefits from DARWIN EU's 180 million-patient federation and national assets like the UK's OpenSAFELY and France's Health Data Hub. GDPR imposes costly localization, yet academic-industry coalitions compensate with public-sector scale. Germany's Medical Informatics Initiative connects university hospitals, although southern states move slower. Vendors willing to navigate multi-layered governance gain access to contiguous continental cohorts that rival U.S. volumes.
Asia-Pacific is expected to grow at a 20.12% CAGR through 2031, the fastest among regions, bolstered by China's 21-province RWE pilots and India's 580 million digital health accounts. Japan's PMDA guidance clarifies real-world data submissions and Singapore's 100% EHR adoption provides a high-fidelity sandbox. Localization laws in China and India force in-country processing, yet domestic cloud vendors and startup networks proliferate to fill the gap. Australia and South Korea approach near-universal digital records but grapple with regional governance, while GCC nations launch national EHR blueprints that will mature after 2028. Collectively, these moves embed structural tailwinds for AI in evidence access and networks market expansion across the hemisphere.
- Aetion
- Datavant
- Elsevier
- Evidation Health
- Flatiron Health
- HealthVerity
- Inovalon
- IQVIA
- Komodo Health
- Merative
- Optum (UnitedHealth Group)
- Oracle
- SAS Institute
- Symphony Health (ICON)
- Syneos Health
- Tempus Labs
- TriNetX
- Veradigm
Additional Benefits:
- The market estimate (ME) sheet in Excel format
- 3 months of analyst support
TABLE OF CONTENTS
1 Introduction
- 1.1 Study Assumptions and Market Definition
- 1.2 Scope of the Study
2 Research Methodology
3 Executive Summary
4 Market Landscape
- 4.1 Market Overview
- 4.2 Market Drivers
- 4.2.1 Rising Regulatory Acceptance of RWE in Drug Approvals
- 4.2.2 Exponential Growth of EHR and Claims Data Volumes
- 4.2.3 Pharma Demand for Accelerated Trial Design and Post-Marketing Studies
- 4.2.4 Integration of AI/ML for Rapid Insight Generation
- 4.2.5 Decentralized Trials Boosting Federated Data-Network Adoption
- 4.2.6 Outcomes-Based Payer Contracts Needing Robust Evidence Platforms
- 4.3 Market Restraints
- 4.3.1 Stringent Data-Privacy Regulations (HIPAA, GDPR, Etc.)
- 4.3.2 Fragmented and Non-Interoperable Healthcare Data Sources
- 4.3.3 High Upfront Costs of Secure Evidence-Network Build-Outs
- 4.3.4 Regulator Concerns on Data Provenance and Algorithm Transparency
- 4.4 Value-Chain Analysis
- 4.5 Regulatory Landscape
- 4.6 Technological Outlook
- 4.7 Porter's Five Forces Analysis
- 4.7.1 Threat of New Entrants
- 4.7.2 Bargaining Power of Suppliers
- 4.7.3 Bargaining Power of Buyers
- 4.7.4 Threat of Substitutes
- 4.7.5 Competitive Rivalry
5 Market Size & Growth Forecasts (Value, USD)
- 5.1 By Component
- 5.1.1 Data Platforms and Networks
- 5.1.2 Analytics and Services
- 5.2 By Data Source
- 5.2.1 Electronic Health Records (EHR)
- 5.2.2 Claims and Billing Data
- 5.2.3 Genomic and Omics Data
- 5.2.4 Patient Registries
- 5.2.5 Others
- 5.3 By Technology
- 5.3.1 Natural Language Processing (NLP)
- 5.3.2 Machine Learning (ML) and Predictive Analytics
- 5.3.3 Others
- 5.4 By End User
- 5.4.1 Pharmaceutical and Biotech Companies
- 5.4.2 Contract Research Organizations (CROs)
- 5.4.3 Healthcare Providers and Payers
- 5.4.4 Others
- 5.5 By Geography
- 5.5.1 North America
- 5.5.1.1 United States
- 5.5.1.2 Canada
- 5.5.1.3 Mexico
- 5.5.2 Europe
- 5.5.2.1 Germany
- 5.5.2.2 United Kingdom
- 5.5.2.3 France
- 5.5.2.4 Italy
- 5.5.2.5 Spain
- 5.5.2.6 Rest of Europe
- 5.5.3 Asia-Pacific
- 5.5.3.1 China
- 5.5.3.2 Japan
- 5.5.3.3 India
- 5.5.3.4 Australia
- 5.5.3.5 South Korea
- 5.5.3.6 Rest of Asia-Pacific
- 5.5.4 Middle East and Africa
- 5.5.4.1 GCC
- 5.5.4.2 South Africa
- 5.5.4.3 Rest of Middle East and Africa
- 5.5.5 South America
- 5.5.5.1 Brazil
- 5.5.5.2 Argentina
- 5.5.5.3 Rest of South America
- 5.5.1 North America
6 Competitive Landscape
- 6.1 Market Concentration
- 6.2 Market Share Analysis
- 6.3 Company Profiles (includes Global level Overview, Market level overview, Core Segments, Financials as available, Strategic Information, Market Rank/Share for key companies, Products & Services, Recent Developments)
- 6.3.1 Aetion
- 6.3.2 Datavant
- 6.3.3 Elsevier
- 6.3.4 Evidation Health
- 6.3.5 Flatiron Health
- 6.3.6 HealthVerity
- 6.3.7 Inovalon
- 6.3.8 IQVIA
- 6.3.9 Komodo Health
- 6.3.10 Merative
- 6.3.11 Optum (UnitedHealth Group)
- 6.3.12 Oracle
- 6.3.13 SAS Institute
- 6.3.14 Symphony Health (ICON)
- 6.3.15 Syneos Health
- 6.3.16 Tempus Labs
- 6.3.17 TriNetX
- 6.3.18 Veradigm
7 Market Opportunities & Future Outlook
- 7.1 White-space & Unmet-need Assessment
